Filter By
280 Repositories
JavaScript Data Visualization
The Swiss Army Knife of Vector Graphics Scripting – Scriptographer ported to JavaScript and the browser, using HTML5 Canvas. Created by @lehni & @puckey
Paper.js - The Swiss Army Knife of Vector Graphics Scripting If you want to work with Paper.js, simply download the latest "stable" version from http:
:dango: An interactive and responsive charting library
English | 简体中文 G2Plot A charting library based on the Grammar of Graphics. G2Plot is an interactive and responsive charting library. Based on the gram
mxGraph is a fully client side JavaScript diagramming library
NOTE 09.11.2020 : Development on mxGraph has now stopped, this repo is effectively end of life. Known forks: https://github.com/jsGraph/mxgraph https:
A visualization grammar.
Vega: A Visualization Grammar Vega is a visualization grammar, a declarative format for creating, saving, and sharing interactive visualization design
Make Your Company Data Driven. Connect to any data source, easily visualize, dashboard and share your data.
Redash is designed to enable anyone, regardless of the level of technical sophistication, to harness the power of data big and small. SQL users levera
A general purpose, real-time visualization library.
Epoch By Ryan Sandor Richards Epoch is a general purpose charting library for application developers and visualization designers. It focuses on two di
Renders HTML into the browser's canvas
rasterizeHTML.js Renders HTML into the browser's canvas. See the API. Install $ npm install rasterizehtml Then include a script tag with node_modules
A visualization grammar. Moved to: https://github.com/vega/vega
Vega: A Visualization Grammar Vega is a visualization grammar, a declarative format for creating and saving interactive visualization designs. With Ve
JavaScript diagramming library for interactive flowcharts, org charts, design tools, planning tools, visual languages.
GoJS, a JavaScript Library for HTML Diagrams GoJS is a JavaScript and TypeScript library for creating and manipulating diagrams, charts, and graphs. S
Simple responsive charts
Big welcome by the Chartist Guy Checkout the documentation site at http://gionkunz.github.io/chartist-js/ Checkout this lightning talk that gives you
An All-in-one Visualization Framework for TiddlyWiki5 based on ECharts
ECharts for TiddlyWiki5 When I first started using TiddlyWiki a long time ago, I wanted TiddlyWiki to be able to visualize data. I wanted to generate
📊 A highly interactive data-driven visualization grammar for statistical charts.

English | 简体中文 G2 A highly interactive data-driven visualization grammar for statistical charts. Website • Tutorial Docs • Blog • G2Plot G2 is a visua
Barcode generation library written in JavaScript that works in both the browser and on Node.js
Introduction JsBarcode is a barcode generator written in JavaScript. It supports multiple barcode formats and works in browsers and with Node.js. It h
Open Source Javascript Gantt

Frappe Gantt A simple, interactive, modern gantt chart library for the web View the demo » Install npm install frappe-gantt Usage Include it in your
HTML5 Canvas Gauge. Tiny implementation of highly configurable gauge using pure JavaScript and HTML5 canvas. No dependencies. Suitable for IoT devices because of minimum code base.
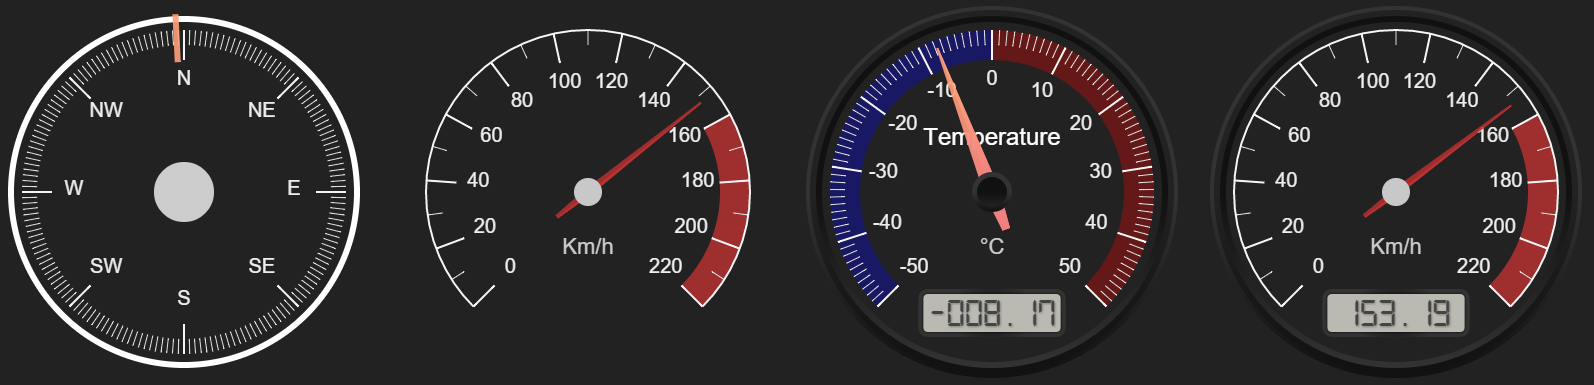
HTML Canvas Gauges v2.1 Installation Documentation Add-Ons Special Thanks License This is tiny implementation of highly configurable gauge using pure
Create PowerPoint presentations with a powerful, concise JavaScript API.
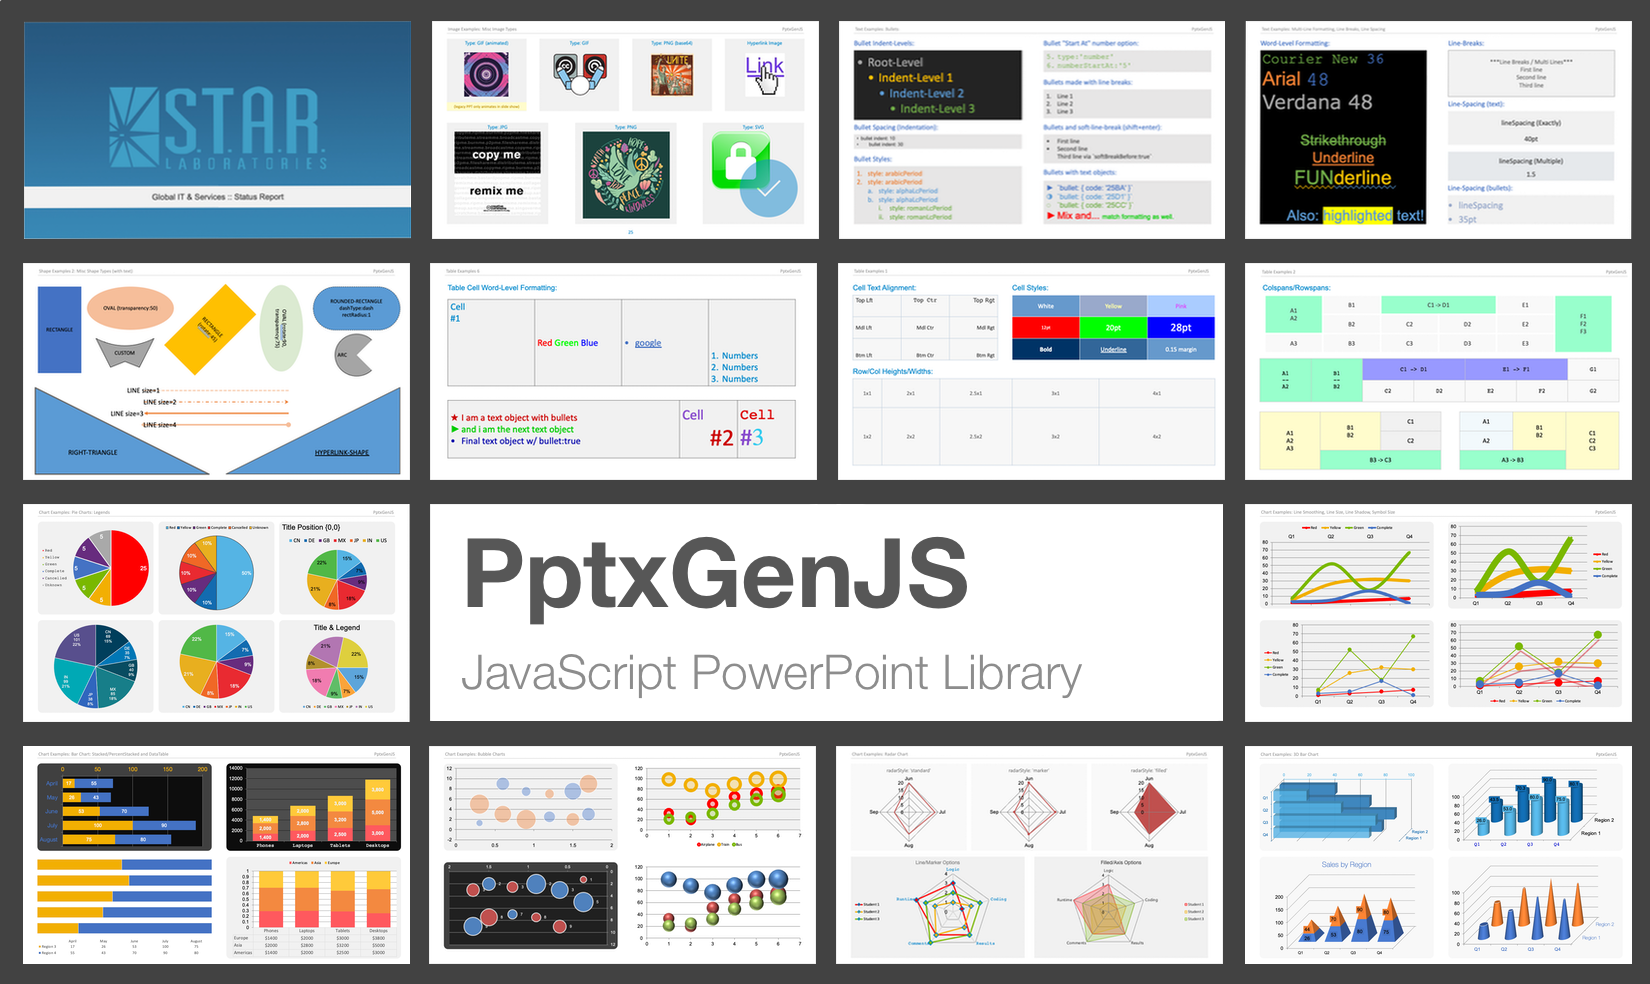
This library creates Open Office XML (OOXML) Presentations which are compatible with Microsoft PowerPoint, Apple Keynote, and other applications.
Easily compose images together without messing around with canvas

merge-images Easily compose images together without messing around with canvas Canvas can be kind of a pain to work with sometimes, especially if you
Grab the color palette from an image using just Javascript. Works in the browser and in Node.
Color Thief Grab the color palette from an image using just Javascript.Works in the browser and in Node. View the demo page for examples, API docs, an
A data visualization framework combining React & D3
Semiotic is a data visualization framework combining React & D3 Interactive Documentation API Docs on the wiki Examples Installation npm i semiotic E
Synchro Charts is a front-end component library that provides a collection of components to visualize time-series data.
Synchro Charts Synchro Charts is a front-end component library that provides a collection of components to visualize time-series data. You can learn m
Chart.js Word Clouds

Chart.js Word Clouds Chart.js module for charting word or tag clouds. Adding new chart type: wordCloud. Related Plugins Check out also my other chart.
🌏 A Declarative 3D Globe Data Visualization Library built with Three.js
Gio.js English | 中文 React Version: react-giojs Wechat minigame: wechat usage Gio.js is an open source library for web 3D globe data visualization buil
Beautiful React SVG maps with d3-geo and topojson using a declarative api.
react-simple-maps Create beautiful SVG maps in react with d3-geo and topojson using a declarative api. Read the docs, or check out the examples. Why R
GPL version of Javascript Gantt Chart
dhtmlxGantt Getting started | Features | Follow us | License | Useful links dhtmlxGantt is an open source JavaScript Gantt chart that helps you illust
Composable data visualisation library for web with a data-first approach now powered by WebAssembly
What is Muze? Muze is a free data visualization library for creating exploratory data visualizations (like Tableau) in browser, using WebAssembly. It
A logseq plugin that lets you find #tags

Logseq Tags Plugin A plugin that lets you find and search all of your #tags. This plugin will query and list all #tags, #[[tags]] and page-tags(tags::
danfo.js is an open source, JavaScript library providing high performance, intuitive, and easy to use data structures for manipulating and processing structured data.
Danfojs: powerful javascript data analysis toolkit What is it? Danfo.js is a javascript package that provides fast, flexible, and expressive data stru
Chart.js module for charting financial securities
Chart.js Financial Charting Chart.js module for Candlestick and OHLC charts Roadmap Chart.js 2.7.0 added our timeseries scale as new option called dis
Read and write OpenType fonts using JavaScript.
opentype.js · opentype.js is a JavaScript parser and writer for TrueType and OpenType fonts. It gives you access to the letterforms of text from the b
JavaScript toolkit for creating interactive real-time graphs
Rickshaw Rickshaw is a JavaScript toolkit for creating interactive time series graphs, developed at Shutterstock Table of Contents Getting Started Ins
Three.js-based room configurator (floor planner + product configurator)

Three.js-based room configurator (floor planner + product configurator) Live Features 1. FloorPlan Design Users can edit floorplan in 2d view mode. Th
Create beautiful JavaScript charts with one line of React
React Chartkick Create beautiful JavaScript charts with one line of React See it in action Supports Chart.js, Google Charts, and Highcharts Quick Star
Miao-Plugin for Yunzai-Bot
#Miao-Plugin说明 Miao-Plugin是一个Yunzai-Bot的升级插件,提供包括角色查询等升级功能。 一些实验性的新功能因功能可能不稳定,或者Yunzai-Bot存在类似功能,会在Miao-Plugin以插件形式提供,可按需选用。 部分非重复功能会在逐步稳定之后会合并入Yunzai
IAM policy actions autocomplete, documentation & wildcard resolution
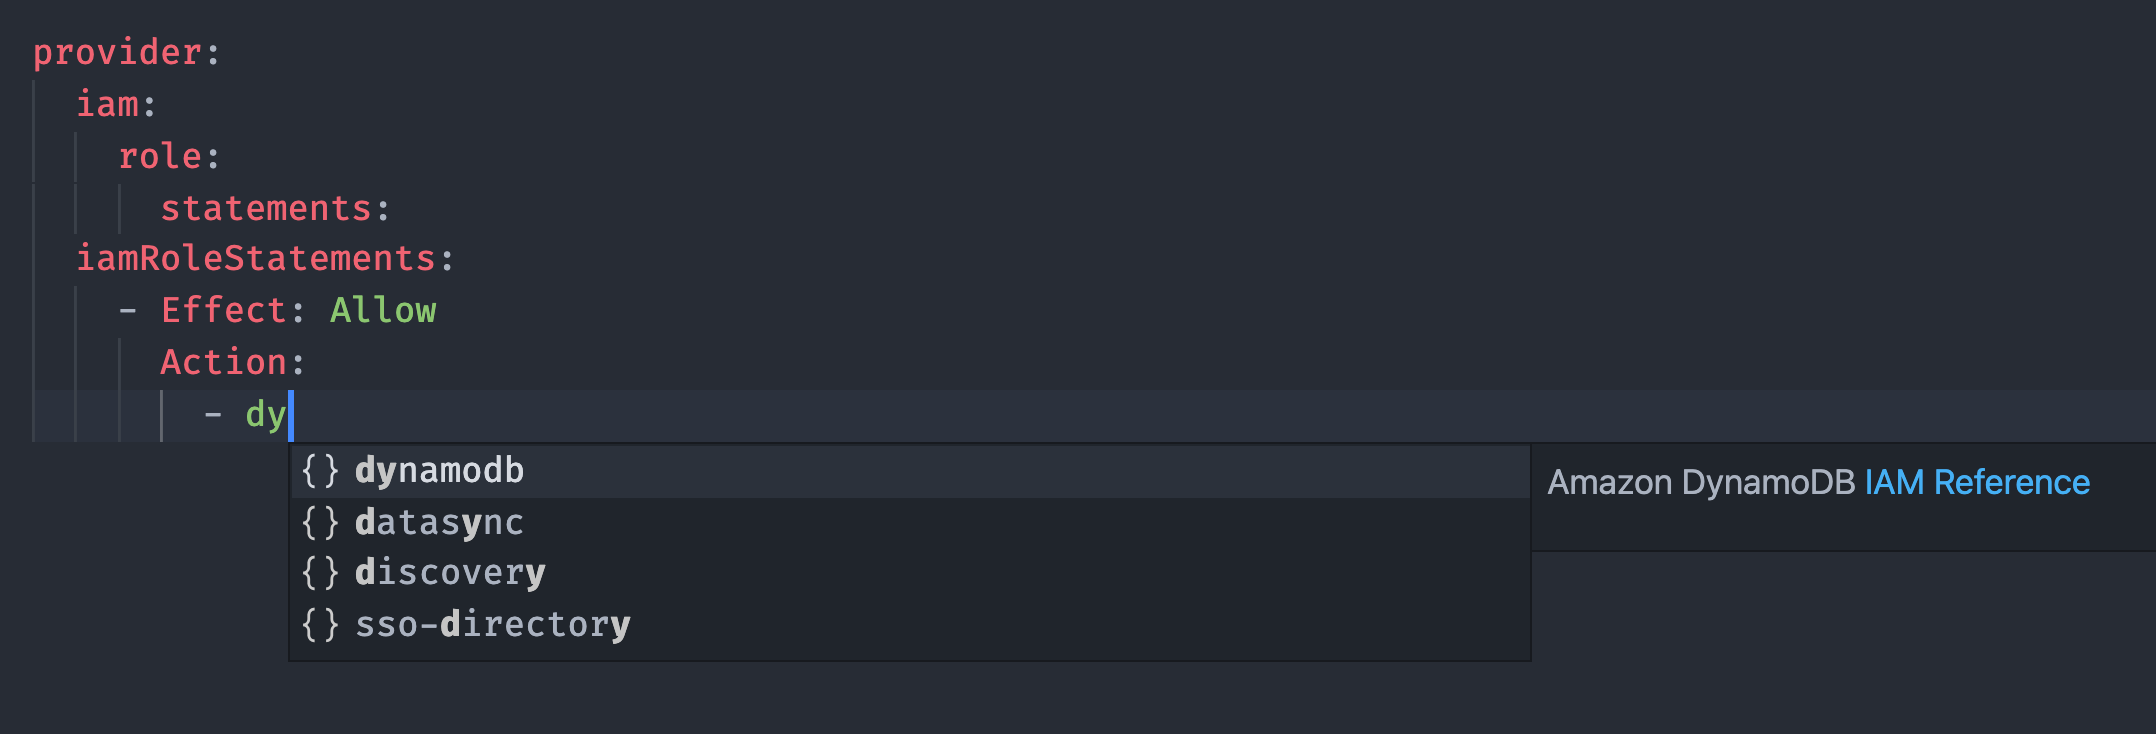
IAM Legend AWS IAM actions autocomplete, documentation and wildcard resolution for Visual Studio Code. Supports Serverless Framework, AWS SAM, CloudFo
Chart.js Choropleth and Bubble Maps
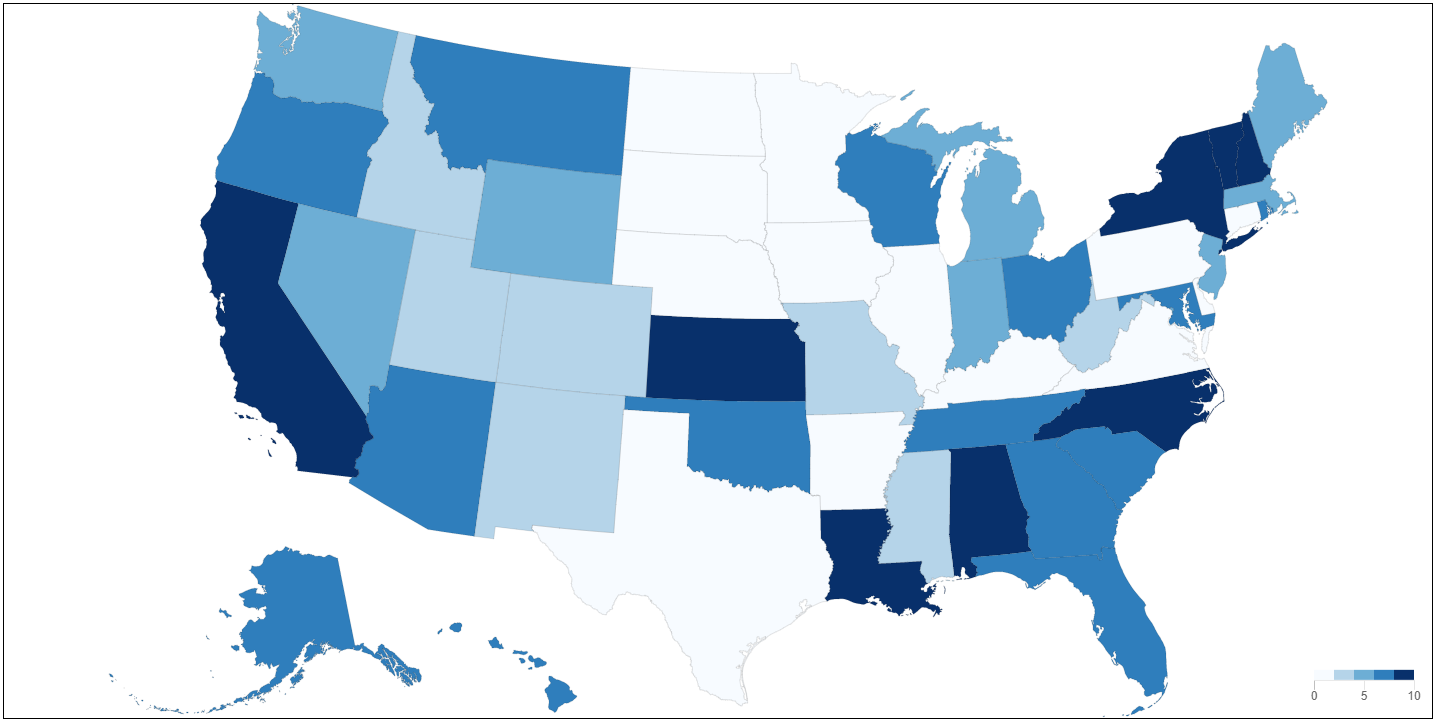
Chart.js Geo Chart.js module for charting maps with legends. Adding new chart types: choropleth and bubbleMap. works great with https://github.com/cha
A damn-sexy, open source real-time dashboard builder for IOT and other web mashups. A free open-source alternative to Geckoboard.
freeboard free·board (noun) *\ˈfrē-ˌbȯrd* the distance between the waterline and the main deck or weather deck of a ship or between the level of the w
A TypeScript library designed to help with making Beat Saber modcharts
Welcome to ReMapper! This is a TypeScript library designed to help with making Beat Saber modcharts. Here are some notable features: Wrappers for Note
DigiDex - an App built on Next.js to query Digimons
Digidex DigiDex is an App built on Next.js to query Digimons. Check out the Website. Leave a 🌟 if you liked it. That would make my day 😊 . Screensho
Mintango - ERC-1155 NFT Minting Dapp

Mintango ERC-1155 NFT Minting Dapp Report Bug · Request Feature Table of Contents About Mintango Features Built With Getting Started Prerequisites Ins
:bar_chart: Declarative Charting Framework for Angular
ngx-charts Declarative Charting Framework for Angular! ngx-charts is unique because we don't merely wrap d3, nor any other chart engine for that matte
Chart.js plugin for live streaming data
chartjs-plugin-streaming Chart.js plugin for live streaming data chartjs-plugin-streaming 2.x requires Chart.js 3.0.0 or later. If you need Chart.js 2
⚠️ This project is not maintained anymore! Please go to https://github.com/visjs
vis.js (deprecated!) ❗ This project is not maintained anymore! (See Issue #4259 for details) We welcome you to use the libraries from the visjs commun
This adapter allows the use of Moment.js with Chart.js
chartjs-adapter-moment Overview This adapter allows the use of Moment.js with Chart.js. Moment.js is a very heavy library and thus not recommended for
📱📈An elegant, interactive and flexible charting library for mobile.

F2,一个专注于移动,开箱即用的可视化解决方案,完美支持 H5 环境同时兼容多种环境(node, 小程序,weex)。完备的图形语法理论,满足你的各种可视化需求。专业的移动设计指引为你带来最佳的移动端图表体验。英文 README 在此衷心感谢《The Grammar of Graphics》的作者
Render echarts in obsidian,Apache ECharts,An Open Source JavaScript Visualization Library

obsidian-echarts Render echarts in obsidian,Apache ECharts,An Open Source JavaScript Visualization Library
A centralized location for my WebGL and other demos.
🔬 Experiments A centralized location for my WebGL and other demos. Launch Site My work is for and funded by the community. If you used this or found
Chart image and QR code web API
QuickChart QuickChart is a service that generates images of charts from a URL. Because these charts are simple images, they are very easy to embed in
Django Class Based Views to generate Ajax charts js parameters.
Django Chartjs Django Chartjs lets you manage charts in your Django application. This is compatible with Chart.js and Highcharts JS libraries. Using a
The lightweight library for manipulating and animating SVG
SVG.js A lightweight library for manipulating and animating SVG, without any dependencies. SVG.js is licensed under the terms of the MIT License. Inst
svgMap is a JavaScript library that lets you easily create an interactable world map comparing customizable data for each country.
svgMap svgMap is a JavaScript library that lets you easily create an interactable world map comparing customizable data for each country. Live demo: h
A cross platform high-performance graphics system.
spritejs.org Spritejs is a cross platform high-performance graphics system, which can render graphics on web, node, desktop applications and mini-prog
Pretty time-series line graphs
Morris.js - pretty time-series line graphs Morris.js is the library that powers the graphs on http://howmanyleft.co.uk/. It's a very simple API for dr
Demonstration of liquid effect on HTML Canvas using Matter.js and SVG Filters (Blur + Contrast)
Canvas Liquid Effect Demonstration of liquid (or gooey) effect on HTML Canvas using Matter.js and SVG Filters (feGaussianBlur and feColorMatrix). DEMO