Filter By
280 Repositories
JavaScript Data Visualization
Chart.js plugin to display labels on data elements
Overview Highly customizable Chart.js plugin that displays labels on data for any type of charts. Requires Chart.js 3.x. Documentation Introduction Ge
Plug is a browser extension for users of the Internet Computer that allows you to access your ICP, Cycles, and other tokens as well as log into IC apps with one click.
Plug Introduction Welcome to Plug! An Internet Computer crypto wallet and authentication provider as a browser extension. Find our latest version in t
A framework for building reusable components with d3.js

Koto A framework for creating reusable charts with D3.js, written in ES6. Introduction KotoJS is HEAVILY inspired by another reusable charting framewo
date-fns adapter for Chart.js
chartjs-adapter-date-fns Overview This adapter allows the use of date-fns with Chart.js. Requires Chart.js 2.8.0 or later and date-fns 2.0.0 or later.
Show page in a more document like look and provide quick exporting.
logseq-plugin-doc 将页面已更加文章化的形式展示,并提供快速导出功能。 Show page in a more document like look and provide quick exporting. 使用展示 (Usage) 关于无序列表 (About bullet list
A curated list of tools that can be used for creating interactive mathematical explorables.
A curated list of tools that can be used for creating interactive mathematical explorables.
An object-oriented API for business analytics
dimple Dimple is an object-oriented API allowing you to create flexible axis-based charts using d3.js. The intention of this project is to allow analy
A library optimized for concise and principled data graphics and layouts.

MetricsGraphics is a library built for visualizing and laying out time-series data. At around 15kB (gzipped), it provides a simple way to produce comm
A library optimized for concise and principled data graphics and layouts.
MetricsGraphics is a library built for visualizing and laying out time-series data. At around 15kB (gzipped), it provides a simple way to produce comm
Attractive JavaScript charts for jQuery
flot About flot is a JavaScript plotting library for engineering and scientific applications derived from Flot: http://www.flotcharts.org/ Take a look
IBM Gantt Chart Component, integrable in Vanilla, jQuery, or React Framework.

@ibm/gantt-chart IBM Gantt Chart Component, integrable in Vanilla, jQuery, or React Framework. Getting started Documentation and Examples are availabl
Luxon adapter for Chart.js
chartjs-adapter-luxon Overview This adapter allows the use of Luxon with Chart.js. Luxon provides built-in support for time zones and internationaliza
Logseq property visualizer

logseq-property-visualizer A plugin to chart or visualize trends in the values of page properties over time. Setup First ensure that you have hkgnp's
a graph visualization library using web workers and jQuery
arbor.js -------- Arbor is a graph visualization library built with web workers and jQuery. Rather than trying to be an all-encompassing framework, a
Visualize COVID-19 risky addresses in Shanghai.
Visualize COVID-19 risky addresses in Shanghai.
Draggable data points plugin for Chart.js

chartjs-plugin-dragdata.js Now compatible with Chart.js v3 🎉 Looking for a version compatible to Chart.js 2.9.x? Then visit the v2 branch! A plugin
Chart.js plugin to calculate and draw statistical linear, exponential, power, logarithmic, and polynomial regressions.
chartjs-plugin-regression Chart.js plugin to calculate and draw statistical linear, exponential, power, logarithmic, and polynomial regressions using
Chart.js module for creating treemap charts

chartjs-chart-treemap Chart.js v3.6.0 module for creating treemap charts. Implementation for Chart.js v2 is in 2.x branch Documentation You can find d
Chart.js scale for hierarchical tree-like data structure
Chart.js Hierarchical Scale Plugin Chart.js module for adding a new categorical scale which mimics a hierarchical tree. Related Plugins Check out also
Automatic color generation for Chart.js

chartjs-plugin-autocolors Automatic color generation for Chart.js The generation is based on Janus Troelsen's answer at Stack Overflow. This plugin re
Minimalistic, animated SVG gauge. Zero dependencies
SVG Gauge Minmalistic, configurable, animated SVG gauge. Zero dependencies Buy me a coffee ☕ If you like my work please consider making a small donati
J2CL and GWT Charts library based on CHART.JS

Charba - J2CL and GWT Charts library based on CHART.JS What's Charba GWT Web toolkit doesn't have charting library available out of the box. There are
Java library for use with Chart.js javascript library
Chart.java Chart.java enables integration with the excellent Chart.js library from within a Java application. Usage example In Java: BarDataset datase
DEPRECATED. Zeppelin has moved to Apache. Please make pull request there
Zeppelin has moved to Apache. Zeppelin's has moved to Apache incubator. This github repository is not going to be synced to the ASF's one after 20/Mar
Simple package to facilitate and automate the use of charts in Laravel 5.x using Chartjs v2 library
laravel-chartjs - Chart.js v2 wrapper for Laravel 5.x Simple package to facilitate and automate the use of charts in Laravel 5.x using the Chart.js v2
Repo for various Tesla internal data visualizations
teslarender Repo for various Tesla internal data visualizations $ http-server -g -c0 -p8899 Access at: http://localhost:8899/?http://fn.lc/s/depthre
A simple script for pure javascript charts.
MK Charts A simple pure Javascript for displaying circle charts. Demo: https://mkirschen.de/mk-scripts/mk-charts/ Circle charts To insert a chart all
Chart.js Box Plots and Violin Plot Charts

Chart.js Box and Violin Plot Chart.js module for charting box and violin plots. This is a maintained fork of @datavisyn/chartjs-chart-box-and-violin-p
Predefined color schemes for Chart.js
chartjs-plugin-colorschemes Predefined color schemes for Chart.js You can pick the perfect color combination for your charts from the predefined color
A GitHub Action to generate reports that contain all the SSH keys, personal access tokens, GitHub App installations, deploy keys and their respective permissions authorized against a GitHub organization.
A GitHub Action to generate reports that contain all the SSH keys, personal access tokens, GitHub App installations, deploy keys and their respective permissions authorized against a GitHub organization.
Smoothie Charts: smooooooth JavaScript charts for realtime streaming data
Smoothie Charts is a really small charting library designed for live streaming data. I built it to reduce the headaches I was getting from watching ch
Banana for Solr - A Port of Kibana
Banana The Banana project was forked from Kibana, and works with all kinds of time series (and non-time series) data stored in Apache Solr. It uses Ki
Easy gradients for Chart.js

chartjs-plugin-gradient Easy gradients for Chart.js This plugin requires Chart.js 3.0.0 or later. Could work with v2, but it is not supported. NOTE th
Crosshair plugin for ChartJS

Chart.js plugin to draw vertical crosshair, zoom, interpolate values and sync chart interactions. Requires Chart.js 3.4.0 or later. Documentation Inst
Vanila JS Sparklines library inspired by peity.js

Peity Vanilla JS Converts an element's content into a svg mini pie donut line or bar chart and is compatible with any browser that supports svg: C
TradeX-chart is a trade chart written in plain (vanilla) JavaScript with minimal dependencies

TradeX-chart is a trade chart written in plain (vanilla) JavaScript with minimal dependencies; use it with any framework or backend.
Extend GitHub pages with support for LaTeX, plotly, etc.
Extend GitHub pages with support for LaTeX, plotly, etc. xhub is a browser extension for Google Chrome that lets you use various add-ons on GitHub REA
The power of Chart.js in Jupyter !

The power of Chart.js in Jupyter Notebooks Installation You can install ipychart from your terminal using pip or conda: # using pip $ pip install ipyc
Awesome charts for AngularJS.

n3-line-chart v2 n3-line-chart is an easy-to-use JavaScript library for creating beautiful charts in AngularJS applications and it is built on top of
Ember Charts 3.5 2.3 L2 JavaScript A powerful and easy to use charting library for Ember.js
Ember Charts A charting library built with the Ember.js and d3.js frameworks. It includes time series, bar, pie, and scatter charts which are easy to
Chart.js Venn and Euler Diagrams
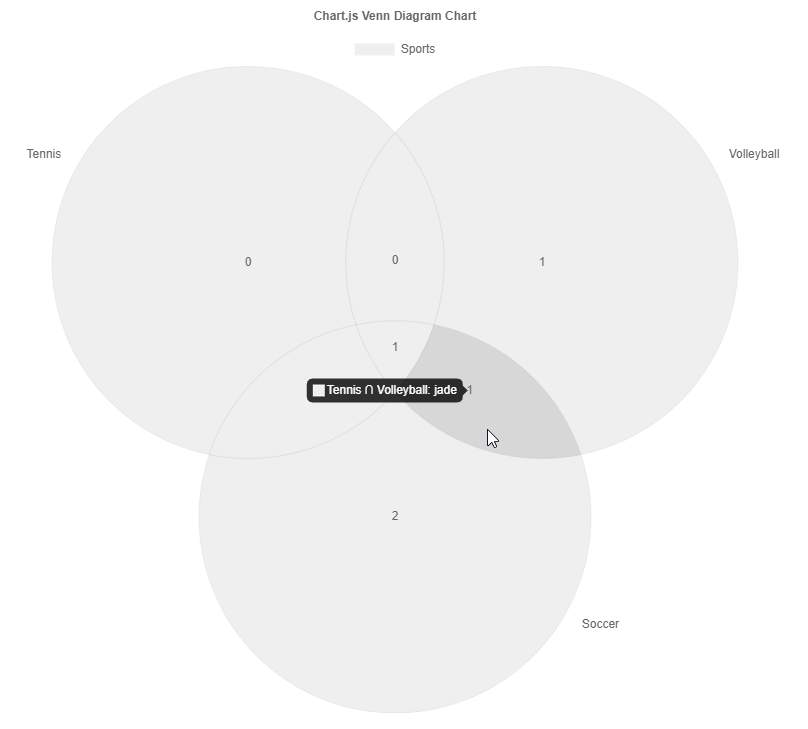
Chart.js Venn and Euler Diagram Chart Chart.js module for charting venn diagrams with up to five sets. Adding new chart type: venn and euler. Related
Chart.js plugin for Prometheus data loading

Welcome to chartjs-plugin-datasource-prometheus 👋 A Prometheus datasource for ChartJS. Dependencies: requires chart.js 2.7 or later. requires moment.
A friendly reusable charts DSL for D3
D4 D4 is a friendly charting DSL for D3. The goal of D4 is to allow developers to quickly build data-driven charts with little knowledge of the intern
3D graph viewer powered by WebGL (three.js)
Graphosaurus A three-dimensional static graph viewer. (click the image to try it out) Demos EVE Online map Add nodes incrementally Documentation JSDoc
The code base that powered India in Pixels' YouTube channel for more than 2 years - now open sourced for you to use on your own projects

India in Pixels Bar Chart Racing For over two years, this nifty code base powered India in Pixels' YouTube channel with videos fetching over millions
Dynamic HTML5 visualization
Envision.js Fast interactive HTML5 charts. http://groups.google.com/group/envisionjs/ Features Modern Browsers, IE 6+ Mobile / Touch Support Pre-built
A javascript library that extends D3.js to enable fast and beautiful visualizations.
d3plus D3plus is a JavaScript re-usable chart library that extends the popular D3.js to enable the easy creation of beautiful visualizations. Installi
Chart.js plugin to create charts with a hand-drawn, sketchy, appearance
chartjs-plugin-rough Chart.js plugin to create charts with a hand-drawn, sketchy, appearance Version 0.2 requires Chart.js 2.7.0 or later, and Rough.j
An HTML5/Canvas implementation of 8-bit color cycling
Overview Here is the JavaScript and C++ source code to my color cycling engine, written in 2010. I am releasing it under the LGPL v3.0. The package co
A tiny TypeScript library for 2D vector math.
Vecti A tiny TypeScript library for 2D vector math. Documentation Features 🧮 Addition, subtraction, multiplication and division ✨ Dot, cross and Hada
Mockpay Checkout for developers to mock payment gateway
Mockpay Checkout Mockpay Checkout is a simple js library that allows you to integrate mockpay into your web apps. Checkout the documentation at: https
Using ASP.NET Core, SignalR, and ChartJs to create real-time updating charts

Real-time Charts with ASP.NET Core, SignalR, and Chart.js This project shows how to update a real-time chart in your web browser using technologies li
CyberGraph is a 3D-graph based, user based social connection explorer

CyberGraph is a 3D-graph based, user based social connection explorer. It has some cool features like 3d node graph, dynamic loading bar, immersive user experience, cyber mode(10-hops friendship network display) and focus mode(aggregated connection display).
Unpack tool for android applications running Shape SDK
shape-unpacker Simple frida agent used to unpack internal classes (com.apiguard3.internal.xxxxx) and native library (libag3.so) from Android applicati