JavaScript diagramming library for interactive flowcharts, org charts, design tools, planning tools, visual languages.

Overview

GoJS, a JavaScript Library for HTML Diagrams

GoJS is a JavaScript and TypeScript library for creating and manipulating diagrams, charts, and graphs.

npm open issues last commit downloads Twitter Follow

See GoJS Samples

Get Started with GoJS

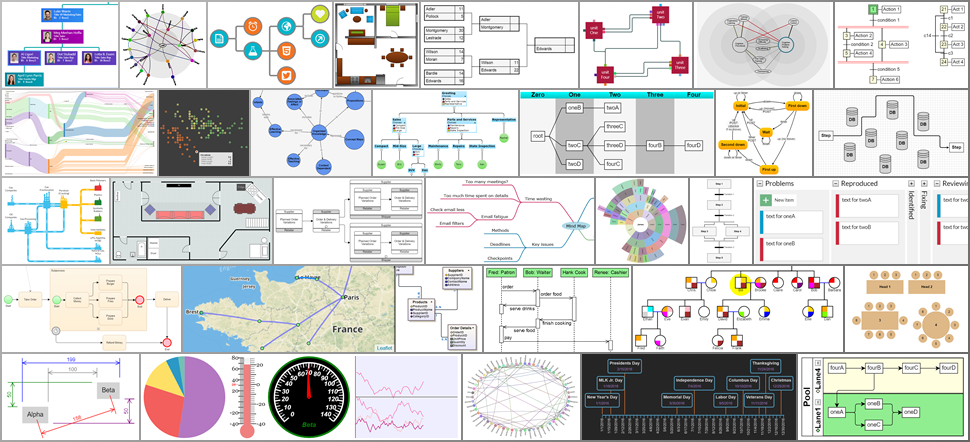
GoJS is a flexible library that can be used to create a number of different kinds of interactive diagrams, including data visualizations, drawing tools, and graph editors. There are samples for flowchart, org chart, business process BPMN, swimlanes, timelines, state charts, kanban, network, mindmap, sankey, family trees and genogram charts, fishbone diagrams, floor plans, UML, decision trees, pert charts, Gantt, and hundreds more. GoJS includes a number of built in layouts including tree layout, force directed, radial, and layered digraph layout, and a number of custom layout examples.

GoJS is rendered with an HTML Canvas element (with export to SVG or image formats). GoJS can run in a web browser, or server side in Node or Puppeteer. GoJS Diagrams are backed by Models, with saving and loading typically via JSON.

Read more about GoJS at gojs.net

This repository contains both the library and the sources for all samples, extensions, and documentation. You can use the GitHub repository to quickly search through all of the sources.

Minimal Sample

Graphs are constructed by creating one or more templates, with desired properties data-bound, and adding model data.

<script src="go.js"></script>

<script id="code">
  function init() {
    var $ = go.GraphObject.make;  // for conciseness in defining templates

    var myDiagram =
      $(go.Diagram, "myDiagramDiv",  // create a Diagram for the DIV HTML element
        { // enable undo & redo
          "undoManager.isEnabled": true
        });

    // define a simple Node template
    myDiagram.nodeTemplate =
      $(go.Node, "Auto",  // the Shape will go around the TextBlock
        $(go.Shape, "RoundedRectangle",
          { strokeWidth: 0, fill: "white" },  // default fill is white
          // Shape.fill is bound to Node.data.color
          new go.Binding("fill", "color")),
        $(go.TextBlock,
          { margin: 8 },  // some room around the text
          // TextBlock.text is bound to Node.data.key
          new go.Binding("text", "key"))
      );

    // but use the default Link template, by not setting Diagram.linkTemplate

    // create the model data that will be represented by Nodes and Links
    myDiagram.model = new go.GraphLinksModel(
    [
      { key: "Alpha", color: "lightblue" },
      { key: "Beta", color: "orange" },
      { key: "Gamma", color: "lightgreen" },
      { key: "Delta", color: "pink" }
    ],
    [
      { from: "Alpha", to: "Beta" },
      { from: "Alpha", to: "Gamma" },
      { from: "Beta", to: "Beta" },
      { from: "Gamma", to: "Delta" },
      { from: "Delta", to: "Alpha" }
    ]);
  }
</script>

The above diagram and model code creates the following graph. The user can now click on nodes or links to select them, copy-and-paste them, drag them, delete them, scroll, pan, and zoom, with a mouse or with fingers.

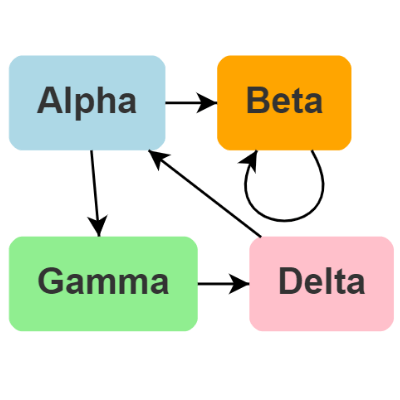
Click the image to see the interactive GoJS Diagram

Support

Northwoods Software offers a month of free developer-to-developer support for GoJS to help you get started on your project.

Read and search the official GoJS forum for any topics related to your questions.

Posting in the forum is the fastest and most effective way of obtaining support for any GoJS related inquiries. Please register for support at Northwoods Software's registration form before posting in the forum.

For any nontechnical questions about GoJS, such as about sales or licensing, please visit Northwoods Software's contact form.

License

The GoJS software license.

Copyright (c) Northwoods Software Corporation

Comments
  • Update to Support TypeScript Module Resolution

    Update to Support TypeScript Module Resolution

    In the release folder, you have a gojs.d.ts file for TypeScript support.

    The latest releases of TypeScript support automatically loading the .d.ts file, if the file is in the root of the package, or if the package.json file includes the "typings" key that points to the .d.ts file.

    Could you please update the package to support automatic module resolution in TypeScript?

    enhancement 
    opened by schmuli 21
  • GoJS and Bootstrap Tabs issue

    GoJS and Bootstrap Tabs issue

    Hello there,

    i've got a strange issue with GoJS and bootstrap tabs.

    The think is (and i'm unfortunately not able to show the code) that if my diagram is in the active tab (fist tab of tabset) it works like a charm. if i move the gojs diagram into for example the second tab and reload the page when i will click the second tab to see the diagram it simply does not render. Everything is there but not render in screen. All elements gets a width and height of 1px.

    I know i'm not very helpful but maybe you have been there. Tried already for hours to find a solution in my source and online but i have no errors at all.

    question; belongs in forum 
    opened by vapits 13
  • Animation while editing a TextBlock cause weird behavior

    Animation while editing a TextBlock cause weird behavior

    Hello, I came across a strange behavior that happens when you edit a text in a TextBlock, and at the same time animate the diagram/node. The text editing window stays in the previous place, and it looks very strange ...

    A reproducible link: https://codepen.io/ba2sik/pen/MWEVrYb Simply click twice on the node to edit the text, and watch editing winow.

    question; belongs in forum intended behavior 
    opened by ba2sik 9
  • Gojs console issue

    Gojs console issue

    image

    Hi, I am using go.js with angular and i am getting error which is described in attached screenshot. project is successfully compiling but getting error in chrome browser's console. Can you please guide me or provide any solution or any solutions links for error solution?

    Thanks in advance

    bug 
    opened by alpeshkalena 9
  • SVG output doesn't write the link to embedded bitmap files

    SVG output doesn't write the link to embedded bitmap files

    Following the fix to this issue: cannot render server side image that contains a Picture #80 https://github.com/NorthwoodsSoftware/GoJS/issues/80

    I modified the sample code you provided in this fix to use the standard template example, but added a PNG to the template (see myDiagram below). Looking at the SVG produced there is no reference to the PNG file found in the output. I also added a Blue background, to the Picture component, as without it there is no reference to the Picture component at all. Since the Blue rectangle displays correctly, I believe the picture reference should also be there.

     // define a simple Node template
        myDiagram.nodeTemplate =
          $(go.Node, "Auto",  // the Shape will go around the TextBlock
            $(go.Shape, "RoundedRectangle", { strokeWidth: 0 },
              new go.Binding("fill", "color")),
            $(go.TextBlock,
              { margin: 8 },
              new go.Binding("text", "key")),
            $(go.Picture, {
                desiredSize: new go.Size(55,55),
                background: "blue",
                source: "images/55x55.png"
            })          
          );
    
        myDiagram.model = new go.GraphLinksModel(
          [
            { key: "Alpha", color: "lightblue" },
            { key: "Beta", color: "orange" },
            { key: "Gamma", color: "lightgreen" },
            { key: "Delta", color: "pink" }
          ],
          [
            { from: "Alpha", to: "Beta" },
            { from: "Alpha", to: "Gamma" },
            { from: "Beta", to: "Beta" },
            { from: "Gamma", to: "Delta" },
            { from: "Delta", to: "Alpha" }
          ]);
    
    bug 
    opened by YanikTheYak 8
  • Typescript compile error:

    Typescript compile error: "... node_modules/gojs/release/go.d.ts' is not a module"

    I use Typescript 1.8 but to fix this issue I need to change following lines in go.d.ts file:

    declare module "go" {  
      export = go;         
    }
    

    to export = go;

    enhancement 
    opened by KostyaDanovsky 7
  • Bug in LinkShiftingTool.ts

    Bug in LinkShiftingTool.ts

    If a link data without 'to' like:

    {
      "points": [
        123.77770660034568, -295.0003859604378, 123.77770660034568, -285.0003859604378, 124.2689901376375,
        -254.99886393596353
      ],
      "from": "6f12aa8f-54f2-46bd-b888-113c86ada914",
      "fromSpot": { "class": "go.Spot", "x": 0.5196570246207027, "y": 0.9999940621471104, "offsetX": 0, "offsetY": 0 }
    }
    

    example

    This link can't shift thier fromSpot.

    The reason is that the function 《doReshape》 in LinkShiftingTool.ts (line 248 and line 263) because link.toPort is null && fromend === 'LinkShiftingTo'

    public doReshape(pt: go.Point): void {
        if (this._handle === null) return;
        const ad = this._handle.part as go.Adornment;
        if (ad.adornedObject === null) return;
        const link = ad.adornedObject.part as go.Link;
        const fromend = ad.category === 'LinkShiftingFrom';
        let port = null;
        if (fromend) {
          port = link.fromPort;
        } else {
          port = link.toPort;  // =>  port = link.toPort ?? link.fromPort
        }
        if (port === null) return;
        // support rotated ports
        const portang = port.getDocumentAngle();
        const center = port.getDocumentPoint(go.Spot.Center);
        const portb = new go.Rect(port.getDocumentPoint(go.Spot.TopLeft).subtract(center).rotate(-portang).add(center),
                                  port.getDocumentPoint(go.Spot.BottomRight).subtract(center).rotate(-portang).add(center));
        let lp = link.getLinkPointFromPoint(port.part as go.Node, port, center, pt, fromend);
        lp = lp.copy().subtract(center).rotate(-portang).add(center);
        const spot = new go.Spot(Math.max(0, Math.min(1, (lp.x - portb.x) / (portb.width || 1))),
                                 Math.max(0, Math.min(1, (lp.y - portb.y) / (portb.height || 1))));
        if (fromend) {  //// => if (fromend || link.toPort === null)
          link.fromSpot = spot;
        } else {
          link.toSpot = spot;
        }
      }
    
    enhancement 
    opened by Darma1106 5
  • zOrder management for parts

    zOrder management for parts

    Hi , I am making a BPMN editor, with basic feature for zOrder management:

    • arrange bring forward
    • arrange bring front
    • arrange send backward
    • arrange send back

    I don't figure out how to make this work. Since we only have zOrder property for Part. But go model have group and group in group. It's so complicate for user to handle all of this. And I think it should be a basic api in go.CommandHandler.

    Do you already made some example or plan for this problem?

    Thx :-)

    enhancement 
    opened by 6174 5
  • Rendering inconsistencies

    Rendering inconsistencies

    I'm experiencing a few rendering issues when using an extended "flowchart" example you have here. I am using version 1.6.16.

    Image 1: image

    Image 2: image

    Issue #1: Diamond

    The Diamond symbol has several ports connected, and the links pictured (in image 1) are going from different ports to different nodes. So it correctly differentiates them and draws individual links. However occasionally the links are rendered on the same line which makes differentiation difficult. The nodes are anchored (and cannot be moved) but if you try to move the node you can recreate this issue.

    I'll try to add all the relevant details but I'm still learning, as I'm evaluating this for commericial use:

    this.diagram = go.GraphObject.make(go.Diagram, this.foo.fooCanvas,
                {
                    allowMove: false,
                    initialAutoScale: go.Diagram.Uniform,
                    initialContentAlignment: go.Spot.Center,
                    layout: go.GraphObject.make(go.TreeLayout,
                        {
                            angle: 90,
                            arrangement: go.TreeLayout.ArrangementHorizontal,
                            sorting: go.TreeLayout.SortingForwards
                        }),
                    "toolManager.mouseWheelBehavior": go.ToolManager.WheelZoom,
                });
    
    this.diagram.linkTemplate = go.GraphObject.make(go.Link,
                {
                    corner: 5,
                    curve: go.Link.JumpOver,
                    routing: go.Link.AvoidsNodes,
                    toShortLength: 4
                },
                go.GraphObject.make(go.Shape,
                    {
                        stroke: "gray",
                        strokeWidth: 2
                    }),
                go.GraphObject.make(go.Shape,
                    {
                        fill: "gray",
                        stroke: null,
                        toArrow: "Standard"
                    })
            );
    

    Issue #2: Not avoiding nodes

    I've used the routing: go.Link.AvoidsNodes so as not to draw over nodes. This works absolutely fine, apart from in the top right (image 1) this goes straight through the next node. However, once again if you try and move the top node around. It realigns itself correctly, as shown in image 2.

    Afterthoughts

    I'm fairly sure these are rendering issues as opposed to something I've missed out in setup/config of the graphs. Trying to realign nodes and links almost "flushes" through some of the above issues. Any thoughts?

    question; belongs in forum 
    opened by herecydev 5
  • Problem with GoJS and bootstrap

    Problem with GoJS and bootstrap

    There is a problem with GoJS library, if I use twitter's bootstrap in the same time. Scrollbars of the stage are dislocated if diagram is bigger than the div container. Some screen caputres of Internet Explorer 9 (similar problem in Chrome too).

    With bootstrap (http://getbootstrap.com/): capture-with-bootstrap

    Without bootstrap: capture-without-bootstrap

    question; belongs in forum 
    opened by iivanov2 5
  • Animation not working when collapsing subgraph

    Animation not working when collapsing subgraph

    Hello, If you look at this demo, when clicking + on Main1, the border/stroke around the items in the group, and the group header, is growing with animation, but when collapsing when clicking -, the stroke around the items and the header simply disappears, without doing it with animation.

    Is it possible to override the closing animation somehow to make it work?

    Thank you

    enhancement question; belongs in forum intended behavior 
    opened by ba2sik 4
Releases(v2.2.21)
  • v2.2.21(Dec 19, 2022)

  • v2.2.20(Dec 13, 2022)

    Changes for 2.2.20

    • Improved LinkingTool.doActivate to assign the location of the LinkingBaseTool.temporaryToNode (or the LinkingBaseTool.temporaryFromNode, if drawing a link in the reverse direction) so as to avoid momentarily seeing where the temporary node had been the last time the user tried to draw a new link.
    • Corrected functionality when a browser cancels a Pointer event (for instance when the browser is minimized during ongoing Pointer events).
    • Corrected GraphObject.mouseLeave sometimes not getting called when the user's pointer leaves the Diagram.
    • Fixed iOS Safari text highlighting when dragging Pointer events out of a Diagram.
    • Fixed a regression from 2.2.18 where link JumpOvers might cause "Change not within a transaction" warnings on model load.
    Source code(tar.gz)
    Source code(zip)
  • v2.2.19(Nov 30, 2022)

    Changes for 2.2.19

    • Event fix for some platforms that reimplement DOM functionality (Polymer and Salesforce Aura components).
    • Graduated panels no longer display shadows on Shape and TextBlock elements when those elements explicitly disable shadows with GraphObject.shadowVisible.
    Source code(tar.gz)
    Source code(zip)
  • v2.2.18(Nov 18, 2022)

    Changes for 2.2.18

    • Fix for some initialization animations which could set Part.location incorrectly.
    • Fixed operation of the LinkShiftingTool extension when the mouse is inside the connected node.
    • The TypeScript extensions are now compiled with options "noImplicitOverride": true, "noUnusedLocals": true.
    • Fix since 2.2.0: Link bounds now always contain all JumpOvers.
    • Fix since 2.2.0: When a Diagram.autoScale is applied, dragging Parts outside of the viewport now reliably triggers a redraw.
    Source code(tar.gz)
    Source code(zip)
  • v2.2.17(Oct 24, 2022)

  • v2.2.16(Sep 29, 2022)

    Changes for 2.2.16

    Source code(tar.gz)
    Source code(zip)
  • v2.2.15(Sep 12, 2022)

    Changes for 2.2.15

    • Fixed non-Path Geometry copies not to have a null value for Geometry.figures.
    • Improved the calculation of the midpoint of Bezier curve Links that have exactly three points in their route.
    • Fixed some empty Table panels causing an exception.
    • Loading the GoJS library twice is now a console warning, instead of an error.
    Source code(tar.gz)
    Source code(zip)
  • v2.2.14(Jul 27, 2022)

  • v2.2.13(Jul 20, 2022)

    Changes for 2.2.13

    • Fixed asynchronous model loading which might intermittently fail to perform AvoidsNodes routing.
    • Enhanced the ArrangingLayout extension to support placing the side nodes about the middle of the side, by supporting values such as go.Spot.Bottom for the ArrangingLayout.side property.
    • Improved the "HyperlinkText" builder extension so that it works by default in Adornments and other Parts that are in temporary layers, by setting GraphObject.isActionable to true.
    • Table panel separator strokes no longer draw if a row or column is empty of visual elements, and will not draw a separator above the first-rendered row/col.
    Source code(tar.gz)
    Source code(zip)
  • v2.2.12(Jun 29, 2022)

    Changes for 2.2.12

    • We have been optimizing the space used by GraphObjects. The heap used by typical large diagrams now occupies about 10% less space. Creating copies of a lot of nodes and links may be a bit faster now too.
    • Fixed the new PanelLayoutFlow extension so that multiple "Flow" panels can coexist in the same panel.
    • Improved GenogramLayout in the Genogram sample to support a horizontal direction as well as the standard vertical direction.
    • Improved the Selectable Fields and Selectable Ports samples so that clicking on fields or ports within a node respects the Control and Shift modifiers to toggle or add to the collection of selected fields or ports.
    • Fixed object picking (Diagram.findObject, GraphObject.containsPoint, etc) for Shapes with a GraphObject.background.
    • The Group.layout property setter now checks to make sure that the new layout is not also the value of Diagram.layout.
    Source code(tar.gz)
    Source code(zip)
  • v2.2.11(Jun 13, 2022)

    Changes for 2.2.11

    Source code(tar.gz)
    Source code(zip)
  • v2.210(May 19, 2022)

  • v2.2.9(May 4, 2022)

    If you are upgrading from 2.1 to 2.2, be sure to get a new license key. You must do this on every major.minor change, such as going from 2.1 to 2.2 or 2.3. You do not need a new key for point (2.2.x) releases.

    Changes for 2.2.9

    • Fixed a regression from 2.2.8 with Table Panel when tables are empty (including tables in Node templates).

    Changes for 2.2.8

    • Improved Table Panel measuring when using TableRows and TableColumns in sparsely populated tables.
    • Improved Table Panel arranging of items that span several rows or columns, when those rows or columns do not all exist.
    • Animation fixes when AnimationTriggers execute during a drag.
    • Improved accuracy of tick angles along curves in Graduated panels.
    • Fix for two-way bindings on Part.location when undoing.
    • Calls to Diagram.makeImage and Diagram.makeImageData no longer throw exceptions when attempting to render "broken" images.
    Source code(tar.gz)
    Source code(zip)
  • v2.2.8(May 2, 2022)

    If you are upgrading from 2.1 to 2.2, be sure to get a new license key. You must do this on every major.minor change, such as going from 2.1 to 2.2 or 2.3. You do not need a new key for point (2.2.x) releases.

    Changes for 2.2.8

    • Improved Table Panel measuring when using TableRows and TableColumns in sparsely populated tables.
    • Improved Table Panel arranging of items that span several rows or columns, when those rows or columns do not all exist.
    • Animation fixes when AnimationTriggers execute during a drag.
    • Improved accuracy of tick angles along curves in Graduated panels.
    • Fix for two-way bindings on Part.location when undoing.
    • Calls to Diagram.makeImage and Diagram.makeImageData no longer throw exceptions when attempting to render "broken" images.
    Source code(tar.gz)
    Source code(zip)
  • v2.2.7(Apr 13, 2022)

    If you are upgrading from 2.1 to 2.2, be sure to get a new license key. You must do this on every major.minor change, such as going from 2.1 to 2.2 or 2.3. You do not need a new key for point (2.2.x) releases.

    Changes for 2.2.7

    • Nested or space-constrained Table Panels apportion space more correctly when some Table elements are stretched and other rows/columns have their width or height set.
    • Improved the ScrollingTable extension to include a scrollbar "thumb".
    Source code(tar.gz)
    Source code(zip)
  • v2.2.6(Mar 30, 2022)

    Changes for 2.2.6

    • Improvements in gesture handling for iPad + keyboard combinations.
    • Made improvements and added features to the Gantt and Donut Charts samples.
    • Drag and drop from a Diagram into empty page space no longer throws an error (regression in 2.2.4).
    • Data Inspector, when multipleSelection option is true, now clears the properties fields when the Diagram.selection is empty.
    Source code(tar.gz)
    Source code(zip)
  • v2.2.5(Feb 25, 2022)

    If you are upgrading from 2.1 to 2.2, be sure to get a new license key. You must do this on every major.minor change, such as going from 2.1 to 2.2 or 2.3. You do not need a new key for point (2.2.x) releases.

    Changes for 2.2.5

    • Drag and drop across Diagrams fixed on touch devices (regression in 2.2.4 for non Shadow DOM environments).
    • Module versions of the library release/go.mjs and release/go-module.js now export go as the default export.
    Source code(tar.gz)
    Source code(zip)
  • v2.2.4(Feb 21, 2022)

    If you are upgrading from 2.1 to 2.2, be sure to get a new license key. You must do this on every major.minor change, such as going from 2.1 to 2.2 or 2.3. You do not need a new key for point (2.2.x) releases.

    Changes for 2.2.4

    • Allow AnimationTriggers to run during Tool operation. Previously, Animation Triggers would not run if a Tool was active, which prevented some tools such as LinkingTool from starting animations during their events.
    • Fixed a regression since 2.2.0: Drag and drop in Shadow DOM environments such as Angular now correctly identify the target Diagram (for dropping from Palettes, for instance).
    • Diagram.useDOM and Diagram.isUsingDOM were incorrectly minified, and now have their names properly exposed.
    Source code(tar.gz)
    Source code(zip)
  • v2.2.3(Feb 17, 2022)

    Changes for 2.2.3

    • Fixed Spot Panels erroneously giving incorrect sizing information to its elements if a previous element had a stretch.
    • Improved LayeredDigraphLayout routing of Bezier curve links to reduce crossing over nodes.
    • Fixed optimization (in 2.0.0) of Panel.rebuildItemElements when item template(s) may have changed.
    • The package.json now specifies "module": "release/go-module.js"
    Source code(tar.gz)
    Source code(zip)
  • v2.2.2(Feb 7, 2022)

    If you are upgrading from 2.1 to 2.2, be sure to get a new license key. You must do this on every major.minor change, such as going from 2.1 to 2.2 or 2.3. You do not need a new key for point (2.2.x) releases.

    Changes for 2.2.2

    • Added init optional argument to Brushconstructor.
    • Stopped tap-hold on some versions of iOS Safari from selecting text.
    • Improvements for licensing Electron apps.

    Changes for 2.2 are here

    Source code(tar.gz)
    Source code(zip)
  • v2.2.1(Jan 28, 2022)

    If you are upgrading from 2.1 to 2.2, be sure to get a new license key. You must do this on every major.minor change, such as going from 2.1 to 2.2 or 2.3. You do not need a new key for point (2.2.x) releases.

    Changes for 2.2.1

    See the full 2.2 changelog here.

    Source code(tar.gz)
    Source code(zip)
  • v2.2.0(Jan 20, 2022)

    GoJS 2.2

    GoJS 2.2 introduces a number of properties and methods for convenience and to improve customization. GoJS 2.2 also includes new methods for constructing objects, and enhances TypeScript typings support.

    GoJS 2.2 also includes several performance enhancements when drawing large graphs, reduced memory usage, and more efficient replacing or merging of item Arrays.

    Some of the samples and written documentation have been upgraded to use more modern JavaScript: classes, arrow functions, const and let, so the samples and documentation might no longer be viewable using old browsers such as Internet Explorer 11 or some old Android browsers. The library and the extensions continue to target ES5 (ES2012), so that apps using the library can still work on IE11.

    Method Chaining and New Ways to Build Objects

    In GoJS 2.2 many methods that previously returned void now return the method's instance, to promote method chaining. GoJS 2.2 also introduces several new methods or arguments to allow type-checking of settings by compilers and in text editors.

    Several existing methods now return their instance:

    GraphObject constructors now accept one or two optional arguments. The first is the value for a common property, and the second is a JavaScript Object detailing properties to initialize. For example, one can now write:

    • new go.TextBlock("Some Text", { margin: 5 })
    • new go.Picture("sourceURI.png", { width: 30, height: 30 })
    • new go.Shape("RoundedRectangle", { fill: "blue", stroke: "yellow" })
    • new go.Panel("Auto", { padding: 10, background: "green" })

    This means that one can now write code like:

    // Create a Node and add a Shape and a TextBlock to it:
    myDiagram.nodeTemplate =
      new go.Node("Vertical")
        .add(new go.Shape({ width: 40, height: 40, fill: "white" })  // default width & height & fill
              .bind("width") // binds data.width to Shape.width
              .bind("height")
              .bind("fill", "color") // binds data.color to Shape.fill
              .bind("figure", "fig")) // data.fig should be the registered name of a geometry figure generator
        .add(new go.TextBlock("(no name)",  // default string to display
                              { isMultiline: false, editable: true })
              .bind("text", "name", null, null));  // TwoWay Binding of TextBlock.text with data.name without converters
    

    New methods GraphObject.set and Diagram.set return their instance. When using TypeScript definitions, the compiler checks these calls for GraphObject and Diagram property existence and value types.

    New method GraphObject.apply can be used to define common functions that provide settings and bindings. Such customizations can then be applied to a GraphObject that you are initializing by calling GraphObject.apply with that function.

    Together, these changes remove the need to use GraphObject.make when concisely defining Diagrams and templates. For a complete example, this code:

    const $ = go.GraphObject.make;
    
    const myDiagram = $(go.Diagram, "myDiagramDiv",
      {
        "undoManager.isEnabled": true
      });
    
    myDiagram.nodeTemplate =
      $(go.Node, "Auto",
        $(go.Shape, "RoundedRectangle",
          { strokeWidth: 0, fill: "white" },
          new go.Binding("fill", "color")),
        $(go.TextBlock,
          { margin: 8, font: "bold 14px sans-serif", stroke: '#333' },
          new go.Binding("text", "key"))
      );
    

    Can now be written as:

    const myDiagram = new go.Diagram("myDiagramDiv",
      {
        "undoManager.isEnabled": true
      });
    
    myDiagram.nodeTemplate =
      new go.Node("Auto")
        .add(new go.Shape("RoundedRectangle", { strokeWidth: 0, fill: "white" })
              .bind("fill", "color"))
        .add(new go.TextBlock({ margin: 8, font: "bold 14px sans-serif", stroke: '#333' })
              .bind("text", "key"));
    

    For more information and examples, see the intro page on Building Objects.

    General New Features in GoJS 2.2

    Easier Manipulation and Customization of Geometries

    GoJS 2.2 contains new methods to simplify geometric calculations and more easily customize geometries.

    • Point.intersectingLineSegments is a static function that returns true if two finite straight line segments intersect each other.
    • Rect.intersectsLineSegment is a static function that returns true if a rectangular area is intersected by a finite straight line segment.
    • Point.compareWithLineSegment is a static function that compares a point with a finite straight line segment, given x,y numbers. Point.compareWithLineSegmentPoint is a method that performs the same comparison, but on Points.
    • Geometry.containsPoint is a method that returns true if the Geometry contains a given point.
    • The Link.routeBounds read-only property returns the bounds of the Link geometry in document coordinates. Used in the BalloonLink sample.
    • The Node.getAvoidableRect method returns the area to be avoided for this node, equal to the node's GraphObject.actualBounds plus the Node.avoidableMargin. This method can be overridden to customize AvoidsNodes routing behavior near a node to account for the visual area occupied by the node being smaller than the full rectangular bounds of the node.
    • Groups now implement Panel.isClipping. If set to true on a Group and if the group has a Group.placeholder, the group will visually clip its member nodes and links. This does not change how those parts are measured, nor does it affect how those parts may be positioned.
    • The Layer.isInDocumentBounds property allows finer control of which layers are part of the Diagram.documentBounds. Before 2.2, only layers with Layer.isTemporary set to true were excluded from the document bounds (and could not be explicitly included).
    • The ResizingTool.oppositePoint property returns the Point opposite to the chosen, dragged handle of the "Resizing" Adornment. This allows customizations like the LimitedGroupResizingTool sample, which demonstrates a custom tool to allow resizing groups while disallowing the group to resize smaller than its members, and also disallowing the group to expand to cover any non-member nodes.
    • The RoundedRectangles extension code now includes definitions for the "RoundedLeftRectangle" and "RoundedRightRectangle" figures. The definitions for all four "Rounded...Rectangle" figures has been modified slightly to better match the curves of a full "RoundedRectangle".
    Source code(tar.gz)
    Source code(zip)
  • v2.1.56(Jan 15, 2022)

    Changes for 2.1.56

    • Updated the root object for systems that define window but do not attach all global variables to it. GoJS now prefers globalThis if it exists, then global.
    Source code(tar.gz)
    Source code(zip)
  • v2.1.55(Dec 8, 2021)

  • v2.1.54(Nov 23, 2021)

    Changes for 2.1.54

    • Fixed Diagram.viewSize when setting it to a real value and then later setting it back to a NaN value.
    • As with 2.1.52, fixed more scenarios with custom animations improperly adding state to the AnimationManager.defaultAnimation.
    • Fixed rare cases of LayeredDigraphLayout trying to get the "centerX" property of a null vertex.
    Source code(tar.gz)
    Source code(zip)
  • v2.1.53(Nov 5, 2021)

    • Fixed Binding.ofModel binding when there is no Diagram and thus no Model to just ignore the binding.
    • Fixed a regression in Diagram.makeSVG from 2.1.49 when using a Panel.Spot with Panel.isClipping set to true, where some elements would get grouped and positioned incorrectly.
    • Fixed Model.toJSON output when object keys contained unescaped double-quote characters.
    • Fixed some Shape Geometry intersections (such as with Link connections) when the Shape's Geometry contained small and flat beziers.
    • Fixed collapsed Parts incorrectly causing their Groups to remeasure, which may have caused Group's connected Links to re-route.
    Source code(tar.gz)
    Source code(zip)
  • v2.1.52(Oct 13, 2021)

    Changes for 2.1.52

    • Fixed animations incorrectly resetting some link routes.
    • Fixed custom animations improperly adding state to the AnimationManager.defaultAnimation.
    • Fixed a regression in 2.1.51 where un-modeled parts containing Images, that are added before a model is set, may fail to load.
    • Fixed a regression from 2.1.50 when Picture.errorFunction was used to modify the Picture.source or Picture.element, which would cause a "Collection was modified during iteration" error.
    Source code(tar.gz)
    Source code(zip)
  • v2.1.40(May 18, 2021)

    • Fixed some styling and missing files in the web site as a result of the reorganization in 2.1.39.
    • Simplified the Storage and FloorplannerTS projects.
    Source code(tar.gz)
    Source code(zip)
  • v2.1.51(Oct 4, 2021)

    • The TextEditingTool, when the user has entered an invalid text string, has always called any TextBlock.errorFunction and then continued showing the text editor so that the user could fix their text entry. The TextEditingTool.doError method now calls any TextBlock.errorFunction and also calls HTMLInfo.show on the TextEditingTool.currentTextEditor. This will allow an override of TextEditingTool.doError not to continue showing the editor. If you have not overridden that method, which was new in 2.1, this change will not affect you.
    • Fixed Model.fromJson not to substitute instances of classes such as Point and Size when the Object's "class" property had a value that is "Point" or "Size". The property value must be what is produced by Model.toJson, which uses values such as "go.Point" or "go.Size". The documentation lists all of the substitution cases that Model.fromJson handles.
    • Fixed a regression from 2.1.43 which caused some links to animate routes incorrectly upon dragging.
    • Fixed loading Images used as a Picture.element.
    • Improved some AvoidsNodes routing of Links when connecting Nodes in different Groups and the Groups are not Group.avoidable.
    • Fixed using multiple license keys.
    Source code(tar.gz)
    Source code(zip)
  • v2.1.50(Sep 17, 2021)

    Changes for 2.1.50

    • Enhanced the LinkShiftingTool extension to support links that are only connected at one end.
    • Fixed CommandHandler.doKeyDown to support Robot.keyDown use of "F2" and "ContextMenu" keys.
    • Improved routing of AvoidsNodes links that have a "to" end segment with a direction that is a multiple of 45 (but not 90) degrees.
    • Fixed diagram not redrawing after images load in frameworks that use a shadow DOM, such as Angular.
    • If you call TextBlock.setBaseline or TextBlock.setUnderline outside of your diagram initialization, you should also call Diagram.redraw on all Diagrams.
    Source code(tar.gz)
    Source code(zip)
Owner
Northwoods Software Corporation
World-class diagramming libraries to drive your data in the Web and beyond
Northwoods Software Corporation
a super simple, no-nonsense diagramming library written in react that just works

Introduction DEMO: http://projectstorm.cloud/react-diagrams DOCS (wip) https://projectstorm.gitbook.io/react-diagrams Docs are currently being worked

Storm 7.4k Jan 4, 2023
Lightweight, interactive planning tool that visualizes a series of tasks using an HTML canvas

Planner Lightweight, interactive planning tool that visualizes a series of tasks using an HTML canvas. Try it yourself at plannerjs.dev Plans created

Brian Vaughn 512 Jan 2, 2023
Smoothie Charts: smooooooth JavaScript charts for realtime streaming data

Smoothie Charts is a really small charting library designed for live streaming data. I built it to reduce the headaches I was getting from watching ch

Joe Walnes 2.2k Dec 13, 2022
📊 Interactive JavaScript Charts built on SVG

A modern JavaScript charting library to build interactive charts and visualizations with simple API. Our Partner ApexCharts is now a partner of Fusion

ApexCharts 12.1k Jan 3, 2023
Beautiful and interactive javascript charts for Java-based web applications.

Wicked Charts Beautiful and interactive JavaScript charts for Java-based web applications. Check out the Changelog Check out the Feature Overview with

adesso SE 85 Aug 23, 2022
📊 A highly interactive data-driven visualization grammar for statistical charts.

English | 简体中文 G2 A highly interactive data-driven visualization grammar for statistical charts. Website • Tutorial Docs • Blog • G2Plot G2 is a visua

AntV team 11.5k Dec 30, 2022
A repostory of samples, which demonstrates, how to use the 'Power Tools' extension for Visual Studio Code.

vscode-powertools-samples A repository of samples, which demonstrates, how to use the Power Tools extension for Visual Studio Code. Apps data-url-conv

e.GO Mobile 7 Feb 3, 2022
A plugin for the jQuery javascript library to generate small sparkline charts directly in the browser

jQuery Sparklines This jQuery plugin makes it easy to generate a number of different types of sparklines directly in the browser, using online a line

Gareth Watts 1.2k Jan 4, 2023
Ember Charts 3.5 2.3 L2 JavaScript A powerful and easy to use charting library for Ember.js

Ember Charts A charting library built with the Ember.js and d3.js frameworks. It includes time series, bar, pie, and scatter charts which are easy to

Addepar 793 Dec 7, 2022
Reusable JavaScript library for creating sketchy/hand-drawn styled charts in the browser.

roughViz.js is a reusable JavaScript library for creating sketchy/hand-drawn styled charts in the browser, based on D3v5, roughjs, and handy. Why? Use

Jared Wilber 6.4k Jan 4, 2023
A curated list of tools that can be used for creating interactive mathematical explorables.

A curated list of tools that can be used for creating interactive mathematical explorables.

Nikola Ubavić 75 Dec 22, 2022
Simple package to facilitate and automate the use of charts in Laravel 5.x using Chartjs v2 library

laravel-chartjs - Chart.js v2 wrapper for Laravel 5.x Simple package to facilitate and automate the use of charts in Laravel 5.x using the Chart.js v2

Felix Costa 473 Dec 15, 2022
J2CL and GWT Charts library based on CHART.JS

Charba - J2CL and GWT Charts library based on CHART.JS What's Charba GWT Web toolkit doesn't have charting library available out of the box. There are

Pepstock.org 56 Dec 17, 2022
Synchro Charts is a front-end component library that provides a collection of components to visualize time-series data.

Synchro Charts Synchro Charts is a front-end component library that provides a collection of components to visualize time-series data. You can learn m

Amazon Web Services - Labs 60 Dec 29, 2022
An open-source visualization library specialized for authoring charts that facilitate data storytelling with a high-level action-driven grammar.

Narrative Chart Introduction Narrative Chart is an open-source visualization library specialized for authoring charts that facilitate data storytellin

Narrative Chart 45 Nov 2, 2022
Attractive JavaScript charts for jQuery

flot About flot is a JavaScript plotting library for engineering and scientific applications derived from Flot: http://www.flotcharts.org/ Take a look

Flot 5.9k Dec 22, 2022
Create beautiful charts with one line of JavaScript

Chartkick.js Create beautiful charts with one line of JavaScript See it in action Supports Chart.js, Google Charts, and Highcharts Also available for

Andrew Kane 1.2k Jan 2, 2023
Create beautiful JavaScript charts with one line of React

React Chartkick Create beautiful JavaScript charts with one line of React See it in action Supports Chart.js, Google Charts, and Highcharts Quick Star

Andrew Kane 1.2k Dec 28, 2022
Create beautiful JavaScript charts with one line of Ruby

Chartkick Create beautiful JavaScript charts with one line of Ruby. No more fighting with charting libraries! See it in action Chartkick 4.0 was recen

Andrew Kane 6.1k Jan 8, 2023