obsidian-functionplot
A plugin for displaying mathematical graphs in obsidian.md.
Remember to star this plugin on Github if you like it.
How to use
- Type: (without the backslash)
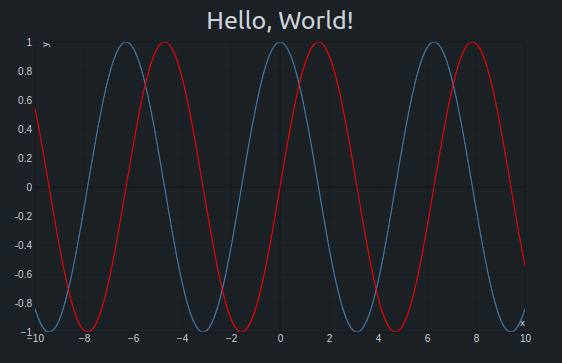
```functionplot
---
title: Graph
disableZoom: false
bounds: [-10, 10, -10, 10]
grid: true
xLabel: x
yLabel: y
---

f(x) = x^2
g(x) = 0.5*x^3+x^2-44
```
(The metadata header in this example contains all possible options, you don't usually have to specify all of them)
- This will create a coordinate system with bounds
-10 < x < 10, -10 < y < 10and plot the functions f and g. If you havent disabled it, you can even drag and zoom the graph.


Options
This section describes all the header options in yaml format.
title: string, default: ""
The title of the graph.
disableZoom: boolean, default: false
If true, the user can't zoom the graph.
bounds: array, default: [-10, 10, -10, 10]
The initial bounds of the graph. If disableZoom is true, this is permanent.
grid: boolean, default: true
If true, a grid is drawn.
xLabel: string, default: ""
The label of the x-axis.
yLabel: string, default: ""
The label of the y-axis.
Attribution
This plugin is based on / uses:
- function-plot: MIT License, Copyright (c) 2015 Mauricio Poppe
- yaml: ISC License, Copyright Eemeli Aro [email protected]


![[Bug]: Exponential Graph not displaying line](https://avatars.githubusercontent.com/u/67995456?v=4)


![[Bug]: Plot not showing](https://avatars.githubusercontent.com/u/7620977?v=4)


 3 May 18, 2022
 4 May 3, 2022
 8 May 29, 2022
 14 Jan 3, 2023
 6 Dec 26, 2022
 108 Jan 4, 2023
 37 Dec 27, 2022
 102 Dec 28, 2022
 4 Feb 24, 2022
 24 Dec 27, 2022
 20.6k Jan 4, 2023
 74 Jan 5, 2023
 26 Dec 8, 2022
 17 Dec 21, 2022
 1 May 9, 2021
 12 Oct 20, 2022
 17 Sep 24, 2022