Makes waterfall charts easy with chartjs-2

Overview

Installation

npm install --save chartjs-plugin-waterfall

Here's what it looks like:
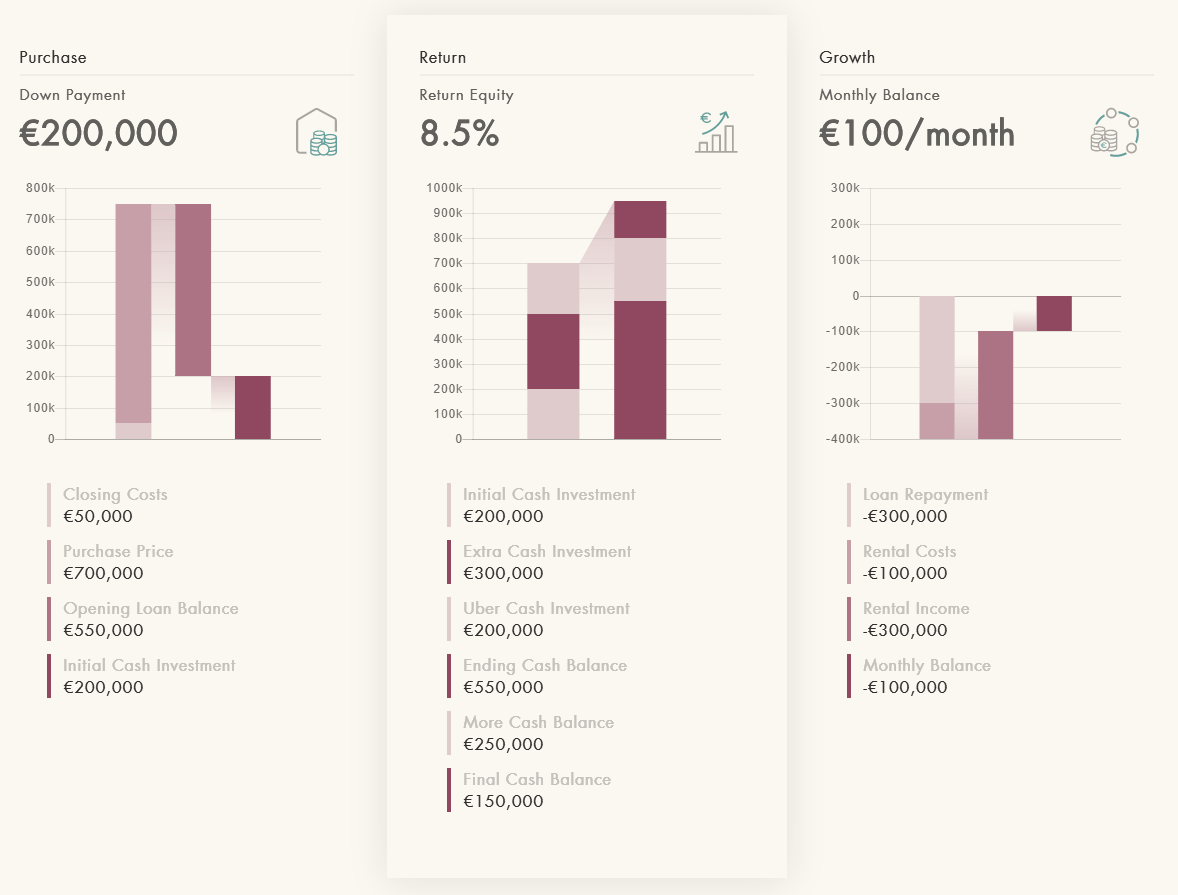
 WaterFall Chart Example

Usage

Just import the plugin and add it to any chart that you want to be a waterfall chart like so:

import waterFallPlugin from 'chartjs-plugin-waterfall';

var chart = new Chart(ctx, {
    plugins: [waterFallPlugin]
});

Example gist by @EdwinChua: https://gist.github.com/EdwinChua/0a5d66dc561fe7d3866021b18a320585

See the plugins documentation for more info.

How it works

This plugin works by checking if any of your datasets contain a property called dummyStack that is set to true. The stack property must be used in conjunction with dummyStack for this plugin to work properly. If dummyStack is true then it hides the label, tooltip and sets the color invisible. When you use stacking with this it creates the affect of a floating bar as shown in the image above that we can use for waterfall charts as chartjs-2 doesn't support waterfall charts by default.

E.g:

const data = {
  datasets: [
    {
      label: 'Closing Costs',
      data: [50],
      backgroundColor: '#e8cdd7',
      stack: 'stack 1',
    },
    {
      label: 'Purchase Price',
      data: [700],
      backgroundColor: '#d29baf',
      stack: 'stack 1',
    },
    {
      data: [200],
      waterfall: {
        dummyStack: true,
      },
      stack: 'stack 2',
    },
    {
      label: 'Opening Loan Balance',
      data: [550],
      backgroundColor: '#bb6987',
      stack: 'stack 2',
    },
    {
      label: 'Initial Cash Investment',
      data: [200],
      backgroundColor: '#a53860',
      stack: 'stack 3',
    },
  ],
};

This dataset will give us the look in the image above.

Options

The plugin options can be changed at 3 different levels:

globally: Chart.defaults.global.plugins.waterfall.*

per chart: options.plugins.waterfall.*

per dataset: dataset.waterfall.* (not all options)

The default chart options are:

options: {
  plugins: {
    waterFallPlugin: {
      stepLines: {
        enabled: true,
        startColorStop: 0,
        endColorStop: 0.6,
        startColor: 'rgba(0, 0, 0, 0.55)',
        endColor: 'rgba(0, 0, 0, 0)',
        diagonalStepLines: true,
      },
    },
  },
}

Dataset options: dummyStack: (boolean) If true then hides the tooltip, legend and sets the color to transparent.

Global/Chart options:

stepLines.enabled: (boolean) If true then it shows the step-lines going from one bar to another.

Global/Chart/Dataset options:

stepLines.startColorStop: (number) Used as the offset value in the first addColorStop method call.

stepLines.startColor: (string) Used as the color value in the first addColorStop method call.

stepLines.endColorStop: (number) Used as the offset value in the second addColorStop method call.

stepLines.endColor: (string) Used as the color value in the second addColorStop method call.

For lines going from bar to bar that you need maximum customization over, see chartjs-plugin-custom-lines.

Caveats

  • Multiple values in data currently are not supported by this plugin.
  • The invisible dummy stacks are removed from the tooltip and legend by default using the filter method. If you are providing your own filter method, using a custom tooltip or legend of your own then you will have to manually hide them because it will overwrite this plugins.

E.g. This is how this plugin hides them, so you could do it this way:

  filter: function(legendItem, chartData) {
    var currentDataset = chartData.datasets[legendItem.datasetIndex];

    return !currentDataset.dummyStack;
  }
You might also like...

Attractive JavaScript charts for jQuery

flot About flot is a JavaScript plotting library for engineering and scientific applications derived from Flot: http://www.flotcharts.org/ Take a look

Dec 22, 2022

Progressive svg pie, donut, bar and line charts

Peity Peity (sounds like deity) is a jQuery plugin that converts an element's content into a mini svg pie, donut, line or bar chart. Basic Usage HTM

Jan 1, 2023

Charts for Raphaël

g.Raphaël - Official charting plugin for Raphaël For more information, see: http://g.raphaeljs.com/ Changelog v0.51 Fixed issues with piechart related

Dec 31, 2022

A plugin for the jQuery javascript library to generate small sparkline charts directly in the browser

jQuery Sparklines This jQuery plugin makes it easy to generate a number of different types of sparklines directly in the browser, using online a line

Jan 4, 2023

Awesome charts for AngularJS.

Awesome charts for AngularJS.

n3-line-chart v2 n3-line-chart is an easy-to-use JavaScript library for creating beautiful charts in AngularJS applications and it is built on top of

Dec 7, 2022

Create beautiful charts with one line of JavaScript

Chartkick.js Create beautiful charts with one line of JavaScript See it in action Supports Chart.js, Google Charts, and Highcharts Also available for

Jan 2, 2023

A friendly reusable charts DSL for D3

D4 D4 is a friendly charting DSL for D3. The goal of D4 is to allow developers to quickly build data-driven charts with little knowledge of the intern

Dec 5, 2022

Reusable JavaScript library for creating sketchy/hand-drawn styled charts in the browser.

Reusable JavaScript library for creating sketchy/hand-drawn styled charts in the browser.

roughViz.js is a reusable JavaScript library for creating sketchy/hand-drawn styled charts in the browser, based on D3v5, roughjs, and handy. Why? Use

Jan 4, 2023

Financial lightweight charts built with HTML5 canvas

Lightweight Charts Demos | Documentation | Discord community TradingView Lightweight Charts are one of the smallest and fastest financial HTML5 charts

Jan 9, 2023
Comments
  • information needed about equity calculator

    information needed about equity calculator

    i was going through your investment calculator (https://www.everestate.com/return-calculator-how-to) i could get hold of return on equity or couldn’t find any resources related to that is it possible for me know how it is calculated?

    opened by raghulkrishna 0
Owner
Ziegert Group
Ziegert Group
Using ASP.NET Core, SignalR, and ChartJs to create real-time updating charts

Real-time Charts with ASP.NET Core, SignalR, and Chart.js This project shows how to update a real-time chart in your web browser using technologies li

Khalid Abuhakmeh 11 Nov 25, 2022
Crosshair plugin for ChartJS

Chart.js plugin to draw vertical crosshair, zoom, interpolate values and sync chart interactions. Requires Chart.js 3.4.0 or later. Documentation Inst

Abel Heinsbroek 118 Dec 12, 2022
Smoothie Charts: smooooooth JavaScript charts for realtime streaming data

Smoothie Charts is a really small charting library designed for live streaming data. I built it to reduce the headaches I was getting from watching ch

Joe Walnes 2.2k Dec 13, 2022
Ember Charts 3.5 2.3 L2 JavaScript A powerful and easy to use charting library for Ember.js

Ember Charts A charting library built with the Ember.js and d3.js frameworks. It includes time series, bar, pie, and scatter charts which are easy to

Addepar 793 Dec 7, 2022
A web application to 🔍inspect your GitHub Profile Stats📊 in a lucid way. Visualization made easy with Charts💡🚀

know-your-gitstats A web application to ?? inspect your GitHub Profile Stats ?? in a lucid way. Visualization made easy with Charts ?? ?? . ✅ Features

Shubham Jadhav 46 Oct 15, 2022
Simple HTML5 Charts using the tag

Simple yet flexible JavaScript charting for designers & developers Documentation Currently, there are two versions of the library (2.9.4 and 3.x.x). V

Chart.js 59.4k Jan 7, 2023
Simple responsive charts

Big welcome by the Chartist Guy Checkout the documentation site at http://gionkunz.github.io/chartist-js/ Checkout this lightning talk that gives you

Gion Kunz 26 Dec 30, 2022
Simple, responsive, modern SVG Charts with zero dependencies

Frappe Charts GitHub-inspired modern, intuitive and responsive charts with zero dependencies Explore Demos » Edit at CodePen » Contents Installation U

Frappe 14.6k Jan 4, 2023
📊 A highly interactive data-driven visualization grammar for statistical charts.

English | 简体中文 G2 A highly interactive data-driven visualization grammar for statistical charts. Website • Tutorial Docs • Blog • G2Plot G2 is a visua

AntV team 11.5k Dec 30, 2022
JavaScript diagramming library for interactive flowcharts, org charts, design tools, planning tools, visual languages.

GoJS, a JavaScript Library for HTML Diagrams GoJS is a JavaScript and TypeScript library for creating and manipulating diagrams, charts, and graphs. S

Northwoods Software Corporation 6.6k Dec 30, 2022