3D graph viewer powered by WebGL (three.js)

Overview

Graphosaurus

Build Status npm version

A three-dimensional static graph viewer.

(click the image to try it out)

Demos

Documentation

JSDoc generated API documentation can be found here.

Twenty second tutorial

<html>
  <head>
    <style>
    #graph {
      width: 500px;
      height: 500px;
      border: 1px solid grey;
    }
    </style>
  </head>
  <body>
    <div id="graph"></div>

    <script src="graphosaurus.min.js"></script>
    <script>
      // JavaScript will go here
    </script>
  </body>
</html>

If you open this up in your web browser, you'll see something that looks like this:

Look at that amazing square! Now let's create a graph, a couple nodes, and an edge between the nodes:

var graph = G.graph()

// Create a red node with cartesian coordinates x=0, y=0, z=0
var redNode = G.node([0, 0, 0], {color: "red"});
graph.addNode(redNode);

// You can also use the addTo method to add to the graph
var greenNode = G.node([1, 1, 1], {color: "green"}).addTo(graph);

var edge = G.edge([redNode, greenNode], {color: "blue"});
graph.addEdge(edge);  // or edge.addTo(graph)

// Render the graph in the HTML element with id='graph'
graph.renderIn("graph");

After inserting this JavaScript in the <script> block, you should see this:

While this is a very basic example, I hope I've demonstrated how simple it is to create graphs with Graphosaurus.

Build

  1. Run git clone https://github.com/frewsxcv/graphosaurus.git to clone this repository
  2. Install node, npm, and grunt-cli
  3. Run npm install to install all the build requirements
  4. Run grunt to build Graphosaurus. The resulting compiled JavaScript will be in dist/ and the docs will be in doc/

Mascot

gryposaurus

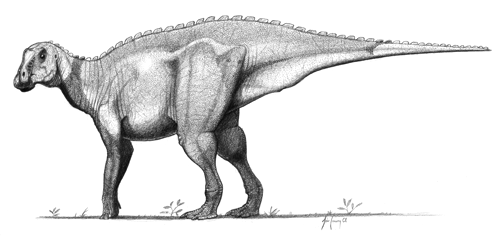
John Conway's illustration of our glorious leader, the gryposaurus graphosaurus.

Similar projects

Copyright

All files in this repository are licensed under version two of the Mozilla Public License.

Graphosaurus has some third party dependencies listed in the package.json file in the devDependencies and dependencies sections. Their licenses can be found on their respective project pages.

Comments
  • image paths on nodes

    image paths on nodes

    Code and dist build included. Graphosaurus only passes predefined attributes to it's node from data. This extends (overloads) the properties passed on to include an image path property for usage of images in relation to nodes e.g. displaying on hover or click

    opened by invisiblegaudi 3
  • change node position, adding edges dynamically

    change node position, adding edges dynamically

    Hi Corey, just a question. ¿Is it posible to add nodes, change position, or add an edge dynamically? i don't know if is not possible now or is an error.

    Maybe some graph method to redraw? Thanks! great project. Santiago

    opened by santiagovillegasg 3
  • Nodes/edges not fully deleted and leaking into memory?

    Nodes/edges not fully deleted and leaking into memory?

    Seems like the functions for purging nodes and edges (which, admittedly, I added) are missing deletion of some representation(s?) of themselves in the data, causing the memory to slowly but surely overflow on multiple addition/deletion operations.

    opened by mwozniczak 2
  • Can now add multiple nodes/edges at the same time

    Can now add multiple nodes/edges at the same time

    • Added render suppression so that the diagram's not redrawn for every single node added (only afterwards)
      • Added addNodes and addEdges functions, these basically suppress the rendering while forEach is running for their respective parameters, then call to syncDataToFrame
    opened by mwozniczak 2
  • Scale nodes with distance

    Scale nodes with distance

    which I think just involves specifying ParticleSystemMaterial({sizeAttenuation: true})

    For one thing, it might be nice to have the labels from #21 only appear when the node's displayed size is large enough.

    opened by coyotebush 2
  • Incorrect logic related to hover/click events

    Incorrect logic related to hover/click events

    I got an email from someone who is using the library. They're reporting the logic related to hovering/clicking on nodes is incorrect. Here's what they wrote:


    the node ids that are returned refer to the THREE.BufferGeometry node and not the Graph Node nodes. Hence the label will always be incorrect.

    I added a BufferAttribute to the BufferGeometry to map back to the Graph Node ids.

    Frame.prototype._syncNodeDataFromGraph = function () { var nodes = this.graph.nodes();

        var positions = new THREE.BufferAttribute(
            new Float32Array(nodes.length * 3), 3);
        var colors = new THREE.BufferAttribute(
            new Float32Array(nodes.length * 3), 3);
       //id array
       var ids = new THREE.BufferAttribute(
            new Float32Array(nodes.length), 1);
    
        for (var i = 0; i < nodes.length; i++) {
            var node = nodes[i];
            var pos = node._pos;
            var color = node._color;
    
            positions.setXYZ(i, this.scale * pos.x, this.scale *
        pos.y, this.scale * pos.z);
            colors.setXYZ(i, color.r, color.g, color.b);
    
            ids.setX(i, node._id);
        }
    
        this.points.addAttribute('position', positions);
        this.points.addAttribute('color', colors);
        this.points.addAttribute('id', ids);
    
        this.points.computeBoundingSphere();
    
        this._normalizePositions();
        this.positionCamera();
    };
    

    and

     Frame.prototype._initMouseEvents = function (elem) {
         ..
                var intersects =
           raycaster.intersectObject(self.pointCloud);
                if (intersects.length) {
                    var nodeIndex =
           intersects[0].object.geometry.attributes.id.getX(intersects[0].index);
                    callback(self.graph._nodes[nodeIndex]);
    
    opened by frewsxcv 0
  • Graphs getting rendered differently when using THREE.Line and THREE.LineSegments

    Graphs getting rendered differently when using THREE.Line and THREE.LineSegments

    Line in question

    What the 'Eve Universe' example looks like with THREE.LineSegments (what is being used now):

    screen shot 2016-04-14 at 9 01 27 am

    What the 'Eve Universe' example looks like with THREE.Line:

    screen shot 2016-04-14 at 9 01 40 am

    From what I can tell, THREE.LineSegments results in not all lines being drawn, but I'm not sure why.

    opened by frewsxcv 1
  • Stop successive edges from linking up

    Stop successive edges from linking up

    I'm trying this library out, and I have to admit that it is very useful.

    One issue that I'm having right now is that drawing two independent edges ends up with a third edge being drawn. Simple example:

    graph = G.graph({
        antialias: true,
        bgColor: "black",
        edgeWidth: 1,
        nodeSize: 10
    });
    G.node([0, 0, 0], {id: 0}).addTo(graph);
    G.node([0, 1, 0], {id: 1}).addTo(graph);
    G.node([1, 0, 0], {id: 2}).addTo(graph);
    G.node([1, 1, 0], {id: 3}).addTo(graph);
    
    G.edge([0, 1]).addTo(graph);
    G.edge([2, 3]).addTo(graph);
    
    graph.renderIn('frame');
    

    Expected result:

     O     O
     |     |
     |     |
     |     |
     |     |
     O     O
    

    Result with the current version of graphosaurus:

     O     O
     |\    |
     | \   |
     |  \  |
     |   \ |
     O     O
    

    This is problematic for me. If I'm doing something wrong here, I can't see what it is.

    I have tried looking around the code and finding where this happens, but I chose this library specifically to avoid the learning code of three.js - so I don't know where this error is creeping in.

    opened by JakeArkinstall 3
🦍• [Work in Progress] React Renderer to build UI interfaces using canvas/WebGL

React Ape React Ape is a react renderer to build UI interfaces using canvas/WebGL. React Ape was built to be an optional React-TV renderer. It's mainl

Raphael Amorim 1.5k Jan 4, 2023
A centralized location for my WebGL and other demos.

?? Experiments A centralized location for my WebGL and other demos. Launch Site My work is for and funded by the community. If you used this or found

Faraz Shaikh 34 Dec 26, 2022
A JavaScript library dedicated to graph drawing

sigma.js - v1.2.1 Sigma is a JavaScript library dedicated to graph drawing, mainly developed by @jacomyal and @Yomguithereal. Resources The website pr

Alexis Jacomy 10.3k Jan 3, 2023
a graph visualization library using web workers and jQuery

arbor.js -------- Arbor is a graph visualization library built with web workers and jQuery. Rather than trying to be an all-encompassing framework, a

Christian Swinehart 2.6k Dec 19, 2022
A React toolkit for graph visualization based on G6

Graphin A React toolkit for graph analysis based on G6 English | 简体中文 ✨ Features ?? Good-looking elements, standardized style configuration Graphin st

AntV team 823 Jan 7, 2023
Gephi - The Open Graph Viz Platform

Gephi - The Open Graph Viz Platform Gephi is an award-winning open-source platform for visualizing and manipulating large graphs. It runs on Windows,

Gephi 5.1k Jan 4, 2023
Simple tiny dependency graph engine, MobX inspired

?? Quarx Simple tiny dependency graph engine, MobX inspired Introduction In less than 200 lines of code and zero dependencies Quarx supports most of M

Dmitry Maevsky 22 Nov 2, 2022
A web app that shows visualizations of the most used graphs algorithms such as BFS, DFS, Dijsktra, Minimum spanning tree, etc. It allows you to draw your own graph.

Graph Visualizer Draw your own graphs and visualize the most common graph algorithms This web application allows you to draw a graph from zero, with p

Gonzalo Pereira 31 Jul 29, 2022
Free Bootstrap 5 Admin and Dashboard Template that comes with all essential dashboard components, elements, charts, graph and application pages. Download now for free and use with personal or commercial projects.

PlainAdmin - Free Bootstrap 5 Dashboard Template PlainAdmin is a free and open-source Bootstrap 5 admin and dashboard template that comes with - all e

PlainAdmin 238 Dec 31, 2022
Highly customizable, animated, responsive, and dependency-free Evolution Graph implementation

Highly customizable, animated, responsive, and dependency-free Evolution Graph implementation. The package is built with Vanilla JavaScript and is used to create flexible data visualizations and present evolution relationships between entities.

Nathan S. Santos 39 Jan 5, 2023
CyberGraph is a 3D-graph based, user based social connection explorer

CyberGraph is a 3D-graph based, user based social connection explorer. It has some cool features like 3d node graph, dynamic loading bar, immersive user experience, cyber mode(10-hops friendship network display) and focus mode(aggregated connection display).

CyberConnect 16 Nov 25, 2022
🌏 A Declarative 3D Globe Data Visualization Library built with Three.js

Gio.js English | 中文 React Version: react-giojs Wechat minigame: wechat usage Gio.js is an open source library for web 3D globe data visualization buil

syt123450 1.6k Dec 29, 2022
Three.js-based room configurator (floor planner + product configurator)

Three.js-based room configurator (floor planner + product configurator) Live Features 1. FloorPlan Design Users can edit floorplan in 2d view mode. Th

Pegasus 55 Dec 28, 2022
Composable data visualisation library for web with a data-first approach now powered by WebAssembly

What is Muze? Muze is a free data visualization library for creating exploratory data visualizations (like Tableau) in browser, using WebAssembly. It

Charts.com 1.2k Dec 29, 2022
The code base that powered India in Pixels' YouTube channel for more than 2 years - now open sourced for you to use on your own projects

India in Pixels Bar Chart Racing For over two years, this nifty code base powered India in Pixels' YouTube channel with videos fetching over millions

India in Pixels 141 Dec 4, 2022
A r/place clone powered by websockets

canvas A r/place clone powered by websockets That's pretty much it. https://canvas.rto.run To build, run npm install and then node main.js to start th

Chunkybanana 9 Oct 19, 2022
This is an IFC wrapped on Three js based viewer, I think..

ifc-three-js-viewer Project description: This is an IFC wrapped on Three js based viewer, I think.. Features & Screenshots: A simple viewer for render

Oussama Bonnor 4 Dec 14, 2022
Real-time motion planner and autonomous vehicle simulator in the browser, built with WebGL and Three.js.

Dash Self-Driving Car Simulator Real-time motion planner and autonomous vehicle simulator in the browser, built with WebGL and Three.js. This project

Matt Bradley 209 Dec 3, 2022
✂ Multiple scenes, one canvas! WebGL Scissoring implementation for React Three Fiber.

react-three-scissor Multiple scenes, one canvas! WebGL Scissoring implementation for React Three Fiber. scissor lets you render an infinite number of

Poimandres 79 Dec 28, 2022