A very fast geospatial point clustering library for browsers and Node.

Overview

supercluster Simply Awesome Build Status

A very fast JavaScript library for geospatial point clustering for browsers and Node.

<script src="https://unpkg.com/[email protected]/dist/supercluster.min.js"></script>
const index = new Supercluster({
    radius: 40,
    maxZoom: 16
});
index.load(points);
index.getClusters([-180, -85, 180, 85], 2);

Clustering 6 million points in Leaflet:

clusters2

Install

Install using NPM (npm install supercluster) or Yarn (yarn add supercluster), then:

// import as a ES module
import Supercluster from 'supercluster';

// or require in Node / Browserify
const Supercluster = require('supercluster');

Or use a browser build directly:

<script src="https://unpkg.com/[email protected]/dist/supercluster.min.js"></script>

Methods

load(points)

Loads an array of GeoJSON Feature objects. Each feature's geometry must be a GeoJSON Point. Once loaded, index is immutable.

getClusters(bbox, zoom)

For the given bbox array ([westLng, southLat, eastLng, northLat]) and integer zoom, returns an array of clusters and points as GeoJSON Feature objects.

getTile(z, x, y)

For a given zoom and x/y coordinates, returns a geojson-vt-compatible JSON tile object with cluster/point features.

getChildren(clusterId)

Returns the children of a cluster (on the next zoom level) given its id (cluster_id value from feature properties).

getLeaves(clusterId, limit = 10, offset = 0)

Returns all the points of a cluster (given its cluster_id), with pagination support: limit is the number of points to return (set to Infinity for all points), and offset is the amount of points to skip (for pagination).

getClusterExpansionZoom(clusterId)

Returns the zoom on which the cluster expands into several children (useful for "click to zoom" feature) given the cluster's cluster_id.

Options

Option Default Description
minZoom 0 Minimum zoom level at which clusters are generated.
maxZoom 16 Maximum zoom level at which clusters are generated.
minPoints 2 Minimum number of points to form a cluster.
radius 40 Cluster radius, in pixels.
extent 512 (Tiles) Tile extent. Radius is calculated relative to this value.
nodeSize 64 Size of the KD-tree leaf node. Affects performance.
log false Whether timing info should be logged.
generateId false Whether to generate ids for input features in vector tiles.

Property map/reduce options

In addition to the options above, supercluster supports property aggregation with the following two options:

  • map: a function that returns cluster properties corresponding to a single point.
  • reduce: a reduce function that merges properties of two clusters into one.

Example of setting up a sum cluster property that accumulates the sum of myValue property values:

const index = new Supercluster({
    map: (props) => ({sum: props.myValue}),
    reduce: (accumulated, props) => { accumulated.sum += props.sum; }
});

Note that reduce must not mutate the second argument (props).

Developing Supercluster

npm install       # install dependencies
npm run build     # generate dist/supercluster.js and dist/supercluster.min.js
npm test          # run tests
Comments
  • Support for custom metrics on each cluster

    Support for custom metrics on each cluster

    Currently, the only metric we have for each cluster is the number of points in each cluster.

    I ran into this "limitation" when wanting to display a number on each cluster which was an aggregation of a custom property on each of my points. For example, each point may have a population property, and I want each cluster to show the total population.

    This PR allows points passed in to have an additional property specified by metricKey and a custom reducer function specified by metricReducer.

    Now, one can compute metrics on clusters that are based on other dimensions (like population) and compute things like averages, min, max, etc.

    opened by georgeke 14
  • How to run supercluster as server side clustering

    How to run supercluster as server side clustering

    I am creating server side clustering for my map. When I use PHP and Mysql for create the clustering it is taking more time. So I am planning to use this project I have few doubts

    How to run this project as server? If I pass My lat and lang points into this project this will convert everything to cluster? How to expose API for markers to cluster?

    Please help me. I am waiting for your response

    opened by jpnathannew 12
  • Implement map/reduce for custom cluster properties

    Implement map/reduce for custom cluster properties

    I thought a lot about API design for cluster property aggregations because once we commit to a particular API, it will be difficult to change, and doing support/maintenance for such a complex feature may be a big burden.

    In this PR, I'm proposing an alternative implementation to #12 and @redbmk's fork, inspired by the map-reduce concept. It should hopefully eliminate all the API ambiguity and make writing custom aggregations easier.

    • the initial function returns the initial properties of a cluster (before accumulation)
    • the map function specifies how to interpret individual points (as opposed to clusters) when accumulating properties
    • the reduce function does the accumulation and is similar to Array reduce.

    Here's an example of aggregating point counts per category, an equivalent to this big 50-line example by @lamuertepeluda:

    initial: function () {
        return {categories: {}};
    },
    map: function (properties) {
        var categories = {};
        categories[properties.featureclass || 'uncategorized'] = 1;
        return {categories: categories};
    },
    reduce: function (accumulated, properties) {
        for (var id in properties.categories) {
            accumulated.categories[id] = (accumulated.categories[id] || 0) + properties.categories[id];
        }
    }
    

    And here's a slightly bigger example for the sum, min, max, avg (equivalent to this example by @redbmk in the cluster-agg-hash-array branch)):

    initial: function () {
        return {
            count: 0,
            sum: 0,
            min: Infinity,
            max: -Infinity
        };
    },
    map: function (properties) {
        return {
            count: 1,
            sum: properties.myValue,
            min: properties.myValue,
            max: properties.myValue
        };
    },
    reduce: function (accumulated, properties) {
        accumulated.sum += properties.sum;
        accumulated.count += properties.count;
        accumulated.min = Math.min(accumulated.min, properties.min);
        accumulated.max = Math.max(accumulated.max, properties.max);
        accumulated.avg = Math.round(100 * accumulated.sum / accumulated.count) / 100;
    }
    

    Note that the example above does not rely on internal properties like numPoints and if you need a count for the average calculation, you just calculate it manually.

    If we add fallbacks for the map option (return point properties directly) and the initial option (return {}), we can also support code similar to @redbmk's examples (with just the reduce function), although clear separation of the three concepts makes it much easier to follow what's going on in my opinion.

    The performance overhead is acceptable — ~18% both time and memory overhead (compared to current master) when providing a reducer, and otherwise zero time overhead and ~10% memory overhead. We might be able to reduce it further too.

    I'm keeping the discussion about the Mapbox GL style spec / JS API separate since it shouldn't rely on a specific Supercluster implementation.

    @redbmk @lamuertepeluda @johnlaur @cyrilchapon @aparshin @ben657 @georgeke @vibze @ryanbaumann @davecranwell @lucaswoj what do you think?

    enhancement 
    opened by mourner 12
  • Reduce not called for each point in cluster

    Reduce not called for each point in cluster

    Hi, this is more a question that a bug report. I've noticed that in my application supercluster calls the reduce function is not called for each of the points in the final cluster, but at least one point is skipped. Am I missing something or it shouldn't behave like that?

    opened by giovanni-bertoncelli 11
  • supercluster not defined in IE - Error

    supercluster not defined in IE - Error

    Hi, we are using the supercluster library and in IE it is throwing the error supercluster not defined. In chrome it is working fine.

    we are using the example from here. It is in ES 6 but we did convert to ES 5

    https://bl.ocks.org/ryanbaumann/01b2c7fc0ddb7b27f6a72217bd1461ad

    this is the code we are using. (even without array.from, it is giving the error)

    
    function performSuperClustering(propertyToAggregate, clusterRadius, clusterMaxZoom, secondaryPropertyToAggregate, mapName) {
                return supercluster({
                    radius: clusterRadius,
                    maxZoom: clusterMaxZoom,
                    initial: function initial() {
                        return {
                            count: 0,
                            sum: 0,
                            min: Infinity,
                            max: -Infinity,
                            unique: 0,
                            uniqueSecondary: 0,
                            consolidatedArray: [],
                            distinctArraySecondary: []
                        };
                    },
                    map: function map(properties) {
                        return {
                            count: 1,
                            sum: Number(properties[propertyToAggregate]),
                            min: Number(properties[propertyToAggregate]),
                            max: Number(properties[propertyToAggregate]),
                            unique: 1,
                            uniqueSecondary: 1,
                            consolidatedArray: Number(properties[propertyToAggregate]),
                            distinctArraySecondary: app.getContentForDistinctSecondary(mapName, secondaryPropertyToAggregate, properties),//properties[secondaryPropertyToAggregate] + "}{" + properties["alertLocation"] + "}{" + properties["alertTitle"], //SUJAN
                            placeholder: Number(properties[propertyToAggregate])
                        };
                    },
                    reduce: function reduce(accumulated, properties) {
                        accumulated.sum += Math.round(properties.sum * 100) / 100;
                        accumulated.count += properties.count;
                        accumulated.min = Math.round(Math.min(accumulated.min, properties.min) * 100) / 100;
                        accumulated.max = Math.round(Math.max(accumulated.max, properties.max) * 100) / 100;
                        accumulated.avg = Math.round(100 * accumulated.sum / accumulated.count) / 100;
    
                        if (accumulated.consolidatedArray.indexOf(properties.consolidatedArray) == -1 && properties.placeholder != null) {
                            accumulated.unique += properties.unique;
                            //alert(acculumated.unique + " AND standalone unique: " + properties.unique);
                            accumulated.consolidatedArray.push(properties.consolidatedArray);
                            accumulated.distinctArraySecondary.push(properties.distinctArraySecondary);
                        } else {
                            accumulated.unique += properties.unique;
                            if (Array.isArray(properties.consolidatedArray)) {
                                accumulated.consolidatedArray = [].concat(_toConsumableArray(accumulated.consolidatedArray), _toConsumableArray(properties.consolidatedArray)); // PROBLEM
                                accumulated.distinctArraySecondary = [].concat(_toConsumableArray(accumulated.distinctArraySecondary), _toConsumableArray(properties.distinctArraySecondary));
                            }
                            var temp = new Set(accumulated.consolidatedArray);
                            var tempSecondary = new Set(accumulated.distinctArraySecondary);
                            accumulated.unique = temp.size;
                            accumulated.distinctArraySecondary = Array.from(tempSecondary);
                            accumulated.uniqueSecondary = tempSecondary.size;
                        }
                    }
                });
            }
    

    Help is much appreciated. thank you.

    opened by ssujan728 11
  • Reliable way to identify cluster marker

    Reliable way to identify cluster marker

    I need to identify cluster markers for adding or removing from map. When zoom changes Supercluster generates new cluster marker even if there are no changes for that marker. cluster_id is not reliable, so is there any way to generate hash from leafs or something else that is performant because marker cluster can have 2 children or 2 million. Thanks.

    bug 
    opened by nenadfilipovic 10
  • Cannot read property 'range' of undefined

    Cannot read property 'range' of undefined

    image 
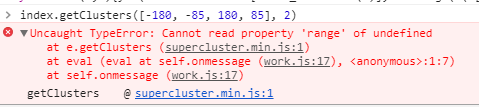
supercluster.min.js:1 Uncaught TypeError: Cannot read property 'range' of undefined at e.getClusters (supercluster.min.js:1)

    Someone knows how to solve it? thanks

    question 
    opened by zhaohongda1987 9
  • `Cannot read property 'x' of undefined` error

    `Cannot read property 'x' of undefined` error

    Before anything, I'd like to thank you very much for this package!

    I don't have an idea why this is happening, but sometimes (apparently randomly) this error occur when calling .getClusterExpansionZoom() method.

    Cannot read property 'x' of undefined
    
    Object.getChildren
    index.js:84
    

    The getChildren() method tries to read from origin.x, but origin variable is undefined. The origin var, as we can see, is created in the following line:

    var origin = this.trees[clusterZoom + 1].points[clusterId];
    

    It is undefined because (as in one of my debuggings) clusterZoom = 12 and clusterId = 21, and this.trees[13].points only have 19 entries (0 to 18), thus, this.tree[13].points[21] returns undefined.

    Any ideas why is that error occurring? Thanks! =)

    bug 
    opened by almirfilho 9
  • Make initial option in map/reduce optional

    Make initial option in map/reduce optional

    This makes map/reduce more convenient to use by making it possible to omit the initial function in most cases.

    When initial is omitted, the reducer will use the mapped values of the first reduced item as the initial value. So trivial cases like +, min and max will work seamlessly without the need for initial.

    It's kind of breaking, but I doubt many people depended on initial returning {} by default, so maybe it's OK to release this as a minor semver update.

    cc @redbmk

    opened by mourner 8
  • Add option to Generate IDs for input features

    Add option to Generate IDs for input features

    #94 implements index-based ids for the returned cluster nodes. Some GeoJSON input may not have feature ids, or may use string feature ids which do not work with geojson-vt.

    Proposal

    generateLeafIds: enables generation of ids on the leaf nodes, ensuring uniqueness across leaf nodes and cluster nodes. Overwrites any existing id values.

    Pros: Simple and efficient solution to create GeoJSON and VT spec compliant id attributes for all nodes. Cons: id value for a feature can change between different invocations of the API, and depends on the input GeoJSON features.

    enhancement 
    opened by asheemmamoowala 7
  • bounding box queries over the dateline are not always returning results

    bounding box queries over the dateline are not always returning results

    When the bounding box covers bother sides of 0 (Quandrant 4 and 1 of a circle). for example index.getClusters([2, -10, -178, 10], 1) I expect it to return the points from 0 to 2 and -178 to -180.

    I've wrote a test:

    describe('group', () => {
      const createSpot = (horizonral, vertical) => {
        return {
          type: "Feature",
          geometry: {
            type: "Point",
            coordinates: [horizontal, vertical]
          }
        }
      }
    
      var index = supercluster({
        radius: 0.01,
        maxZoom: 1,
        extent: 512
      })
    
      it('should group spots near the edge', () => {
        index.load([
          createSpot(-179.989, 0),
          createSpot(-179.990, 0),
          createSpot(-179.991, 0),
          createSpot(-179.992, 0),
        ])
    
        const spots = index.getClusters([2, -10, -178, 10], 1)
    
        return expect(spots.length).toEqual(4)
      })
    })
    

    But it fails. Am I missing something? Isn't the horizontal range -180 to 180 (vertical 90 to -90)? http://wiki.openstreetmap.org/wiki/Bounding_Box

    bug 
    opened by Andrekra 7
  • Add typescript's definition

    Add typescript's definition

    Hey team 👋

    Thanks a lot for the work put on this project that I really enjoy. I would enjoy it even more if there was official TypeScript type definition available. Since rollup is already used, it will be straightforward to add the types directly to the repo https://github.com/rollup/plugins/tree/master/packages/typescript. Another approach would be to add a .d.ts file to DefinitelyTyped.

    I can take care of it if you want 👍

    What do you think of this idea?

    opened by johannchopin 0
  • Clusters overlapping, fractal children patterns

    Clusters overlapping, fractal children patterns

    Hi,

    I've been tinkering around with supercluster and deck.gl to visualize large datasets. I'm using synthetic dataset of a 600 by 600 grid to test performance and wanted to better visualize/understand the individual clusters. I was hoping to get fairly disjoint clusters at any radius I selected, but for the most part( other than a radius of 70), the clusters frequently overlap and exhibit interesting fractal patterns.

    The images I'm displaying below show children points and polygon overlay of each cluster generated by supercluster(at the specified zoom level). Each picture has a different radius value ranging 20, 40, 70, 80, and 100 units. (The children are fetched via getLeaves(id, Inifinity) per cluster;

    I'm interested in knowing if the fractal patterns clusters exhibit is expected/usual using supercluster(or perhaps my synthetic data is causing issues with the underlying algorithm). And also if is any parameter tuning that can be done to mitigate the effect.

    If a codesandbox is desired I can try to get it set up, the only issue being the data usually causes the website to be unresponsive so I can try to generate a smaller set that exhibits the same behavior.

    Thanks

    20

    40

    70

    80

    100

    opened by sdeck51 1
  • typeof

    typeof "point_count_abbreviated" of a cluster

    Hi!

    I recently started to get familiar with the package. Thanks for the awesome work so far!

    I've noticed one unexpected behavior so far which is having the point_count_abbreviated property with two different types, number and string. It was unexpected because we already have point_count property which is always number and well the format of long number's point_count_abbreviated property should always be string anyhow. So I would suggest to have this point_count_abbreviated field as string by default.

    What would be thoughts on this?

    bug 
    opened by onur-alp4 0
  • Fix longitudes outside of [-180,180] range

    Fix longitudes outside of [-180,180] range

    This is not necessarily an issue with supercluster (assuming it expects all longitudes to be within the [-180, 180] range), but it causes issues with maplibre-gl and mapbox-gl.

    For example, a point with coordinates [-181, 0] renders fine in a non-cluster mode in the two mentioned libraries, but it doesn't render in a clustered geojson source. Here's an example showing this issue: https://codepen.io/kaveh/pen/mdBqrYq. The red layer is for non-clustered points (shows 2 rendered points) and green is for clustered (shows only 1).

    I could fix my coordinates before adding them to source in those libraries, but I thought if the same data works in non-clustered mode, it should work with clustered mode too and that's why I submitted the fix here.

    opened by ka7eh 0
  • Feature request: get zoom level at which the marker is unclustered

    Feature request: get zoom level at which the marker is unclustered

    There's the getClusterExpansionZoom which gives the zoom level at which the existing cluster is breaking into more clusters/markers.

    It would be handy to be able to zoom into a marker so it appears unclustered. The use case for this is when I select an entity related to the marker outside of the map and I need to focus on the marker in case it's out of bounds or clustered.

    Or is there a way to do this with the existing methods?

    enhancement 
    opened by orangecoloured 3
Releases(v7.1.5)
  • v7.1.5(Jul 5, 2022)

  • v7.1.4(Oct 11, 2021)

    Avoid creating new objects for same clusters across zooms, improving memory footprint and making sure the same clusters have the same cluster_id across zoom levels. #190

    Source code(tar.gz)
    Source code(zip)
  • v7.1.3(Mar 30, 2021)

  • v7.1.2(Jan 19, 2021)

  • v7.1.1(Jan 19, 2021)

  • v7.1.0(Jun 2, 2020)

  • v7.0.0(Nov 5, 2019)

    • Added generateId option to generate numeric ids (feature.id) for input features that don't have it.
    • ⚠️ Possibly breaking: adjusted generated cluster id values to make sure there are no collisions when combined with generateId.
    Source code(tar.gz)
    Source code(zip)
  • v6.0.2(Jul 23, 2019)

  • v6.0.1(Jan 24, 2019)

  • v6.0.0(Jan 17, 2019)

    ⚠️ Breaking: removed initial option of the map/reduce functionality. Now Supercluster uses the first mapped item of the cluster as the initial value:

    // before
    value = initial;
    reduce(value, a);
    reduce(value, b);
    ...
    // after
    value = a;
    reduce(value, b);
    ...
    

    In most cases, you can simply remove the initial option and things will work. There are some exceptions where you'd need to update your map function to make up for lack of initial, but they should be rare.

    Source code(tar.gz)
    Source code(zip)
  • v5.0.0(Nov 22, 2018)

    • ⚠️ breaking: changed the API entry point to new Supercluster(...) in place of supercluster(...). This makes it more in line with idiomatic modern ES, and also more flexible (i.e. you can extend the class). #109
    • Fixed getClusterExpansionZoom not returning the right result on maxZoom. #106
    • Modernized the code base — now the module entry point exposes idiomatic ES6 code, while the main entry point remains a ES5-compatible UMD build.
    Source code(tar.gz)
    Source code(zip)
  • v4.1.1(Jul 24, 2018)

  • 4.1.0(Jul 23, 2018)

  • v4.0.1(Jul 24, 2018)

  • v4.0.0(Jun 11, 2018)

  • v3.0.3(Jun 6, 2018)

  • v3.0.2(Dec 22, 2017)

  • v3.0.1(Dec 21, 2017)

  • v3.0.0(Aug 30, 2017)

    • ⚠️ Removed clusterZoom argument from getLeaves, getChildren and getClusterExpansionZoom methods — it's now encoded into cluster_id numbers, so there's no longer a need to track it separately.
    • ⚠️ As a result of the change above, the same data will have different cluster_id numbers compared to previous releases.
    • Fixed getLeaves to properly handle features with null properties.
    • Improved handling of null geometries (supercluster will ignore them instead of throwing an error).
    • Imrpoved error reporting — specifying invalid cluster_id will now result in a descriptive error.
    Source code(tar.gz)
    Source code(zip)
  • v2.3.0(Feb 6, 2017)

    • Added cluster properties aggregation through initial, map and reduce options. #36
    • Added getChildren method for getting children of a cluster on the next zoom. #31
    • Added getLeaves method for getting points of a cluster with pagination support. #19
    • Added getClusterExpansionZoom for getting the zoom where cluster expands (useful for "click to zoom" feature). #33
    • Slightly improved performance.
    Source code(tar.gz)
    Source code(zip)
  • v2.2.0(Sep 19, 2016)

  • v2.1.0(Apr 14, 2016)

    • Improved performance by at least 2 times by switching to a faster spatial index (kdbush).
    • Improved cluster placement by using weighted centers in all calculations.
    Source code(tar.gz)
    Source code(zip)
  • v2.0.1(Apr 14, 2016)

  • v2.0.0(Jan 21, 2016)

  • v1.0.0(Jan 19, 2016)

Owner
Mapbox
Mapbox is the location data platform for mobile and web applications. We're changing the way people move around cities and explore our world.
Mapbox
WebGL2 powered geospatial visualization layers

deck.gl | Website WebGL2-powered, highly performant large-scale data visualization deck.gl is designed to simplify high-performance, WebGL-based visua

Vis.gl 10.5k Jan 9, 2023
Polymaps is a free JavaScript library for making dynamic, interactive maps in modern web browsers.

Polymaps Polymaps is a free JavaScript library for making dynamic, interactive maps in modern web browsers. See http://polymaps.org for more details.

Urban Airship 1.6k Dec 23, 2022
Blazing Fast JavaScript Raster Processing Engine

Geoblaze A blazing fast javascript raster processing engine Geoblaze is a geospatial raster processing engine written purely in javascript. Powered by

GeoTIFF 125 Dec 20, 2022
Fast Map built for keys that are always fixed size uniformly distributed buffers.

turbo-hash-map Fast Map built for keys that are always fixed size uniformly distributed buffers. npm install turbo-hash-map Uses a prefix trie to map

Mathias Buus 39 Jun 20, 2022
geotiff.js is a small library to parse TIFF files for visualization or analysis. It is written in pure JavaScript, and is usable in both the browser and node.js applications.

geotiff.js Read (geospatial) metadata and raw array data from a wide variety of different (Geo)TIFF files types. Features Currently available function

geotiff.js 649 Dec 21, 2022
A Node.js map tile library for PostGIS and torque.js, with CartoCSS styling

Windshaft A Node.js map tile library for PostGIS and torque.js, with CartoCSS styling. Can render arbitrary SQL queries Generates image and UTFGrid in

CARTO 306 Dec 22, 2022
Node.js REST API for PostGres Spatial Entities. AKA: SpatialServer

PGRestAPI (a.k.a. Chubbs Spatial Server) Overview Node.js REST API for PostgreSQL Spatial Tables. An introduction to PGRestAPI can be found here A few

SpatialDev 429 Dec 9, 2022
Asynchronous, non-blocking SQLite3 bindings for Node.js

Asynchronous, non-blocking SQLite3 bindings for Node.js. Supported platforms The sqlite3 module works with: Node.js v11.x, v12.x, v13.x and v14.x. Ele

Mapbox 5.6k Jan 4, 2023
Lightweight Node.js isochrone map server

Galton Lightweight Node.js isochrone server. Build isochrones using OSRM, Turf and concaveman. Francis Galton is the author of the first known isochro

Urbica 266 Dec 17, 2022
A pluggable Node.js map tile server.

TileStrata TileStrata is a pluggable "slippy map" tile server that emphasizes code-as-configuration. The primary goal is painless extendability. It's

Natural Atlas 409 Dec 30, 2022
WMS server using node-mapnik

landspeed.js A simple WMS server written in node.js Only supports WMS 1.1 GetMap requests (bbox, width, height, and srs). Requirements Node.js 0.10.x

Dane Springmeyer 52 Jul 21, 2022
The NASA WorldWind Javascript SDK (WebWW) includes the library and examples for creating geo-browser web applications and for embedding a 3D globe in HTML5 web pages.

Web WorldWind New versions of WorldWind released Web WorldWind 0.10.0 and WorldWind Java 2.2.0 are now available on GitHub. The new version of Web Wor

NASA WorldWind 770 Jan 1, 2023
An open-source JavaScript library for world-class 3D globes and maps :earth_americas:

CesiumJS is a JavaScript library for creating 3D globes and 2D maps in a web browser without a plugin. It uses WebGL for hardware-accelerated graphics

Cesium 9.7k Dec 26, 2022
An open-source JavaScript library for world-class 3D globes and maps :earth_americas:

CesiumJS is a JavaScript library for creating 3D globes and 2D maps in a web browser without a plugin. It uses WebGL for hardware-accelerated graphics

Cesium 9.7k Jan 3, 2023
The smallest, simplest and fastest JavaScript pixel-level image comparison library

pixelmatch The smallest, simplest and fastest JavaScript pixel-level image comparison library, originally created to compare screenshots in tests. Fea

Mapbox 5.1k Jan 8, 2023
Super Low-Level Raster Reprojection and Resampling Library

geowarp Super Low-Level Raster Reprojection and Resampling Library install npm install -S geowarp usage const geowarp = require("geowarp"); const proj

Daniel J. Dufour 27 Nov 9, 2022
:leaves: JavaScript library for mobile-friendly interactive maps

Leaflet is the leading open-source JavaScript library for mobile-friendly interactive maps. Weighing just about 39 KB of gzipped JS plus 4 KB of gzipp

Leaflet 36.5k Jan 1, 2023
jQuery Vector Map Library

This project is a heavily modified version of jVectorMap as it was in April of 2012. I chose to start fresh rather than fork their project as my inten

10 Best Design 1.8k Dec 28, 2022
jQuery Vector Map Library

This project is a heavily modified version of jVectorMap as it was in April of 2012. I chose to start fresh rather than fork their project as my inten

10 Best Design 1.8k Dec 28, 2022