Satellite imagery annotation tool

Overview

Satellite imagery annotation tool

This is a lightweight web-interface for creating and sharing vector annotations over satellite/aerial imagery scenes.

Users can select a class from the class list, add polygon and point label annotations over the imagery, then download the layer of annotations as a GeoJSON file that can be easily integrated with other GIS workflows. See the live demo or screenshot below for an example:

Demo

There is a demo running the example.json file here.

Configuration file format

The tool uses config files passed via the "config" URL parameter to run different "instances", e.g.: https://server.com/index.html?config=example.json loads the "example.json" file. The below shows the format of the config file:

{
    "classes": {  // the list of (class name, colors) that will be shown on the frontend
        "Road": "#1976D2",
        "Water": "#757575",
        "Building": "#BA68C8",
        "Completed section": "#CCCCCC"  // The class "Completed section" is a special class that can be used to indicate areas that have already been labeled. If this class is included you can toggle the visibility of polygons labeled as this class independently of the other annotations.
    },
    "center": [47.631850578394406, -122.15389251708986],  // the latitude and longitude of the initial map view
    "boundingBox": [[47.57976811421671, -122.23731994628905], [47.68573021131587, -122.07115173339844]],  // the bounding box for which the basemap is valid
    "layerTitle": "NAIP Imagery",  // the title of the configuration
    "location": "Seattle, Washington, USA",  // the name of the AOI that the basemap covers
    "basemap": "https://planetarycomputer.microsoft.com/api/data/v1/mosaic/tiles/87b72c66331e136e088004fba817e3e8/WebMercatorQuad/{z}/{x}/{y}?asset_bidx=image|1,2,3&assets=image&collection=naip&format=png", // URL pointing to the basemap; this can be anything that `L.tileLayer` can parse
    "attribution": "USDA NAIP Imagery", // attribution string to display with the map
    "tms": false // whether the basemap is in a TMS format
}

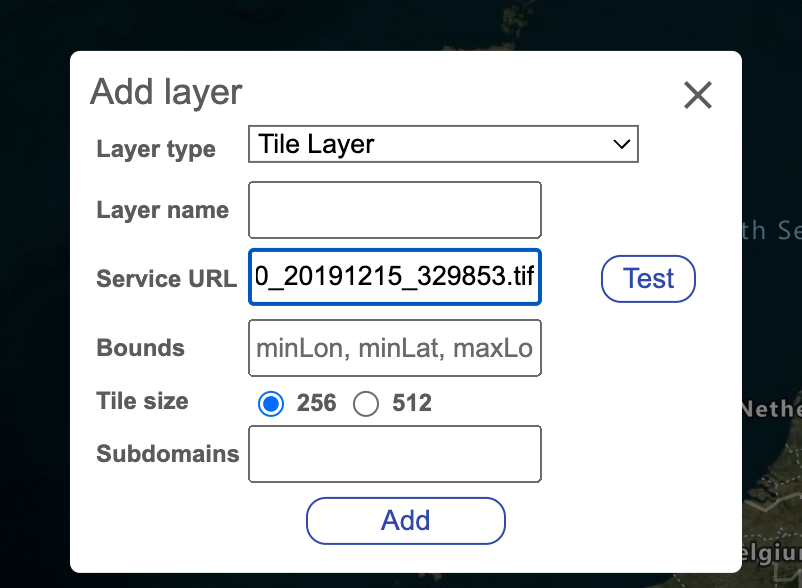
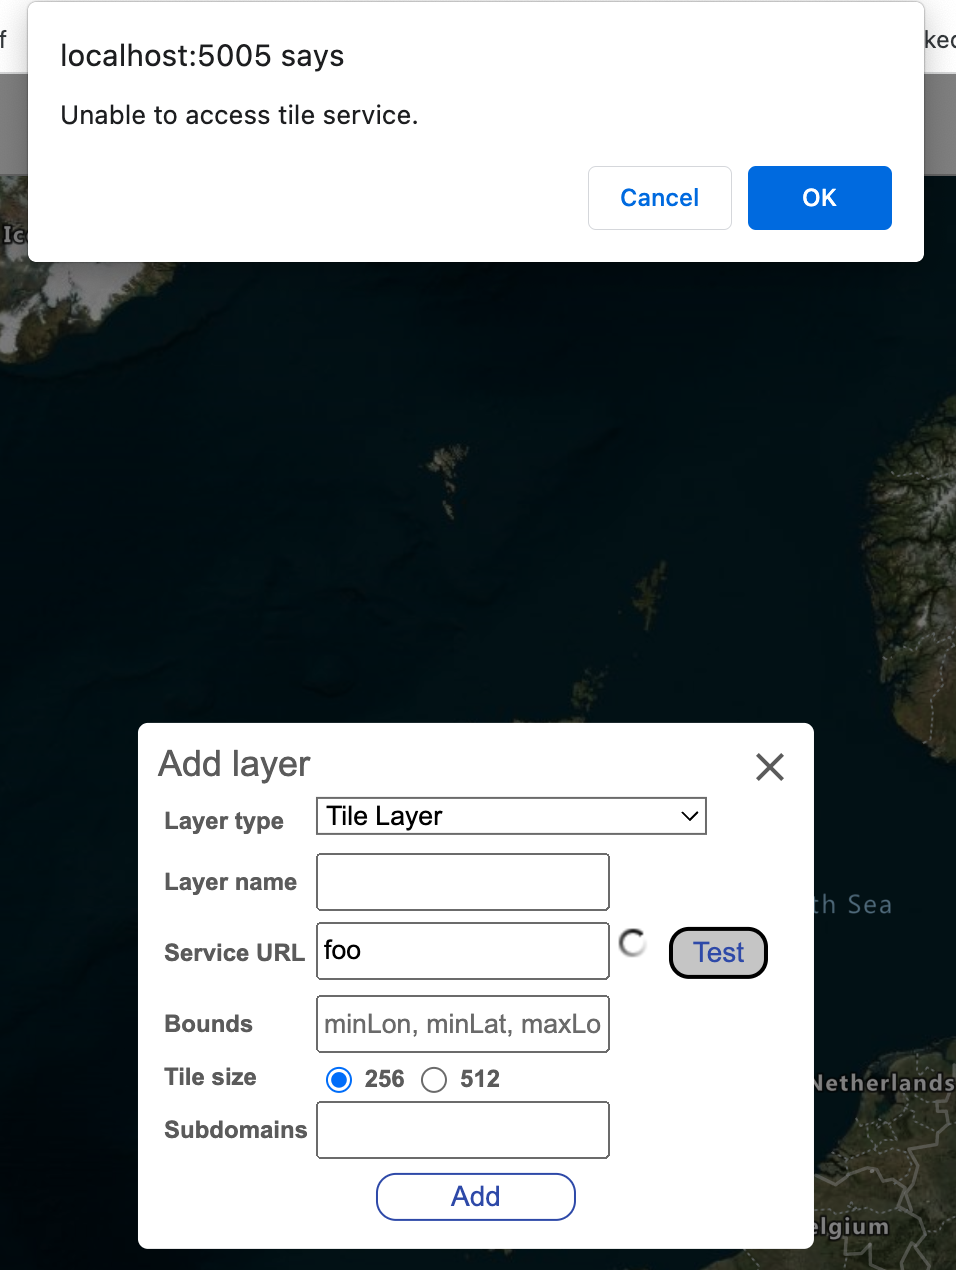
Example of using cloud optimized GeoTIFFs (COGs) as a basemap

If you have satellite/aerial imagery stored in a cloud optimized GeoTIFF format on the web (e.g. in a Azure blob storage container or S3 bucket) you can use TiTiler to render it on-the-fly and use it seamlessly with this tool.

Install and run TiTiler

TiTiler can be installed with pip. See more options on the TiTiler documentation page.

pip install -U pip
pip install uvicorn
pip install titiler.{package}

TiTiler can then be run as a server process that listens on some port (note, the machine that you run TiTiler on should be accessible from elsewhere on the web).

uvicorn --host 0.0.0.0 --port  titiler.application.main:app

See other ways of deploying TiTiler on Azure or AWS.

Create a config file that uses a TiTiler instance as a basemap

We assume that we have:

Create the following "test.json" config file on the web server machine:

{
    "classes": {
        "Road": "#1976D2",
        "Water": "#757575",
        "Building": "#BA68C8",
        "Completed section": "#CCCCCC"
    },
    "center": [28.031249, -80.593752],
    "boundingBox": [[27.997976, -80.627296], [28.064522, -80.560208]],
    "layerTitle": "TiTiler + NAIP example",
    "location": "Florida, USA",
    "basemap": "http://example.com:8888/cog/tiles/{z}/{x}/{y}.jpg?url=https://naipeuwest.blob.core.windows.net/naip/v002/fl/2019/fl_60cm_2019/28080/m_2808060_sw_17_060_20191215.tif",
    "attribution": "USDA NAIP Imagery",
    "tms": false
}

Finally, you should be able to navigate to "http://example.com/index.html?config=test.json" to create annotations over the NAIP imagery!

List of third party javascript libraries/versions

We have copied the source of the following library/versions into this repository:

License

This project is licensed under the MIT License.

Contributing

This project welcomes contributions and suggestions. Most contributions require you to agree to a Contributor License Agreement (CLA) declaring that you have the right to, and actually do, grant us the rights to use your contribution. For details, visit https://cla.opensource.microsoft.com.

When you submit a pull request, a CLA bot will automatically determine whether you need to provide a CLA and decorate the PR appropriately (e.g., status check, comment). Simply follow the instructions provided by the bot. You will only need to do this once across all repos using our CLA.

This project has adopted the Microsoft Open Source Code of Conduct. For more information see the Code of Conduct FAQ or contact [email protected] with any additional questions or comments.

Trademarks

This project may contain trademarks or logos for projects, products, or services. Authorized use of Microsoft trademarks or logos is subject to and must follow Microsoft's Trademark & Brand Guidelines. Use of Microsoft trademarks or logos in modified versions of this project must not cause confusion or imply Microsoft sponsorship. Any use of third-party trademarks or logos are subject to those third-party's policies.

Comments
  • On adding a result the project viewer does not open the project

    On adding a result the project viewer does not open the project

    Hi I have created a project and can successfully view it in the project viewer. I then annotated a single task and place it in the results dir of the project, then zip it all up. However the project viewer will then not open the project, and there is no error message. The generated geojson is below - no issues loading in qgis however:

    {"type":"FeatureCollection","features":[
    {"type":"Feature","properties":{"source":"Drawn|Azure Maps Satellite","class":"house","secondary_class":null,"task_name":"Robins_house_0"},"geometry":{"type":"Polygon","coordinates":[[[-0.26219,51.389004]]]}},
    {"type":"Feature","properties":{"source":"Drawn|Azure Maps Satellite","class":"house","secondary_class":null,"task_name":"Robins_house_0"},"geometry":{"type":"Polygon","coordinates":[[[-0.261835,51.388774],[-0.261975,51.388854],[-0.261915,51.388891],[-0.261975,51.388929],[-0.261908,51.388962],[-0.261747,51.388875],[-0.261734,51.388883],[-0.261674,51.388849],[-0.261754,51.388799],[-0.261774,51.388808],[-0.261835,51.388774]]]}},
    {"type":"Feature","properties":{"source":"Drawn|Azure Maps Satellite","class":"house","secondary_class":null,"task_name":"Robins_house_0"},"geometry":{"type":"Polygon","coordinates":[[[-0.261788,51.388766],[-0.261687,51.388829],[-0.261519,51.388728],[-0.26162,51.388661],[-0.261788,51.388766]]]}},
    {"type":"Feature","properties":{"source":"Drawn|Azure Maps Satellite","class":"house","secondary_class":null,"task_name":"Robins_house_0"},"geometry":{"type":"Polygon","coordinates":[[[-0.261922,51.38836],[-0.261751,51.388439],[-0.261643,51.388358],[-0.261707,51.388326],[-0.261724,51.388341],[-0.261798,51.388314],[-0.261784,51.388299],[-0.261821,51.38828],[-0.261922,51.38836],[-0.261922,51.38836]]]}},
    {"type":"Feature","properties":{"task_name":"Robins_house_0"},"geometry":{"type":"Polygon","coordinates":[[]]}}]}
    
    opened by robmarkcole 7
  • Consider using Azure Maps for the map control

    Consider using Azure Maps for the map control

    Consider using Azure Maps for the map control. It performs much better than leaflet and will be a lot more usable. You can also put the NAIP imagery below map labels if desired.

    opened by rbrundritt 6
  • Rename `src/overpassScripts/*.txt` to `src/overpassScripts/*.overpassql`

    Rename `src/overpassScripts/*.txt` to `src/overpassScripts/*.overpassql`

    *.overpassql is now the recommended file extension for Overpass QL: OSM Wiki: Overpass QL § File extension (Disclaimer: I added that section after some discussion.)

    I propose to rename all Overpass QL files in this repo to *.overpassql for consistency.

    Context: GitHub's syntax highlighting engine requires that 200 repositories use the same file extension before they consider supporting that syntax and file extension: https://github.com/github/linguist/issues/5890

    opened by FloEdelmann 3
  • Adjust brightness and contrast of image only

    Adjust brightness and contrast of image only

    Hi, great work on this! I need to adjust the brightness and contrast (B&C) of my COG, but using the existing sliders also changes the B&C of the map. Not sure if this is (a) intended (b) a WIP or (c) a bug? Cheers

    opened by robmarkcole 3
  • Feature request: Selecting default map layer

    Feature request: Selecting default map layer

    For labeling tasks with custom layers, users will often want to start on the custom layer instead of the Azure Maps Layer. An option in the project configuration that allows to set a default layer might streamline the process a little.

    opened by calebrob6 1
  • Test Service URL not catching bad URL if titiler running

    Test Service URL not catching bad URL if titiler running

    I can insert a wrong URL, hit test, and there is no error. Note that titiler is running on 8000 and the image can be downloaded at http://localhost:5005/data/m_2808060_sw_17_060_20191215.tif so I am using URL http://localhost:8000/cog/tiles/{z}/{x}/{y}.jpg?url=http://localhost:5005/data/m_2808060_sw_17_060_20191215.tif and then breaking it in the test below:

    image

    However this functionality does appear to be working if I give a clearly wrong URL: image

    I dont know if this might be somehow due to using python to serve the file, I am running python3 -m http.server 5005 and have the tif at data/m_2808060_sw_17_060_20191215.tif

    I have also tried adding to labeler_settings.js but the layer is not shown - actually that appears to be a caching issue, it does appear in an incognito window

    opened by robmarkcole 4
Releases(initial-version-2)
Owner
Microsoft
Open source projects and samples from Microsoft
Microsoft
Downloads satellite images from Google Maps, only slightly illegal.

Google Maps Satellite Downloader This is a script to download satellite images from Google Maps. The below mentioned optimization system requires that

null 5 Oct 31, 2022
A web based data mining tool for OpenStreetMap using the Overpass API.

overpass turbo https://overpass-turbo.eu/ – stable version https://tyrasd.github.io/overpass-turbo/ – latest version This is a GUI for testing and dev

Martin Raifer 607 Dec 29, 2022
Geokit - is a command-line interface (CLI) tool written in javascript, that contains all the basic functionalities for measurements, conversions and operations of geojson files.

Geokit Geokit is a command-line interface (CLI) tool written in javascript, that contains all the basic functionalities for measurements, conversions

Development Seed 31 Nov 17, 2022
A map tool with real-time collaboration 🗺️

Mapus Maps with real-time collaboration ??️ Mapus is a tool to explore and annotate collaboratively on a map. You can draw, add markers, lines, areas,

Alyssa X 3k Jan 4, 2023
An online tool to generate and visualize maps for irregular and/or gapped LED layouts, for use with FastLED, Pixelblaze and other libraries.

An online tool to generate and visualize maps for irregular and/or gapped LED layouts, for use with FastLED, Pixelblaze and other libraries.

Jason Coon 172 Dec 8, 2022
Annotation-Wizard - a web-based image annotation platform that allows authors to create annotation tasks and annotators to take tasks and annotate images.

Annotation Wizard Annotation Wizard is a web-based image annotation platform. Functionalies User login and register create your own image annotation t

null 2 Aug 12, 2022
Experiments with overlaying time-series satellite imagery on a map

Videomap.earth Experiments with overlaying time-series satellite imagery as video over maps. TODO: Add instructions on generating video files using st

Development Seed 6 May 10, 2023
Aniso is an open-source ASCII tool built by Studio Freight to generate and customize character-based imagery.

Aniso Aniso is an open-source ASCII tool built by Studio Freight to generate and customize character-based imagery. Features Granularity control Chara

Studio Freight Darkroom 10 Dec 16, 2022
A Google Earth Engine tool for identifying satellite radar interference

Many military radars interfere with open source satellite imagery when they're turned on. A new tool lets anyone monitor when and where these radars a

Bellingcat 411 Dec 27, 2022
Downloads satellite images from Google Maps, only slightly illegal.

Google Maps Satellite Downloader This is a script to download satellite images from Google Maps. The below mentioned optimization system requires that

null 5 Oct 31, 2022
the 'natural satellite' subnet manager

deimos the 'natural satellite' subnet manager more just built against a grudge, because a spreadsheet is the worst way to store this kind of informati

Aaron Duce 2 Feb 7, 2022
Annotation plugin for Chart.js

chartjs-plugin-annotation.js An annotation plugin for Chart.js >= 3.0.0 This plugin needs to be registered. It does not function as inline plugin. For

Chart.js 515 Dec 30, 2022
Annotation tools for the web. Select text, images, or (nearly) anything else, and add your notes.

Annotator Annotator is a JavaScript library for building annotation applications in browsers. It provides a set of interoperable tools for annotating

Open Annotation 2.6k Dec 23, 2022
A GitHub action to run Dart analyzer with annotation support.

⚒️ GitHub Action for Dart Analyzer A GitHub action to run Dart analyzer with annotation support. License Usage name: "analyze" on: # rebuild any PRs a

Invertase 149 Dec 28, 2022
Text annotation solution for websites. TypeScript and vanilla JavaScript version.

Simple Text Annotations Use this small library when you need to add annotations to your website. Features show up / hide annotation on a element click

Jacek Jarczok 1 May 9, 2021
Interactive Text Annotation for Jupyter Notebook/Lab

Interactive Text Annotation for Jupyter Notebook/Lab Perform entity extraction inline without leaving your notebook. Iteratively label and train a mod

null 8 Dec 26, 2022
Uniform, Unlimited, Universal and Unbelievable Annotation Toolbox

特性 ?? 本项目包含@label-u/annotation、@label-u/components、@label-u/utils及@label-u/web等4个工程。 ?? 采用rollup esbuild插件及vite编译,让开发者上高速,开发效率更高 ?? 采用lerna进行多工程管理。 ??

OpenDataLab 16 Dec 23, 2022
Grid-tool - Small tool that allows you to integrate a predefined or generated grid into your front-end development environment.

Grid tool Small tool that allows you to integrate a predefined or generated grid into your front-end development environment. Tool installation includ

hmongouachon 2 Jan 4, 2022
A CLI tool to create a NodeJS project with TypeScript CTSP is a CLI tool to make easier to start a new NodeJS project and configure Typescript on it.

CTSP- Create TS Project A CLI tool to create a NodeJS project with TypeScript CTSP is a CLI tool to make easier to start a new NodeJS project and conf

Jean Rodríguez 7 Sep 13, 2022