Predefined color schemes for Chart.js

Overview

chartjs-plugin-colorschemes

npm Bower Travis Coverage Maintainability Awesome

Predefined color schemes for Chart.js

You can pick the perfect color combination for your charts from the predefined color schemes, which are based on popular tools such as ColorBrewer, Microsoft Office and Tableau.

This plugin requires Chart.js 2.5.0 or later.

Installation

You can download the latest version of chartjs-plugin-colorschemes from the GitHub releases.

To install via npm:

npm install chartjs-plugin-colorschemes --save

To install via bower:

bower install chartjs-plugin-colorschemes --save

To use CDN:

<script src="https://cdn.jsdelivr.net/npm/chartjs-plugin-colorschemes"></script>
<script src="https://unpkg.com/chartjs-plugin-colorschemes"></script>

Usage

chartjs-plugin-colorschemes can be used with ES6 modules, plain JavaScript and module loaders.

Include Chart.js and chartjs-plugin-colorschemes.js to your page, and specify a color scheme as shown in the example below. You can pick a scheme from Color Chart.

    options: {
        plugins: {
            colorschemes: {
                scheme: 'brewer.Paired12'
            }
        }
    }

Every color scheme has a number at the end of its name, which indicates the number of that colors included in the scheme. If the number of the datasets is larger than it, the same colors will appear repeatedly. A color is not modified if it is specified by dataset options.

Usage in ES6 as Module

Nothing else than importing the module should be enough.

import 'chartjs-plugin-colorschemes';

If you want to reduce the size by only importing the plugin core and particular color schemes, see the example below.

// import the plugin core
import 'chartjs-plugin-colorschemes/src/plugins/plugin.colorschemes';

// import a particular color scheme
import { Aspect6 } from 'chartjs-plugin-colorschemes/src/colorschemes/colorschemes.office';

// ...
    options: {
        plugins: {
            colorschemes: {
                scheme: Aspect6
            }
        }
    }
//...

Tutorial

You can find a tutorial at nagix.github.io/chartjs-plugin-colorschemes.

Configuration

The plugin options can be changed at 2 different levels and with the following priority:

  • per chart: options.plugins.colorschemes.*
  • globally: Chart.defaults.global.plugins.colorschemes.*

All available options are listed below.

Name Type Default Description
fillAlpha number 0.5 The transparency value for the line fill color. Must be a number between 0.0 (fully transparent) and 1.0 (no transparency).
scheme string|string[] 'brewer.Paired12' Color scheme name that is any of Color Chart. It also accepts an array of color strings, which is primarily for ES modules. more...
reverse boolean false If set to true, the order of the colors in the selected scheme is reversed.
override boolean false If set to true, the specified color scheme will override the existing color options. If false, it is only applied when no color setting exists. more...
custom function undefined A function that takes a copy of the color string array for scheme in order to extend the predefined scheme colors. more...

Overriding Existing Color Settings

By default, this plugin doesn't apply a color scheme if any color options are already specified. This may cause a problem if you are using a third party library such as ng-charts, which automatically applies default color settings. In that case, the existing color settings can be overridden by setting the override option to true.

custom-Function

With the help of the custom-Function you can extend the predefined scheme colors. This function takes a copy of the current scheme and is expected to return an array with at least one element. See the example below.

var customColorFunction = function(schemeColors) {
    var myColors = ['#ff0000', '#00ff00', '#0000ff']; // define/generate own colors

    // extend the color scheme with own colors
    Array.prototype.push.apply(schemeColors, myColors);

    return schemeColors; // optional: this is not needed if the array is modified in place
};

// ...
    options: {
        plugins: {
            colorschemes: {
                scheme: 'brewer.Paired12',
                custom: customColorFunction
            }
        }
    }
//...

custom colorscheme from scratch

It is possible to build your custom colorscheme from scratch (without using the custom function) by simply defining the colors it contains. See example below.

var myColors = ['red', 'green', 'blue', 'orange', 'black', 'yellow'];

// ...
    options: {
        plugins: {
            colorschemes: {
                scheme: myColors
            }
        }
    }
//...

Building

You first need to install node dependencies (requires Node.js):

npm install

The following commands will then be available from the repository root:

gulp build            # build dist files
gulp build --watch    # build and watch for changes
gulp test             # run all tests
gulp test --watch     # run all tests and watch for changes
gulp test --coverage  # run all tests and generate code coverage
gulp lint             # perform code linting
gulp package          # create an archive with dist files and samples

License

chartjs-plugin-colorschemes is available under the MIT license.

Comments
  • This doesn't work

    This doesn't work

    I love the idea behind this project... unfortunately I just tried it and it doesn't work. I followed the directions exactly as described and all of my metrics are all grey colored. There are also no errors.

    chart.js version 2.7.3 chartjs-plugin-colorschemes version 0.1.0 installed with npm using react

    image

    image

    opened by blockjon 10
  • Extend the amount of scheme colors through a function

    Extend the amount of scheme colors through a function

    Hey @nagix , would you accept this commit as a pull request? -> https://github.com/JohnArcher/chartjs-plugin-colorschemes/commit/707ce90516af10e23e7ded3055f75d9c4a4e9f63

    The aim is to (dynamically) add additional colors to a scheme in order to e.g. prevent that the same colors are used again when you have more datasets then colors.

    An example using my code would be:

    var myColorFunction = function () {
        var myColors = ['#ff00000', '#00ff00'];
        // ... or calculate your colors with some fancy algorithm
        return myColors;
    }
    
    ...
        plugins: {
            colorschemes: {
                scheme: 'brewer.Paired12',
                colorFunction: myColorFunction
            }
        }
    

    I really need this behaviour. :-) What do you think?

    enhancement 
    opened by JohnArcher 8
  • Add compatibility with ChartJS v3

    Add compatibility with ChartJS v3

    Hello there! I need to be honest with you, I have not tested this code at all, but this is essentially what came out of my attempts to get the plugin working again. So, it may only bring back rudimentary compatibility.

    I have used code from someone else as you can see. ~I need to get in touch to confirm that this is okay.~ I have just received confirmation that this is not an issue.

    Fixes #24 Fixes #25

    enhancement 
    opened by MartijnVerkleij 7
  • Stacking bars with colors that make sense

    Stacking bars with colors that make sense

    I have a stacked series of bars. I would like to force the colors of the upper bar in the stack to be a ligher/less saturated hue than the lower color. Is this possible to do?

    The default looks like this using brewer.Paired12.

    I want to make the pink bar a lighter blue to match the bar below it, the red bar a light blue to match the dark blue below it, and so on.

    Is it possible to reference the color in a series and adjust the saturation?

    opened by PaulWieland 4
  • Having trouble getting this working

    Having trouble getting this working

    First I just want to say that this is a fantastic idea and I'm really happy you developed the package. Pretty crazy that something like this isn't included by default in chartJS. I am unfortunately having some trouble getting it working within my application though.

    I am loading your package via jsdelivr CDN, and using it along with chartJS within a basic jQuery document ready function. I am not a JS expert so I guess I could be setting something up wrong here, but it's not apparent to me what it is. My code seems to match your examples, at least for setting up the config parameter.

    Here is what my chart currently looks like: image

    Here is my loading of your package & chart js in my base html file:

        <script
          type="text/javascript"
          src="https://cdn.jsdelivr.net/npm/[email protected]"
        ></script>
        <script
          type="text/javascript"
          src="https://cdn.jsdelivr.net/npm/chartjs-plugin-colorschemes"
        ></script>
    

    And here is my .js file containing the chartJS and your package code. Note that this file is called at the very end of the body of my base HTML file.

    $(function() {
      /// code goes here that sets up data variables below (cacc, rsvc, models)
      /// not posted to keep post short
    
      let ctx = document.getElementById("stacked_chartjs");
      let chart = new Chart(ctx, {
        type: "line",
        data: {
          labels: ["January", "February", "March", "April", "May", "June", "July", "August"
          ],
          datasets: [
            {
              label: "Corporate Access",
              data: cacc
            },
            {
              label: "Research Services",
              data: rsvc
            },
            {
              label: "Models & Content",
              data: models
            }
          ]
        },
        options: {
          plugins: {
            colorschemes: {
              scheme: "brewer.Paired12"
            }
          },
          maintainAspectRatio: true,
          responsive: true,
          tooltips: {
            mode: "index",
            intersect: false
          },
          hover: {
            mode: "index"
          },
          scales: {
            xAxes: [
              {
                scaleLabel: {
                  display: true,
                  labelString: "Month"
                }
              }
            ],
            yAxes: [
              {
                stacked: true,
                scaleLabel: {
                  display: true,
                  labelString: "Consumpion"
                }
              }
            ]
          }
        }
      });
    });
    
    opened by riptusk331 2
  • Add a function to extend scheme's color array

    Add a function to extend scheme's color array

    You can add a new option called custom which should be a function that receives a clone of the configured scheme and has to return an array of colors. If no or an empty array is returned the original scheme is used.

    enhancement 
    opened by JohnArcher 2
  • colorschemes not working

    colorschemes not working

    @nagix this is my option in data

    options:{
    	plugins : {
    		colorschemes : {
    			scheme : 'brewer.YlGn3'
    		}
    	}
    }
    

    by default brewer.Paired12 is applied even I change other schemes

    opened by mohamedmohsin 2
  • [REQUEST] Modularize

    [REQUEST] Modularize

    Modularizing the color schema(s) will greatly reduce the user payload.

    i.e: Instead of:

    import 'chartjs-plugin-colorschemes';  // This loads everything at 50K!
    

    Use:

    import { OfficeAspect6 } from 'chartjs-plugin-colorschemes';  // Only loads what's needed = 75 bytes!!
    
    enhancement 
    opened by CelticParser 2
  • Scatter Chart Colors

    Scatter Chart Colors

    Nice plugin. It seems to work well for the POINTS on my scatter charts, but the lines between the points are left as the default gray color that comes with chartjs.

    How can I fix this problem?

    bug 
    opened by xyrph 2
  • Error during npm install

    Error during npm install

    I triend to install this package with ng2-charts v3.0.8 and chart.js v3.6.0 but I get a dependency error:

    npm ERR! code ERESOLVE npm ERR! ERESOLVE unable to resolve dependency tree npm ERR! npm ERR! While resolving: **[email protected] npm ERR! Found: [email protected] npm ERR! node_modules/chart.js npm ERR! chart.js@"3.6.0" from the root project npm ERR! npm ERR! Could not resolve dependency: npm ERR! peer chart.js@">= 2.5.0 < 3" from [email protected] npm ERR! node_modules/chartjs-plugin-colorschemes npm ERR! chartjs-plugin-colorschemes@"" from the root project npm ERR! npm ERR! Fix the upstream dependency conflict, or retry npm ERR! this command with --force, or --legacy-peer-deps npm ERR! to accept an incorrect (and potentially broken) dependency resolution.

    Does it say it still requires chart.js version to be lower than 3?

    opened by Zxcid 1
  • Plugin doesn't work with Chart.js 3.x.x

    Plugin doesn't work with Chart.js 3.x.x

    Please add support for Chartjs 3.x.x or at least mention it in the README since it only says "This plugin requires Chart.js 2.5.0 or later."

    Chart.js changed from Chart.defaults.global to Chart.defaults in the new version.

    image image

    https://www.chartjs.org/docs/master/getting-started/v3-migration/#defaults

    opened by esttenorio 1
  • Error with chart js 3.9.1

    Error with chart js 3.9.1

    Just included the js file in html page and havent added colorschemes to plugins yet. Still getting error. https://stackoverflow.com/questions/74630153/chartjs-3-9-1-and-colorscheme-not-working

    image

    opened by jinyeng 1
  • 0.4.0 Unable to Get Working

    0.4.0 Unable to Get Working

    Hi Team,

    I am using vanilla .NET MVC website (have razor cshtml view file) where I have got both chart.js and chartjs-plugin-colorschemes installed (installed via LibMan client side library). Having followed instructions, I am receiving the following message on console (F12 dev tools in browser):

    Uncaught TypeError: Cannot read properties of undefined (reading 'plugins') in both .min.js and .js versions.

    Inspecting the main JS file the error is here:

    Chart.defaults.global.plugins.colorschemes = {
    	scheme: 'brewer.Paired12',
    	fillAlpha: 0.5,
    	reverse: false,
    	override: false
    };
    

    Additionally, I tried the NPM runkit option: https://npm.runkit.com/chartjs-plugin-colorschemes and it returns the same error.

    My Razor Page:

    <div class="row">
            <div class="col-lg-4">
                <canvas id="myChart"></canvas>
            </div>
        </div>
    
    <script>
        const ctx = document.getElementById('myChart').getContext('2d');
        const myChart = new Chart(ctx, {
            type: 'bar',
            data: {
                labels: ['Red', 'Blue', 'Yellow', 'Green', 'Purple', 'Orange'],
                datasets: [{
                    label: '# of Votes',
                    data: [4, 6, 3, 5, 2, 3],               
                    borderWidth: 1
                }]
            },
            options: {
                plugins: {
                    colorschemes: {
                        scheme: 'brewer.GnBu6'
                    }
                }
            }
        });
    </script>
    

    My Master / Layout page:

    <script src="~/Content/js/ChartJS3.7.1/chart.min.js"></script>
    <script src="~/Content/js/ChartJsColorSchemes0.4.0/chartjs-plugin-colorschemes.js"></script>
    

    My Index View: The bar chart renders but without any colours scheme applied.

    Perhaps I am not doing something right? Apologies if that is the case.

    opened by uday-thakur 9
  • Use color scheme outside angular?

    Use color scheme outside angular?

    Hiya,

    Next to my chart i'd like to show an overview of the avg,mix/max values of whats in my chart. Would it be possible to grab the colors from the color scheme somehow?

    opened by sommmen 2
  • Is there any way to produce a Color Scale?

    Is there any way to produce a Color Scale?

    I was wondering if there was any way to create a color scale that would obtain a color based on a certain value. My target is to make this plot have brighter colors for higher absolute values i.e. progressively brighter green for high positive values and the same thing (in red) for high negative values.

    image

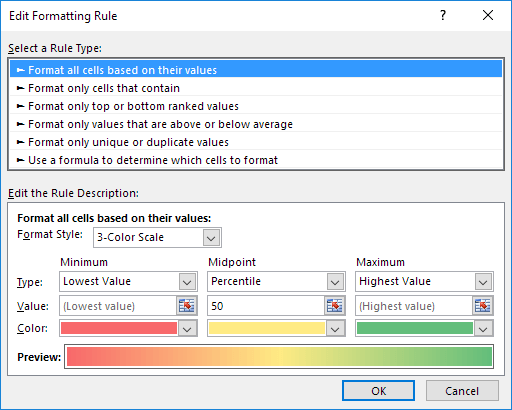
    Microsoft Excel can create this color scale in the Conditional Formatting section and the result looks like this:

    image

    image

    opened by matheusft 0
Owner
Akihiko Kusanagi
Akihiko Kusanagi
Automatic color generation for Chart.js

chartjs-plugin-autocolors Automatic color generation for Chart.js The generation is based on Janus Troelsen's answer at Stack Overflow. This plugin re

Jukka Kurkela 28 Dec 17, 2022
A Simple Dashboard Chart in Laravel Nova using Chart JS

A Simple Dashboard Chart in Laravel Nova using Chart JS. Starting create your own dashboard with Chart JS Integration can save your time and help you maintain consistency across standard elements such as Bar, Stacked, Line, Area, Doughnut and Pie Chart.

Kuncoro Wicaksono 177 Jan 4, 2023
Chart.js plugin to defer initial chart updates

Chart.js plugin to defer initial chart updates until the user scrolls and the canvas appears inside the viewport, and thus trigger the initial chart a

Chart.js 97 Nov 9, 2022
Bar Funnel Chart extension for Chart.js

Chart.BarFunnel.js Provides a Bar Funnel Chart for use with Chart.js Documentation To create a Bar Funnel Chart, include Chart.BarFunnel.js after Char

Chart.js 58 Nov 24, 2022
TradeX-chart is a trade chart written in plain (vanilla) JavaScript with minimal dependencies

TradeX-chart is a trade chart written in plain (vanilla) JavaScript with minimal dependencies; use it with any framework or backend.

null 24 Dec 12, 2022
Grab the color palette from an image using just Javascript. Works in the browser and in Node.

Color Thief Grab the color palette from an image using just Javascript.Works in the browser and in Node. View the demo page for examples, API docs, an

Lokesh Dhakar 11.2k Dec 30, 2022
An HTML5/Canvas implementation of 8-bit color cycling

Overview Here is the JavaScript and C++ source code to my color cycling engine, written in 2010. I am releasing it under the LGPL v3.0. The package co

Joseph Huckaby 8 Dec 1, 2022
Redefined chart library built with React and D3

Recharts Introduction Recharts is a Redefined chart library built with React and D3. The main purpose of this library is to help you to write charts i

recharts 19.4k Jan 2, 2023
:bar_chart: A D3-based reusable chart library

c3 c3 is a D3-based reusable chart library that enables deeper integration of charts into web applications. Follow the link for more information: http

C3.js 9.2k Jan 2, 2023
GPL version of Javascript Gantt Chart

dhtmlxGantt Getting started | Features | Follow us | License | Useful links dhtmlxGantt is an open source JavaScript Gantt chart that helps you illust

null 952 Dec 29, 2022
🍞📊 Beautiful chart for data visualization.

?? ?? Spread your data on TOAST UI Chart. TOAST UI Chart is Beautiful Statistical Data Visualization library. ?? Packages The functionality of TOAST U

NHN 5.2k Jan 2, 2023
:bar_chart: Re-usable, easy interface JavaScript chart library based on D3.js

billboard.js is a re-usable, easy interface JavaScript chart library, based on D3 v4+. The name "billboard" comes from the famous billboard chart whic

NAVER 5.4k Jan 1, 2023
:bar_chart: A library of modular chart components built on D3

Plottable Plottable is a library of chart components for creating flexible, custom charts for websites. It is built on top of D3.js and provides highe

Palantir Technologies 2.9k Dec 31, 2022
Chart image and QR code web API

QuickChart QuickChart is a service that generates images of charts from a URL. Because these charts are simple images, they are very easy to embed in

Ian Webster 1.3k Dec 25, 2022
📈 A small, fast chart for time series, lines, areas, ohlc & bars

?? μPlot A small (~35 KB min), fast chart for time series, lines, areas, ohlc & bars (MIT Licensed) Introduction μPlot is a fast, memory-efficient Can

Leon Sorokin 7.5k Jan 7, 2023
TChart.js - simple and configurable Bar and Line Chart library in Javascript

TChart.js Simple and configurable Bar and Line Chart library in Javascript Description TChart.js is a canvas-based simple Javascript Bar and Line Char

null 4 Mar 3, 2021
🍞📊 Beautiful chart for data visualization.

?? ?? Spread your data on TOAST UI Chart. TOAST UI Chart is Beautiful Statistical Data Visualization library. ?? Packages The functionality of TOAST U

NHN 5.2k Jan 6, 2023
The power of Chart.js in Jupyter !

The power of Chart.js in Jupyter Notebooks Installation You can install ipychart from your terminal using pip or conda: # using pip $ pip install ipyc

Nicolas H 68 Dec 8, 2022
Chart.js bindings for OCaml

chartjs-ocaml: OCaml bindings for Chart.js This library provides OCaml bindings for the Chart.js charting library and some popular plugins. Following

Alex Yanin 13 Aug 20, 2022