jQuery plugin based on raphael.js that allows you to display dynamic vector maps

Overview

jQuery Mapael - Dynamic vector maps

Build Status CDNJS

The complete documentation is available on Mapael website (repository: 'neveldo/mapael-documentation').

Additional maps are stored in the repository 'neveldo/mapael-maps'.

The documentation of Raphael.js is available here (mirror).

Overview

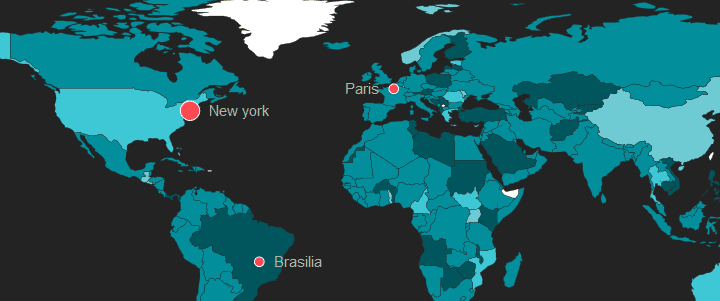
jQuery Mapael is a jQuery plugin based on raphael.js that allows you to display dynamic vector maps.

For example, with Mapael, you can display a map of the world with clickable countries. You can also build simple dataviz by setting some parameters in order to automatically set a color depending on a value to each area of your map and display the associated legend. Moreover, you can plot cities on the map with circles, squares or images by their latitude and longitude. Many more options are available, read the documentation in order to get a complete overview of mapael abilities.

Mapael supports all modern browsers and Internet Explorer 9+. For older versions of IE, you can load jQuery 1.11.x and Raphael.js 2.1.2 as dependencies, most of the jQuery Mapael features should work fine.

Dataviz example

See this example !

Key features

  • based on jQuery and raphael.js. And optionally based on jQuery mousewheel for the zoom on mousewheel feature.
  • Interactive. Set href, tooltip, add events and many more on the elements of your map.
  • Plottable cities Cities can be plotted on the map with circles, squares, images or SVG paths by their latitude and longitude
  • Areas and plotted points colorization with legends. Mapael automatically sets attributes like color and size to each area and plotted point displayed on map and generates an interactive legend in order to build pretty dataviz
  • Links between cities. You can draw links between the cities of the map.
  • Easy to add new maps. Build your own maps based on SVG paths
  • SEO-friendly. An alternative content can be set for non-JS users and web crawlers
  • Resizable Maps are easily resizable.
  • Zoom Zoom and panning abilities (also on mobile devices).

Installation

Directly in your page

Note on dependencies: jQuery and Raphael (and Mousewheel, if needed) must be loaded before Mapael in order to work properly.

Note on maps: map files must be loaded after Mapael in order to work properly.

Using CDN

Include in your project page one of these tags:

<script src="//cdnjs.cloudflare.com/ajax/libs/jquery-mapael/2.2.0/js/jquery.mapael.min.js"></script>
<script src="//cdn.jsdelivr.net/npm/[email protected]/js/jquery.mapael.min.js"></script>

Using self-hosted

Download the latest version and extract jquery.mapael.min.js in your project.

Then, add the script to your page (update the path as needed):

<script src="path/to/jquery.mapael.min.js"></script>

Using a package manager

NPM / Yarn

In your project root, run either commandline:

npm i --save jquery-mapael
yarn add jquery-mapael

However, if you don't need the optional Mousewheel feature (for Zoom feature), then you can use the --no-optional flag to skip optional dependencies.

Use either:

npm i --no-optional jquery-mapael
yarn add --no-optional jquery-mapael

Then in your application:

require('jquery-mapael');

Or, in ES6:

import 'jquery-mapael';

Bower

In your project root, run:

bower install jquery-mapael --save

Basic code example

Here is the simplest example that shows how to display an empty map of the world :

HTML :

    <div class="container">
        <div class="map">Alternative content</div>
    </div>

JS :

    $(".container").mapael({
        map : {
            name : "world_countries"
        }
    });

Examples

Basic

Advanced

Contributing

Want to contribute? See the CONTRIBUTING file.

License

Copyright (C) 2013-2020 Vincent Brouté

jQuery Mapael is licensed under the MIT license (http://www.opensource.org/licenses/mit-license.php).

Permission is hereby granted, free of charge, to any person obtaining a copy of this software and associated documentation files (the "Software"), to deal in the Software without restriction, including without limitation the rights to use, copy, modify, merge, publish, distribute, sublicense, and/or sell copies of the Software, and to permit persons to whom the Software is furnished to do so, subject to the following conditions:

The above copyright notice and this permission notice shall be included in all copies or substantial portions of the Software.

THE SOFTWARE IS PROVIDED "AS IS", WITHOUT WARRANTY OF ANY KIND, EXPRESS OR IMPLIED, INCLUDING BUT NOT LIMITED TO THE WARRANTIES OF MERCHANTABILITY, FITNESS FOR A PARTICULAR PURPOSE AND NONINFRINGEMENT. IN NO EVENT SHALL THE AUTHORS OR COPYRIGHT HOLDERS BE LIABLE FOR ANY CLAIM, DAMAGES OR OTHER LIABILITY, WHETHER IN AN ACTION OF CONTRACT, TORT OR OTHERWISE, ARISING FROM, OUT OF OR IN CONNECTION WITH THE SOFTWARE OR THE USE OR OTHER DEALINGS IN THE SOFTWARE.

Comments
  • Roadmap to 2.2.0

    Roadmap to 2.2.0

    @neveldo

    Can we list the remaining features / tasks needed for the release of 2.2.0?

    • [ ] Fix #361
    • [x] Review/Merge PR #337
    • [x] Review/Merge PR #344
    • [ ] Implements #253/Review/Merge PR #352
    • [x] Fix #346/Review/Merge PR neveldo/mapael-maps#44
    • [ ] Implements zoomOnCLick/Review/Merge PR (TBD)
    • [x] Update Changelog (in progress)
    • [x] Update documentation (in progress)

    ~~Also, should we implement #276 for 2.2.0?~~

    Regarding the mapael-maps repo, should it follow the mapael repo version or should it have its own numbering?

    opened by Indigo744 25
  • [newb] disable plot aimations & zooming

    [newb] disable plot aimations & zooming

    Hi,

    first I'd like to thank you for this great fork! I really love it!

    I have 3 simple questions which I can't seem to fix.

    • I'd like to kill all the animations on the map. (mainly just the plot hover) fixed it using: "animDuration": 0, stroke: "transparent"
    • I do got zoom on scroll, pinch and 2 buttons, But I'd also like to some when pressed on a plot (relative to the position of the plot of course), or zoom on location of the cursor or touch. Solved: http://jsfiddle.net/bx4wqtu4/20
    • Also on initial zoom my plots are not being updated and end up huge :( fixed: $.fn.mapael.defaultOptions.map.defaultArea.attrsHover = {}; $.fn.mapael.defaultOptions.map.defaultPlot.attrsHover = {}; $.fn.mapael.defaultOptions.map.defaultLink.attrsHover = {};
    opened by dnsBlah 23
  • Put Mapael through JSHint

    Put Mapael through JSHint

    It would be good if Mapael passes the JSHint verification.

    http://jshint.com

    I suggest the following permanent options:

    /* jshint jquery:true, unused:true */
    
    • jquery: defines globals exposed by the jQuery JavaScript library
    • unused: warns when a variable is defined and never used (note: this is set to true instead of strict to avoid warning about unused parameters in functions).

    The following globals needs to be declared:

    /* globals Raphael */
    /* globals exports, module, require */ // CommonJS
    /* globals define */ // AMD
    

    Also, in a first time, I suggest adding the following options to reduce the number of warnings:

    /* jshint laxcomma:true, laxbreak:true, expr:true */
    
    • laxcomma: suppresses warnings about comma-first coding style
    • laxbreak: suppresses most of the warnings about possibly unsafe line breakings in your code
    • expr: suppresses warnings about the use of expressions where normally you would expect to see assignments or function calls

    Number of warning remaining: 34 warnings

    There are a lot of Use '===' to compare with .... I think Mapael should indeed use the triple eq more often.

    opened by Indigo744 21
  • how get proper coordinates to new map

    how get proper coordinates to new map

    I am trying to make map of custom country (Tbilisi, georgia) with mapael. Everything is ok, but the plots. I cannot coordinate them properly with latitude and languitude. How can I do this? I tryed to do according to usa map but it don't work :( where and what I should put?

    saqartvelos_regionebi : { width : 844.8, height : 469.2, latLngToGrid: function(lat, lng, phi1, phi2, midLng, scale) { var pi =Math.PI , midLat = (phi1 + phi2) / 2 , n, tmp1, tmp2, tmp3, x, y, p;

                        n = (Math.sin(phi1 / 180 * pi) + Math.sin(phi2 / 180 * pi)) / 2;
                        tmp1 = Math.sqrt(Math.cos(phi1 / 180 * pi)) + 2 * n * Math.sin(phi1 / 180 * pi);
                        tmp2 = scale * Math.pow(tmp1 - 2 * n * Math.sin(midLat / 180 * pi),0.5) / n;
                        tmp3 = n * (lng - midLng);
                        p = scale * Math.pow(tmp1 - 2 * n * Math.sin(lat / 180 * pi),0.5) / n;
                        x = p * Math.sin(tmp3 / 180 * pi);
                        y = tmp2 - p * Math.cos(tmp3 / 180 * pi);
    
                        return([x,y]);
                    },
                    getCoords : function (lat, lon) {
                        var coords = {};
                        if(lat > 43.582132) { // alaska
    
                            // these are guesses
                            var phi1= 15; // standard parallels
                            var phi2= 105;
                            var midLng = 43.5;
                            var scale = 530;
                            coords = this.latLngToGrid(lat, lon, phi1, phi2, midLng, scale);
                            xOffset = 190;
                            yOffset = 543;
                            scaleX= 1;
                            scaleY= -1;
    
                        } else if (lon < 40) { // hawaii
                            // Lat: 18°?55' N to 28°?27' N, Lng:154°?48' W to 178°?22' W
                            // (225, 504) to (356, 588) on map
    
                            // these are guesses
                            var phi1= 0; // standard parallels
                            var phi2= 26;
                            var midLng = 42;
                            var scale = 1280;
                            coords = this.latLngToGrid(lat, lon, phi1, phi2, midLng, scale);
                            xOffset = 115;
                            yOffset = 723;
                            scaleX= 1;
                            scaleY= -1;
                        } else {
                            xOffset = -17;
                            yOffset = -22;
                            scaleX = 10.05;
                            scaleY = 6.26;
    
                            coords[0] = 50.0 + 124.03149777329222 * ((1.9694462586094064-(lat* Math.PI / 180)) * Math.sin(0.6010514667026994 * (lon + 96) * Math.PI / 180));
                            coords[1] = 50.0 + 1.6155950752393982 * 124.03149777329222 * 0.02613325650382181 - 1.6155950752393982* 124.03149777329222 * (1.3236744353715044- (1.9694462586094064-(lat* Math.PI / 180)) * Math.cos(0.6010514667026994 * (lon + 96) * Math.PI / 180));
                        }
                        return {x : (coords[0] * scaleX + xOffset), y : (coords[1] * scaleY + yOffset)};
                    },
    
    opened by mancho-ged 19
  • Question svp : zoom région puis départements

    Question svp : zoom région puis départements

    Bonjour

    D'abord un grand merci pour ce plugin ! Voici mon projet : une carte de France des régions, avec les plots des pref et sous pref. Au click sur une région, zoom et apparition des départements et des noms des villes de cette région, les autres régions deviennent invisibles. Dézoom et retour position initiale au click sur un département, callback au click sur une ville.

    Ce projet te parait-il réalisable avec Mapael ? Si oui quelles seraient les principales étapes stp ?

    Pour le moment j'ai juste monté une carte avec départements + régions (à partir des js que tu mets à dispo), mais les régions ne sont pas exactement superposées sur la carte des départements...

    Merci pour ton aide Bonnes fêtes !

    opened by julienchazal 18
  • Mapael plugin architecture enhancement

    Mapael plugin architecture enhancement

    Dear Neveldo,

    If I may, I would like to suggest some internal change about the plugin architecture.

    Right now, the plugins architecture, from top to bottom, is:

    • (some processing for lazy loading and such)
    • Creation of a function named Mapael:
      • accepts an Options parameters, and parse it
      • performs a huge processing on each elements targeted
    • Listing of Mapael internal function Mapael.xxx() used all along
    • Listing of default values Mapael.defaultOptions and so on
    • Assign $.fn.mapael to Mapael for jQuery

    The biggest problem here is the Mapael function, and the huge foreach processing inside of it.

    I would like to suggest to implements a slightly different architecture pattern: https://github.com/jquery-boilerplate/jquery-patterns/blob/master/patterns/jquery.basic.plugin-boilerplate.js The difference will not be so big actually. The main thing is that there will be an Init() function, and that we check against an already existing Mapael on the container.

    What do you think?

    opened by Indigo744 17
  • top (lat>85) and left (lon<-175) not visible

    top (lat>85) and left (lon<-175) not visible

    Thanks for that great plugin. I started to play around with Mapael and found that points plotted far left (approx. <-175) and at the top (approx. >85) are not visible (see figure, where less than the half of the large points is visible). Sure, I can change the viewBox of the svg like $(".map_container").find("svg").attr("viewBox", "-40 -30 1030 530"); which will solve this problem. But this introduces new problems, e.g. with the zoom. Thus I would like to ask if it is possible to have a full view of the map from -180 to 180 and -90 to 90? Thanks. mapael_boundary_test

    map 
    opened by hummingbird-dev 16
  • Bug: problems when creating a map inside display:none element

    Bug: problems when creating a map inside display:none element

    This has been reported several times by users: #72 and #63

    Here is a working example of the problem: http://jsfiddle.net/VqwUZ/361/ We hide the container, draw the map, then show the container. As a result, no text is visible on the legend, and the map is not set to the screen width (a resize of the window is needed to force redraw).

    This is related to Raphael issue DmitryBaranovskiy/raphael#760

    If you call getBBox() to get the bounding box of a text element when the whole Raphael element is hidden (e.g. if it is inside a <div> with display: none) then the properties of the returned object are all set to NaN rather than the actual bounding box values of the element.

    My solution was to avoid using display:none and prefer using this kind of class:

    .map_hide {
        /* display:none is doing some weird stuff on SVG
         * Solution: hide it, then position it far away
         */
        position:absolute !important;
        visibility: hidden !important;
        top:-1000px !important;
        left:-1000px !important; 
    }
    

    However, when using a CSS framework such as Bootstrap, you may not be able to change the behavior of certain element. I don't know what we can do.

    opened by Indigo744 16
  • Legend showing previous years data.

    Legend showing previous years data.

    So I am trying to build an interactive map using this as the basis for the project and I love the code. I am running into an issue however with the legend showing the previous years information if that area isn't defined. Is there any way to reset what the map is showing from the legend before it shows the next year?

    You can check out the project here. http://192.249.112.63/~uofimap/

    opened by TimHerbert 15
  • Clean the

    Clean the "update" event signature

    This is a ticket to talk about the event signature.

    In neveldo/jQuery-Mapael#85, you said you wanted to clean this signature. I agree it became quite complicated and an overhaul would be good. Before:

    $(".container").trigger('update', [updatedOptions, newPlots, deletedPlots, opt]);
    

    After:

    var options = {
      'mapOptions' : {}, // was updatedOptions
      'replace' : true/false // whether mapsOptions should entirely replace current map options, or just extend it,
      'newPlots' : {},
      'newLinks' : {},
      'deletedPlots: [],  // was opt.deletedPlots
      'deletedLinks' : [],  // was opt.deletedLinks
      'setLegendElemsState' => '...'  // was opt.setLegendElemsState
      'afterUpdate' => ...,  // was opt.afterUpdate
      'animDuration' : ...  // was opt.animDuration
    };
    $(".container").trigger('update', [options]);
    

    Several questions:

    • shall it be backward compatible ? I think not. It would be hard to maintain.
    • what happened to resetPlots/resetAreas ? Actually, I never quite understood their purpose...
    • deletedPlots and deletedLinks could better be called to reflect what it is. Like DeletePlotNames and DeleteLinkNames?
    opened by Indigo744 14
  • Strange viewbox size

    Strange viewbox size

    Hi,

    I am interested in Mapael and develop a website based on it.

    I created my own map using Inkscape. But the viewbox generated looks quite strange after extracting the path out and used with Mapael.

    A picture worth a thousand words. My map is put on this url http://116.226.62.120:40080/ It may take a moment to complete rendering of the page when you first open it.

    As you can see, the height of the map container is too large. I take the viewbox value given by Inkscape output as the width and height options of my map. If I manually change the height option in the javascript file to a lower value, the map is also truncated.

    Can you give me suggestions on how to reduce the height of the viewbox while at the same time keeping the entire paths of map to be visible?

    Feel free to comment if I didn't explain my issue well.

    opened by Vincent-Lyu 12
  • My Map is Coming upside down

    My Map is Coming upside down

    Before submitting a new issue, please search on the issue tracker first (https://github.com/neveldo/jQuery-Mapael/issues)

    Description

    I'm trying to add a map to my page with mapael, but it's always turned upside down, how can I fix it?

    • Mapael version: Version: 2.2.0
    • Browser Name and version: Chrome Lastest version unknown
    opened by MustafaaCetinn 0
  • French Guiana !== France

    French Guiana !== France

    Hello! I am working on a map for an organization, and had to plot some points onto French Guiana, and was surprised to see France light up for this country on hover. Had to guess and test some values from the world_countries template to splice out the bit that was just the country I needed. I was going off of this https://sustainablesources.com/resources/country-abbreviations/ for the data-id to target French Guiana (GF).

    Before submitting a new issue, please search on the issue tracker first (https://github.com/neveldo/jQuery-Mapael/issues)

    Description

    Target French Guiana (South America) without France (EU).

    Expected Behavior

    Hover nation, get just this nation hovered. Able to target it as well via the data-id as other nations are currently set up.

    Current Behavior

    Current behavior: both nations are sharing the same data-id.

    Suggested change: Two nations = two unique IDs.

    Environment

    • Mapael version: 2.2.0
    • Raphael version:
    • Browser Name and version:
    • Operating System and version (desktop or mobile):
    opened by the-tiggles 0
  • mobile hover problem

    mobile hover problem

    hey, i want to create a map with clickable areas and if i click one area its get dyed red and on desktop the hover is darkred. so far so good when i click the next area the first area should get back to his standart(blue and hover dark blue). on desktop is everything ok but on mobile there i have a little problem after first click the area gets darkred and after the second click the firtst area gets red (not blue again) and the second area gets dark red. the problem is fixed if i click after the first click anywhere else and then click the second area but this is not the way to go

    ` var newData = { 'areas': {}, 'plots': {} };

    if (mapElem.attrs.fill == blue || mapElem.attrs.fill == blue_dark) { // go through all areas and dye them blue for (area in point_area) { newData.areas[area] = { attrs: { fill: blue }, attrsHover: { fill: blue_dark, }, }; newData.plots[point_area[area]] = { attrs: { fill: red }, attrsHover: { stroke: "#FFF" }, }; } //dye the clicked area red newData.areas[id] = { attrs: { fill: red }, attrsHover: { fill: red_dark }, }; newData.plots[point_area[id]] = { attrs: { fill: "#FFF" }, attrsHover: { stroke: red }, }; } // if the area is not blue else { for (area in point_area) { newData.areas[area] = { attrs: { fill: blue }, attrsHover: { fill: blue_dark, }, }; newData.plots[point_area[area]] = { attrs: { fill: red }, attrsHover: { stroke: "#FFF" }, }; } } $(".mapcontainer").trigger('update', [{ mapOptions: newData }]); `

    opened by MrTilllus 0
  • zoom in mousewheele

    zoom in mousewheele

    Hey, i just initiated an init zoom and its working normal but i cant zoom in and only zoom out if i scroll i the other direction its scrolls out too.

    $("#mapcointainer").mapael({ map: { name: "...", zoom: { enabled: true, maxLevel: 15, minLevel: 3, init: { latitude: 49.03486046659013, longitude: 8.710460096762555, level: 10 } }, }

    opened by MrTilllus 0
  • Overflow in horizontal legends

    Overflow in horizontal legends

    Description

    If the splices for the legend increases, the ones at the end gets hidden

    Expected Behavior

    It should come to next line

    Current Behavior

    image

    Environment

    Chrome

    • Mapael version: Latest
    • Raphael version: Latest
    • Browser Name and version: Chrome
    • Operating System and version (desktop or mobile): Win10
    opened by pinakipatrapro 0
Releases(2.2.0)
  • 2.2.0(Mar 8, 2018)

    ChangeLog

    Change log for jQuery-Mapael 2.2.0

    • Feature : Added the ability to zoom on a specific plot or a specific area through the zoom event (Indigo744)
    • Feature : The cssClass option can now be updated when trigerring an 'update' event (Indigo744)
    • Feature : Added links to the parameter of the afterUpdate hook (Indigo744)
    • Performance : Optimised overall Zoom performances (Indigo744)
    • Performance: use event delegation (Indigo744)
    • Improvement : Provide a better version of the map of the World (neveldo)
    • Improvement : Better dependencies / installation instructions (Indigo744)
    • Improvement : Mapael version is now accessible through $.mapael.version (Indigo744)
    • Bugfix : Fixed behaviour of the 'clicked' legend option with plots (Indigo744)
    • Bugfix : Fixed the update event when plotsOn option used (Licht-T & Indigo744)
    Source code(tar.gz)
    Source code(zip)
  • 2.1.0(Mar 13, 2017)

    ChangeLog

    • Feature : Allow to add custom CSS class to areas, plotted points and links (neveldo)
    • Bugfix : Fix load for CommonJS (neveldo)
    • Bugfix : Restaure 'mousewheel' event propagation (neveldo)
    • Bugfix : Fix elements hidding through clicks on legend items when some values are straddling two different slices in hideMapElems() function (neveldo)
    • Bugfix : Prevent to move the clicked element instead of dragging the map (behaviour seen with Firefox) (neveldo)
    • Bugfix : Fix destroy() in order to empty map and legends containers instead of the main container (neveldo)
    • Feature : Add toFront option available on area/plot/link options when triggering (neveldo)
    • Feature : Add redrawOnResize option (neveldo)
    • Improve updateElem() performance (neveldo)
    • Bugfix : Fix namespaces for events bindings (neveldo)
    • Feature : Added plotsOn option to add points on areas' centers (Licht-T)
    • Bugfix : Fix Western Sahara's code in world map (dragoscirjan)
    Source code(tar.gz)
    Source code(zip)
  • 2.0.0(Jun 12, 2016)

    ChangeLog

    • Feature : Update jQuery to v3.0.0 and Raphael.js to v2.2.0 (neveldo)
    • Feature : Add tooltip.offset.left and tooltip.offset.top options to set a custom offset between the cursor and the tooltip (neveldo)
    • Bugfix : Prevent from updating unneeded areas, plots and links in the 'update' event (neveldo)
    • Feature : Allow transformations on SVG plotted points (neveldo)
    • Bugfix : Fix updateElem() function for SVG elements (bbox object undefined) (neveldo)
    • Feature : Add new minLevel option (billyrennekamp)
    • Bugfix : Fix the flicker on mouseover between text and area (billyrennekamp)
    • Feature : margin option now accept an object in order to fine tune x and y offset of text position (neveldo)
    • Bugfix : initElem : setHover only if attrsHover set (Indigo744)
    • Feature : Allow zoom trigger with no level set (Indigo744)
    • Feature : Relative zoom for onZoom (Indigo744)
    • Misc : Add Mercator and Miller world map (Indigo744)
    • Feature : Legends are redrawn on resize (Indigo744)
    • Feature : Expand zoom buttons functionality (Indigo744)
    • Feature : Add checkForRaphaelBBoxBug() function in order to check for a known bug from Raphael.js when creating a paper in an hidden container (Indigo744)
    • Feature : Add 'showElementsInRange' event to filter the elements to show on the map depending on values intervals (Indigo744)
    • Refactoring : Move default options inside prototype to allow overriding (Indigo744)
    • Refactoring : Refactored internal structure of the plugin (Indigo744)
    • Misc : Add many new code examples (Indigo744)
    • Misc : Add unit tests (Indigo744)
    • Refactoring : Provide new update event signature (Indigo744)
    • Bugfix : Fix leaking when removing plots/links (Indigo744)
    • Feature : tooltip.content accept function (Indigo744)
    • Bugfix : handleClickOnLegendElem take into account other legends (Indigo744)
    • Bugfix : Set default size when no size is set on slices (Indigo744)
    • Bugfix : Fix target for zoom related events 'mousewheel', 'touchstart' and 'touchmove' (neveldo)
    • Feature : Delete all plots/links in 'update' event (Indigo744)
    • Refactoring : Set legend slice max value inclusive (Indigo744)
    • Bugfix : hide/show elements only on current map (Indigo744)
    • Feature : Allow to update legend in the update event (Indigo744)
    • Feature : Add AMD and CommonJS compatibility to mapael and mapel maps (neveldo)
    • Feature : Add animDuration option to 'zoom' event and set it to 0 by default for initial zoom (neveldo)
    • Refactoring : Remove map.tooltip.target option (neveldo)
    • Feature : Add tooltip.overflow.right and tooltip.overflow.bottom options to allow tooltip overflow from the container (neveldo)
    • Bugfix : Fix raphael.safari() call with laster version of Raphael.js (Indigo744)
    • Bugfix : Fix legend display when no title is defined (Indigo744)
    • Refactoring : Tooltip position is computed as absolute instead of Fix (Indigo744)
    • Bugfix : Fix IE8 js error on map update (Indigo744)
    • Feature : Add legend.(area|plot).hideElemsOnClick.animDuration option (Indigo744)
    • Bugfix : Fix current zoomX and zommY values set in container’ data. (neveldo)
    Source code(tar.gz)
    Source code(zip)
  • 1.1.0(Aug 31, 2015)

    ChangeLog

    New features

    • Added support for animated zoom through the new option map.zoom.animDuration (200 by default, set to 0 in order to disable it). The option map.zoom.animEasing allows to set the easing function to animate the zoom action
    • Panning is now allowed through touch event (it can be disabled through the option map.zoom.touch)
    • Zooming is now allowed through pinch touch event (it can also be disabled through the option map.zoom.touch)
    • In addition to 'circle', 'square' and 'image' plotted point types, the new 'svg' type allows to add SVG paths on the map
    • Links can now be updated through the 'update' event : they can be edited or deleted and new links can be added to the map
    • New legend.exclusive option allows the user to activate only one item from the legend at a time
    • New ‘clicked’ option in order to initialize the legend item in the 'clicked' state on the map load
    • Added hook 'beforeInit' hook that is called right after the initialization of the areas
    • New map.tooltip.target option allows to specify a container where to append the tooltip div
    • The new option 'cssClass' allows to set additional CSS class(es) the tooltip for a specific area or a plotted point
    • Added events afterZoom and ‘afterPanning’

    Bugfixes & other

    • Upgraded Raphael.js dependency to v2.1.4
    • Fixed horizontal legend display with squares
    • Fixed tooltip position
    Source code(tar.gz)
    Source code(zip)
  • 1.0.1(May 17, 2015)

  • 1.0.0(Jan 4, 2015)

    New features

    • You can now add curved links between two cities, between two points defined by a latitude and a longitude, or between two points defined by a x and y coordinates
    • jQuery Mapael now handles multiple criteria legends. Each point or each area can be associated with one or several values
    • You can use non-vector images in order to plot locations on your map.Moreover, non-vector images can be used in the legends
    • The legend can be displayed horizontally or vertically
    • The jQuery mousewheel is now fully integrated with jQuery mapael and zoom on mousewheel features have been improved. Zoom is now focused on the cursor position
    • The target of each link on the map can be specified
    • You can define each slice of a legend with a single value or with a minimum and a maximum values
    • You can display a map with an initial zoom level that is focused on a particular location
    • Dependencies are now included through Bower packages manager.
    • Mapael allows users to set specific attributes for the elements in the legend independently from the attributes for the matching elements on the map
    • A new tutorial that explain how to create a map for jQuery Mapael is now available. It comes with some useful online tools.

    Changes that are not compatible with the version 0.7.1

    • If you have overloaded $.fn.mapael.defaultOptions, note that the default Mapael options (previously stored in $.fn.mapael.defaultOptions) are now stored in two different variables : $.fn.mapael.defaultOptions and $.fn.mapael.legendDefaultOptions . The last one is specific to legends options.
    • Legends 'display' option is now set to true by default instead of false
    Source code(tar.gz)
    Source code(zip)
  • 0.7.1(Jan 23, 2014)

    ChangeLog

    Bugfixes

    • Fixed legend colorisation with zero values in slices definition
    • Don't animate areas and plots in the legend on mouse hover
    • afterUpdate call : fixed undefined opt
    Source code(tar.gz)
    Source code(zip)
  • 0.7.0(Nov 17, 2013)

    ChangeLog

    Improvements

    • Improved zooming feature. You can now trigger a 'zoom' event on the container (required parameter : level, optional parameters : x, y in order to zoom on a specific area). The current zoom level is now stored as data. Example of use : http://jsfiddle.net/neveldo/RahvT/
    • Added two new hooks in order to allow custom processing on map initialization and map update ('update' event) : afterInit and afterUpdate. Here is an example with the afterInit() hook : http://jsfiddle.net/neveldo/8Ke69/
    • Added labelAttrsHover option for the plots and areas legend that allows to customize the attributes of the labels in the legend on mouse hover.
    • prevent the tooltip to overflow from the container
    • 'update' event' now allows to update attrsHover for plots and area (bugfix)
    Source code(tar.gz)
    Source code(zip)
  • 0.6.0(Sep 29, 2013)

    ChangeLog

    Improvements

    • Added missing Michigan state on the USA map
    • New map of France with equirectangular projection for better cities location
    • Upgraded to version 2.1.2 of Raphael.js
    • Truely hide the elements when user clicks on the legend and hideElems.OnClick.opacity is set to 0
    • Squares and circles in the legend take account the scale of the map in order to draw them at the same scale
    • Newattribute 'data-id' added to plots and areas's nodes
    • New option 'display' that allows to display or hide a specific element from the legend
    • Improved event handling (with the new option 'eventHandlers'). You can now attach handlers to all events from jQuery.
    • Improved 'update' event that now allows to add or delete plot from the map, update text attributes (content, position, ...) and the contents of the tooltips
    • New option text.margin that allows to customize the margin between the plot and its associated label
    • Miscellaneous bug fixes

    Incompatible changes with 0.5.1

    • Event handlers for plots and areas (previously set by options 'onclick', 'onmouseover' and 'onmouseout') now have to be defined with the option 'eventHandlers'. It contains the list of handlers (function(e, id, mapElem, textElem) { ...}) that will be called when events occur on elements. The key must match the event name (example : 'click', 'dblclick', ...). See documentation and examples for more information.
    • Parameters for the update event are now the followings : updatedOptions, newPlots, deletedPlots, and opt. Example : $(".container").trigger('update', [updatedOptions, newPlots, deletedPlots, opt]);. See documentation and examples for more information.
    • The options for the texts (previously text, textAttrs, textHoverAttrs and textPosition) are now the followings : text.content, text.attrs, text.attrsHover and text.position. See documentation and examples for more information.
    Source code(tar.gz)
    Source code(zip)
Owner
Vincent Brouté
Web engineer @ Groupe Figaro CCM Benchmark - Interested in web development, opendata, linkeddata, statistical learning and dataviz.
Vincent Brouté
jQuery plugin that blows your visitors' retinas

Dense.js Homepage | Issues | Dense is a jQuery plugin for serving retina-ready, high pixel ratio images with ease. Small, ease-to-adapt, yet very cust

Jukka Svahn 212 Jun 30, 2022
A jQuery plugin that displays a thumbnail grid expanding preview similar to the effect seen on Google Images.

jQuery GRIDDER 1.4.2 ======= A jQuery plugin that displays a thumbnail grid expanding preview similar to the effect seen on Google Images. We have all

Orion Gunning 455 Nov 6, 2022
jQuery plugin that makes an image erasable (with mouse or touch movements)

jQuery.eraser v0.5.2 a jQuery plugin that makes an image erasable (with mouse or touch movements) This plugin replaces the targeted image by an intera

boblemarin 327 Oct 27, 2022
A jquery plugin for comparing two images

jQuery Images Compare A jquery plugin for comparing two images Badges Features compatibility : ie9+ Effort to put appearance via css (easier to skin /

Sylvain Combes 49 Sep 5, 2022
Unite Gallery - Responsive jQuery Image and Video Gallery Plugin. Aim to be the best gallery on the web on it's kind. See demo here:

##Unite Gallery - Responsive jQuery Gallery Plugin Product Link: unitegallery.net This gallery has commercial versions for: WordPress , Joomla! , Pres

Max Valiano 531 Oct 24, 2022
jQuery plugin for 'responsive cropping'. Dynamically crop images to fill available space without cutting out the image's subject. Great for full-screen images.

jQuery plugin for 'responsive cropping'. Dynamically crop images to fill available space without cutting out the image's subject. Great for full-screen images.

Jono Menz 3.2k Dec 30, 2022
⚠️ [Deprecated] No longer maintained, please use https://github.com/fengyuanchen/jquery-cropper

Cropper A simple jQuery image cropping plugin. As of v4.0.0, the core code of Cropper is replaced with Cropper.js. Demo Cropper.js - JavaScript image

Fengyuan Chen 7.8k Dec 27, 2022
Nivo Slider - The Most Awesome jQuery Image Slider

Maintainer's Wanted! - Ineterested in contributing regularly to Nivo Slider development? Get in touch Nivo Slider The Nivo Slider is world renowned as

Verti Studio 1.2k Dec 24, 2022
DEPRECATED jQuery Responsive Carousel.

YEAH SO THIS IS PRETTY MUCH DEAD, DO YOURSELF A FAVOR AND SWITCH TO tiny-slider Owl Carousel 2 Touch enabled jQuery plugin that lets you create a beau

null 7.7k Jan 4, 2023
⚠️ [Deprecated] No longer maintained, please use https://github.com/fengyuanchen/jquery-viewer

Viewer A simple jQuery image viewing plugin. As of v1.0.0, the core code of Viewer is replaced with Viewer.js. Demo Viewer.js - JavaScript image viewe

Fengyuan Chen 1k Dec 19, 2022
🌅 Content-aware image resizer based on Seam Carving algorithm

Content-aware image resizing might be applied when it comes to changing the image proportions (i.e. reducing the width while keeping the height) and when losing some parts of the image is not desirable.

Oleksii Trekhleb 1.4k Dec 30, 2022
JavaScript library for object-based canvas drawing

oCanvas - Object-based canvas drawing oCanvas makes canvas development easier to understand and do, by creating a bridge between the native pixel draw

Johannes Koggdal 483 Jan 4, 2023
A light wight javascript image viewing plugin with smooth animation and 0 dependence

A light wight javascript image viewing plugin with smooth animation and 0 dependence

null 50 Nov 12, 2022
the last carousel you'll ever need

slick the last carousel you'll ever need Demo http://kenwheeler.github.io/slick CDN To start working with Slick right away, there's a couple of CDN ch

Ken Wheeler 27.8k Dec 27, 2022
Codecs lets you use read, write, edit, and analyze images.

Codecs Codecs lets you use read, write, edit, and analyze images. npm install @astropub/codecs Usage import * as fs from 'node:fs/promises' import * a

Astro Community 8 Oct 10, 2022
JustGage is a handy JavaScript plugin for generating and animating nice & clean dashboard gauges. It is based on Raphaël library for vector drawing.

JustGage JustGage is a handy JavaScript plugin for generating and animating nice & clean dashboard gauges. It is based on Raphaël library for vector d

Bojan Djuricic 1.8k Jan 3, 2023
Interactive, thoroughly customizable maps in the browser, powered by vector tiles and WebGL

Mapbox GL JS is a JavaScript library for interactive, customizable vector maps on the web. It takes map styles that conform to the Mapbox Style Specif

Mapbox 9.4k Jan 7, 2023
Charts for Raphaël

g.Raphaël - Official charting plugin for Raphaël For more information, see: http://g.raphaeljs.com/ Changelog v0.51 Fixed issues with piechart related

Dmitry Baranovskiy 1.5k Dec 31, 2022
Shopping Cart - Project of HTML, CSS, and JavaScript developed by me (Raphael Martins) at the end of the Unit 9 Module 1 of the Web Development course at Trybe

Project of HTML, CSS, and JavaScript developed by me (Raphael Martins) at the end of the Unit 9 Module 1 of the Web Development course at Trybe. I was approved with 100% of the mandatory and optional requirements met.

Raphael Martins 13 Nov 27, 2022
A public board for all the Computer Society and Students to display their profile. An online year-book for you to display your profile in the most creative manner

Student's Yearbook by IEEE Computer Society Student's yearbook is an open-source project which intends to dispaly the students who will be graduating

IEEE Computer Society 11 Dec 18, 2022