Chart.js Choropleth and Bubble Maps

Overview

Chart.js Geo

NPM Package Github Actions

Chart.js module for charting maps with legends. Adding new chart types: choropleth and bubbleMap.

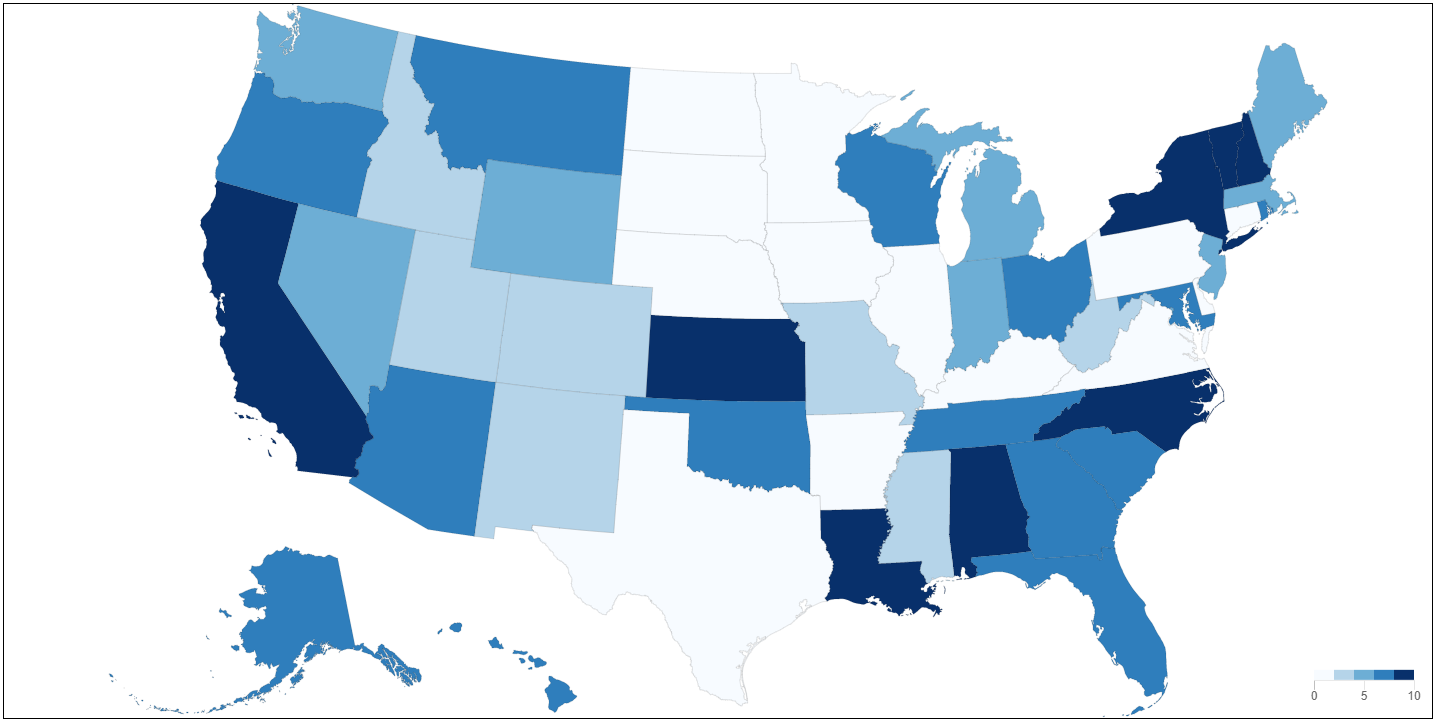
Choropleth

Open in CodePen

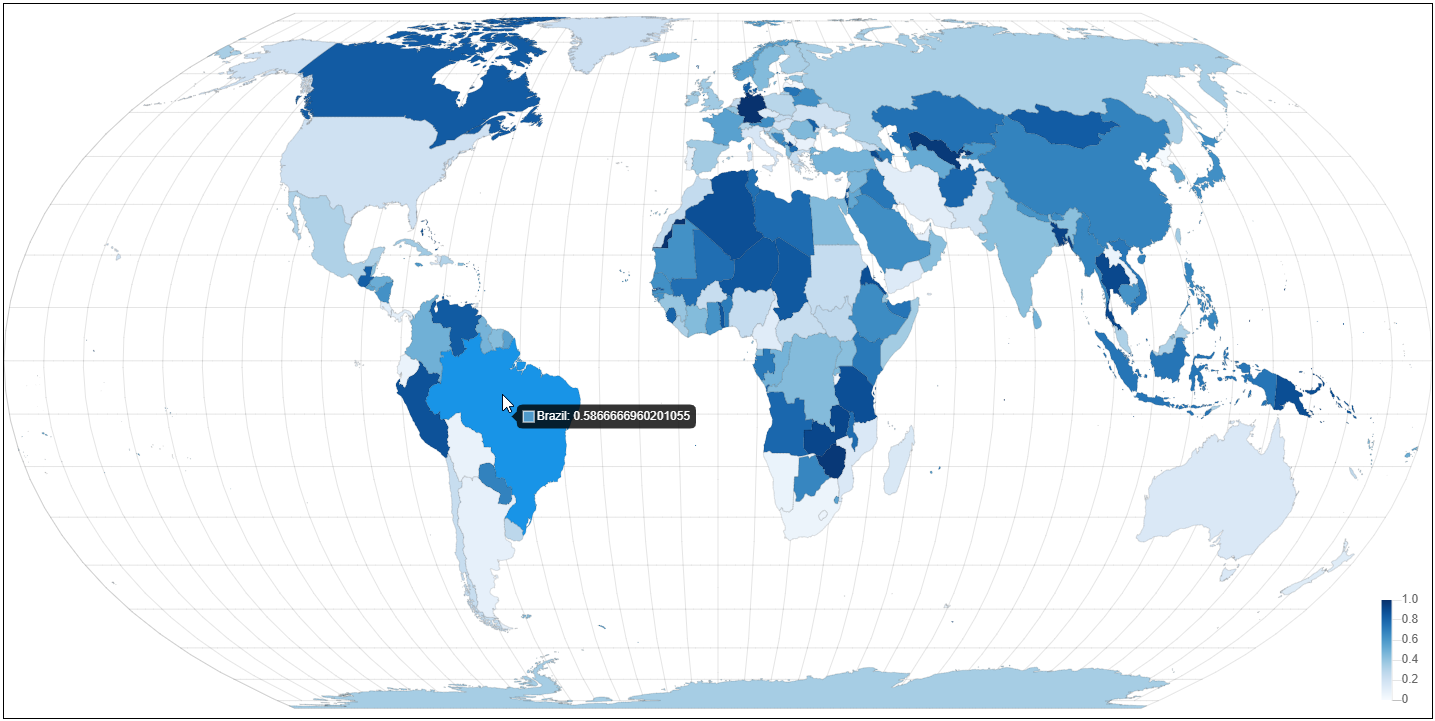
Earth Choropleth

Open in CodePen

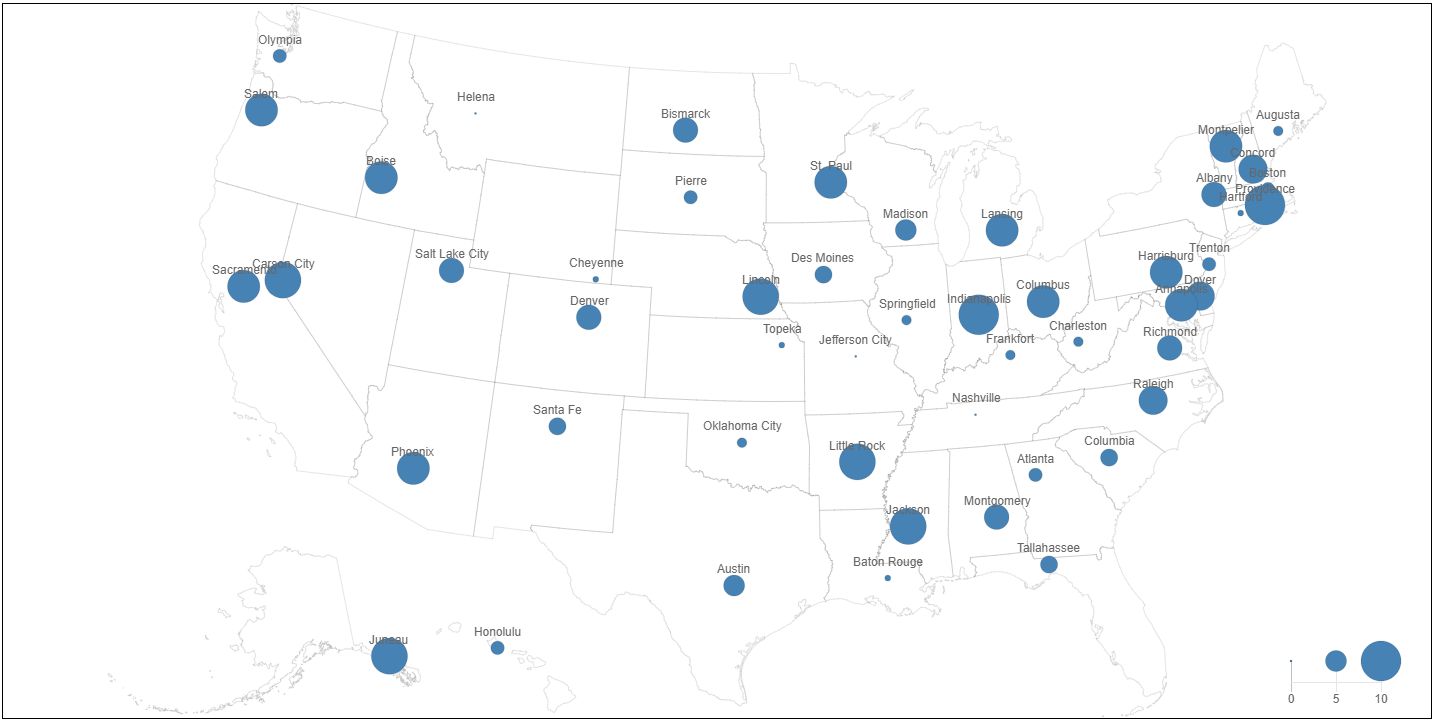
Bubble Map

Open in CodePen

works great with https://github.com/chartjs/chartjs-plugin-datalabels

Related Plugins

Check out also my other chart.js plugins:

Install

npm install --save chart.js chartjs-chart-geo

Usage

see Samples on Github

CodePens

Options

The option can be set globally or per dataset

see https://github.com/sgratzl/chartjs-chart-geo/blob/main/src/controllers/GeoController.ts#L221

Choropleth

A Choropleth (chart type: choropleth) is used to render maps with the area filled according to some numerical value.

Choropleth

Open in CodePen

Earth Choropleth

Open in CodePen

Data Structure

A data point has to have a .feature property containing the feature to render and a .value property containing the value for the coloring.

TopoJson is packaged with this plugin to convert data, it is exposed as ChartGeo.topojson in the global context. However, this plugin doesn't include any topojson files itself. Some useful resources I found so far:

const us = await fetch('https://unpkg.com/us-atlas/states-10m.json').then((r) => r.json());

// whole US for the outline
const nation = ChartGeo.topojson.feature(us, us.objects.nation).features[0];
// individual states
const states = ChartGeo.topojson.feature(us, us.objects.states).features;

const alaska = states.find((d) => d.properties.name === 'Alaska');
const california = states.find((d) => d.properties.name === 'California');
...

const config = {
  data: {
    labels: ['Alaska', 'California'],
    datasets: [{
      label: 'States',
      outline: nation, // ... outline to compute bounds
      showOutline: true,
      data: [
        {
          value: 0.4,
          feature: alaska // ... the feature to render
        },
        {
          value: 0.3,
          feature: california
        }
      ]
    }]
  },
  options: {
    scales: {
      xy: {
        projection: 'albersUsa' // ... projection method
      }
    }
  }
};

Styling

The styling of the new element GeoFeature is based on Bar Element with some additional options for the outline and graticule.

see https://github.com/sgratzl/chartjs-chart-geo/blob/main/src/elements/GeoFeature.ts#L41

Legend and Color Scale

The coloring of the nodes will be done with a special color scale. The scale itself is based on a linear scale.

see

Bubble Map

A Bubble Map (chart type: bubbleMap) aka Proportional Symbol is used to render maps with dots that are scaled according to some numerical value. It is based on a regular bubble chart where the positioning is done using latitude and longitude with an additional sizeScale to create a legend for the different radi.

Bubble Map

Open in CodePen

Data Structure

see Bubble Chart. Alternatively to x and y, the following structure can be used:

interface IBubbleMapPoint {
  longitude: number;
  latitude: number;
  value: number;
}

Note: instead of using the r attribute as in a regular bubble chart, the value attribute is used, which is picked up by the sizeScale to convert it to an actual pixel radius value.

Styling

A regular point is used and thus supports the Point Element styling options. In addition, the outline* and graticule* are supported.

Legend

Similar to the choropleth chart a new sizeScale is used to map the values to symbol radius size. The scale itself is based on a linear scale.

see

Scales

A new scale projection is registered and used by default by Choropleth and BubbleMap. The available methods are the one from https://github.com/d3/d3-geo#projections. Just remove the geo prefix. Alternatively, the projection method instance can be directly given.

see https://github.com/sgratzl/chartjs-chart-geo/blob/main/src/scales/ProjectionScale.ts#L76

ESM and Tree Shaking

The ESM build of the library supports tree shaking thus having no side effects. As a consequence the chart.js library won't be automatically manipulated nor new controllers automatically registered. One has to manually import and register them.

Variant A:

import { Chart } from 'chart.js';
import { ChoroplethController } from 'chartjs-chart-geo';

// register controller in chart.js and ensure the defaults are set
ChoroplethController.register();

const chart = new Chart(document.getElementById('canvas').getContext('2d'), {
  type: ChoroplethController.id,
  data: {
    // ...
  },
});

Variant B:

import { ChoroplethChart } from 'chartjs-chart-geo';

const chart = new ChoroplethChart(document.getElementById('canvas').getContext('2d'), {
  data: {
    //...
  },
});

Development Environment

npm i -g yarn
yarn install
yarn sdks vscode

Common commands

yarn compile
yarn test
yarn lint
yarn fix
yarn build
yarn docs
Comments
  • Map border blurry

    Map border blurry

    Hi,

    I run the same topojson with the same data with D3 and with your plugin and the only difference I have is on the borders that are blurry.

    In the plugin: image

    With D3: image

    Do you know what can cause this?

    I tried the border with option but it is not that. It seems that the "state" border are rendered twice and that may cause it to be blurry.

    Thanks,

    question answered 
    opened by elvince 14
  • Question: Bundling map with the package

    Question: Bundling map with the package

    Hey! Another quick one for you, are we able to use this package without having to make any external API calls? Ala fetch('https://unpkg.com/world-atlas/countries-50m.json').then((r) => r.json())

    Or is my only solution to manually inline this JSON into my Javascript (in my case into a Vue component)?

    question 
    opened by theianjohnson 11
  • Unable to hide map scale

    Unable to hide map scale

    Hi

    Referencing https://github.com/sgratzl/chartjs-chart-geo/issues/61 and https://github.com/sgratzl/chartjs-chart-geo/blob/17132af15391fe3e7f2454ac49d8743b5a25abdc/samples/albersLegend.html#L44-L49

    We want to hide the map scale completely. However the options to hide the scale do not work.

    Version 3.8.1 Angular 14.0.5

    Our current map. Showing the area in red that we expect to hide:

    Screenshot 2022-08-15 at 11 53 42 PM

    Chart Options: { scales: { xy: { projection: 'equalEarth', }, color: { display: false, }, }, plugins: { legend: { display: false, }, tooltip: { enabled: true, }, }, };

    Thanks!

    question answered 
    opened by lee-wilkins 10
  • Choropleth chart capabilities

    Choropleth chart capabilities

    Good afternoon! Could you provide advice on the capabilities of your choropleth chart for displaying maps.

    1. Is it possible to customize the format of the popup hint text? For example:
    • is it possible to change the order of the information in it - first the value, and then the name of the region;
    • is it possible to print part of the text in bold.
    1. Is it possible to specify the boundaries of the intervals on the basis of which the map is colored? Or is the formation of interval boundaries embedded in the algorithm and is not subject to configuration by an application programmer?
    2. Is it possible to display the capitals of the regions in the form of small round markers? We attach an example of a map for understanding.
    3. Is it possible to export the map to png and pdf formats? We are grateful in advance for the answers. Example
    question answered 
    opened by it-limon 9
  • Which loader do I need?

    Which loader do I need?

    I'm getting:

    WebpackError at /search/
                ModuleParseError in 
                Module parse failed: Unexpected token (6093:36)
    You may need an appropriate loader to handle this file type, currently no loaders are configured to process this file. See https://webpack.js.org/concepts#loaders
    | 	        }
    | 	        if (this.showOutline()) {
    > 	            this.getMeta().dataset?.draw(chart.ctx);
    | 	        }
    | 	        if (clipMap === true || clipMap === 'graticule' || clipMap === 'outline+graticule') {
    

    Context I am running webpack 4.44.2 with:

        "babel-cli": "^6.5.0",
        "babel-core": "^6.5.0",
        "babel-loader": "^7.1.5",
        "babel-plugin-transform-runtime": "^6.5.0",
        "babel-polyfill": "^6.5.0",
        "babel-preset-es2015": "^6.5.0",
        "babel-preset-react": "^6.5.0",
        "babel-preset-stage-1": "^6.5.0",
        "babel-preset-stage-2": "^6.5.0",
        "babel-runtime": "^6.5.0",
    

    I figure that babel is outdated. But it's a legacy app and I had trouble upgrading babel to 7 and babel-loader 8. So, I reverted those. Is it possible to fix this error without upgrading babel and the loader?

    Also, it would be helpful if it's possible to throw an example how to integrate this plugin in webpack? I couldn't find that in the examples in this repo.

    Thanks!

    question 
    opened by bnisevic 9
  • Problem with colorscale

    Problem with colorscale

    I'm having a problem with the colorscale. The colorscale doesn't show. I used it like this:

    const chart = new Chart(document.getElementById("map").getContext("2d"), {
            type: 'choropleth',
            data: {
              labels: distritosPT.map((d) => d.properties.name),
              datasets: [{
                label: 'Distritos',
                outline: distritos2,
                backgroundColor: (context) => {
                  if (context.dataIndex == null) {
                    return null;
                  }
    
                  const value = context.dataset.data[context.dataIndex];
                  return new Color('#78C2AD').blackness(value.value * 100).rgbString();
                },
                  //data: distritos2.map((d) => ({feature: d, value: dict[d.properties.name]})),
                  data: distritosPT.map((d) => ({feature: d, value: orgValues(d.properties.name)})),
              }]
            },
            options: {
              showOutline: true,
              legend: {
                display: false
              },
              scale: {
                projection: 'mercator'
              },
              **geo: {
                colorScale: {
                  display: true,
                  position: 'top',
                  quantize: 10,
                  legend: {
                    position: 'top-right',
                  },
                },
              },**
              tooltips: {
                callbacks: {
                    afterLabel: function(tooltipItem, data) {
                      var distrito = data['labels'][tooltipItem['index']];
                      return "Union Organizations: " + dict[distrito];
                    }
                }
              }
            }
          });
    

    Hope you can help me.

    Thank you. map

    question 
    opened by jmrMachado 9
  • Error [ERR_REQUIRE_ESM]: Must use import to load ES Module

    Error [ERR_REQUIRE_ESM]: Must use import to load ES Module

    When I use this library in the Next.js for bubbleMap, there is building issue. Error [ERR_REQUIRE_ESM]: Must use import to load ES Module: /Users/.../[project]/node_modules/d3-geo/src/index.js require() of ES modules is not supported. require() of /Users/.../[project]/node_modules/d3-geo/src/index.js from /Users/.../[project]/node_modules/chartjs-chart-geo/build/index.cjs is an ES module file as it is a .js file whose nearest parent package.json contains "type": "module" which defines all .js files in that package scope as ES modules. Instead rename index.js to end in .cjs, change the requiring code to use import(), or remove "type": "module" from /Users/.../[project]/node_modules/d3-geo/package.json.

    bug 
    opened by braveheart-star 8
  • How to use custom projection?

    How to use custom projection?

    Hi,

    I spent many hours trying to create a projection that works out of the one you provided.

    I wanted to use: https://github.com/seeschloss/francedom but I think it was made for an old version of D3.

    So I found this one that can serve as a example: https://github.com/rveciana/d3-composite-projections

    If I use this package, set the projection to geoAlbersUSA in your sample, I can't get it work. It claims that "fitwidth" is not a function.

    I hope you can help me to use your plug-in. Thanks,

    question 
    opened by elvince 8
  • Can't set geoFeature on Elements in Option

    Can't set geoFeature on Elements in Option

    In typescript, when I'm trying to set the styling, I have this issue:

    **Object literal may only specify known properties, and 'geoFeature' does not exist in type '_DeepPartialObject<ElementOptionsByType<"choropleth">>'. The expected type comes from property 'elements' which is declared here on type '_DeepPartialObject<CoreChartOptions<"choropleth"> & ElementChartOptions<"choropleth"> & PluginChartOptions<"choropleth"> & DatasetChartOptions<...> & ScaleChartOptions<...> & IGeoChartOptions>' **

    There is no issue in the sample codePen if I add elements:{ geoFeature: { borderColor: "#686868", //backgroundColor: "#00FF00" }, },

    Any Idea why typescript is complaining?

    Thanks for your help

    bug 
    opened by elvince 7
  • Zoom plugin supported

    Zoom plugin supported

    Is it possible to use the following plugin with this library

    https://github.com/chartjs/chartjs-plugin-zoom

    I managed to create a map but when I try and use the plugin to add zoom to my map, it doesn't work

    See codepen here https://codepen.io/damienderoiste/pen/ZEOzjKO

    question wontfix 
    opened by damienderoistecso 7
  • choropleth and bubbleMap at the same time?

    choropleth and bubbleMap at the same time?

    Hi, It seems that it will not be possible to have choropleth and bubbles at the same time as both are represented by its own chart type, right? Is there something I'm missing? Is this something you plan to add for the future? Many thanks!

    question 
    opened by gihco 7
  • build(deps): bump json5 from 1.0.1 to 1.0.2

    build(deps): bump json5 from 1.0.1 to 1.0.2

    Bumps json5 from 1.0.1 to 1.0.2.

    Release notes

    Sourced from json5's releases.

    v1.0.2

    • Fix: Properties with the name __proto__ are added to objects and arrays. (#199) This also fixes a prototype pollution vulnerability reported by Jonathan Gregson! (#295). This has been backported to v1. (#298)
    Changelog

    Sourced from json5's changelog.

    Unreleased [code, diff]

    v2.2.3 [code, diff]

    v2.2.2 [code, diff]

    • Fix: Properties with the name __proto__ are added to objects and arrays. (#199) This also fixes a prototype pollution vulnerability reported by Jonathan Gregson! (#295).

    v2.2.1 [code, diff]

    • Fix: Removed dependence on minimist to patch CVE-2021-44906. (#266)

    v2.2.0 [code, diff]

    • New: Accurate and documented TypeScript declarations are now included. There is no need to install @types/json5. (#236, #244)

    v2.1.3 [code, diff]

    • Fix: An out of memory bug when parsing numbers has been fixed. (#228, #229)

    v2.1.2 [code, diff]

    ... (truncated)

    Commits

    Dependabot compatibility score

    Dependabot will resolve any conflicts with this PR as long as you don't alter it yourself. You can also trigger a rebase manually by commenting @dependabot rebase.


    Dependabot commands and options

    You can trigger Dependabot actions by commenting on this PR:

    • @dependabot rebase will rebase this PR
    • @dependabot recreate will recreate this PR, overwriting any edits that have been made to it
    • @dependabot merge will merge this PR after your CI passes on it
    • @dependabot squash and merge will squash and merge this PR after your CI passes on it
    • @dependabot cancel merge will cancel a previously requested merge and block automerging
    • @dependabot reopen will reopen this PR if it is closed
    • @dependabot close will close this PR and stop Dependabot recreating it. You can achieve the same result by closing it manually
    • @dependabot ignore this major version will close this PR and stop Dependabot creating any more for this major version (unless you reopen the PR or upgrade to it yourself)
    • @dependabot ignore this minor version will close this PR and stop Dependabot creating any more for this minor version (unless you reopen the PR or upgrade to it yourself)
    • @dependabot ignore this dependency will close this PR and stop Dependabot creating any more for this dependency (unless you reopen the PR or upgrade to it yourself)
    • @dependabot use these labels will set the current labels as the default for future PRs for this repo and language
    • @dependabot use these reviewers will set the current reviewers as the default for future PRs for this repo and language
    • @dependabot use these assignees will set the current assignees as the default for future PRs for this repo and language
    • @dependabot use this milestone will set the current milestone as the default for future PRs for this repo and language

    You can disable automated security fix PRs for this repo from the Security Alerts page.

    dependencies 
    opened by dependabot[bot] 0
  • Improve documentation

    Improve documentation

    The README.md (presumably the documentation for this project) lacks essential information for the usage of this software.

    The options are not defined. Instead, you have a link to the source code. However, the link is not a permalink tied to a specific commit. In any case, reading the source to try to understand how to use it is not enjoyable. This is also the case for styling and almost everything else.

    https://github.com/sgratzl/chartjs-chart-geo/blob/3d92cd17afaeec887d05bf9ccf677a2e0bdab607/src/controllers/GeoController.ts#L225-L230

    Except for {type: "sphere"}, what other options can be passed? Type any[] does not particularly help me understand.

    Well-formed documentation would be most welcome.

    enhancement 
    opened by williamd5 0
Releases(v4.1.1)
Owner
Samuel Gratzl
Research Software Engineer with a focus on Data Visualization - author of @lineupjs and @upsetjs
Samuel Gratzl
A Simple Dashboard Chart in Laravel Nova using Chart JS

A Simple Dashboard Chart in Laravel Nova using Chart JS. Starting create your own dashboard with Chart JS Integration can save your time and help you maintain consistency across standard elements such as Bar, Stacked, Line, Area, Doughnut and Pie Chart.

Kuncoro Wicaksono 177 Jan 4, 2023
Chart.js plugin to defer initial chart updates

Chart.js plugin to defer initial chart updates until the user scrolls and the canvas appears inside the viewport, and thus trigger the initial chart a

Chart.js 97 Nov 9, 2022
Bar Funnel Chart extension for Chart.js

Chart.BarFunnel.js Provides a Bar Funnel Chart for use with Chart.js Documentation To create a Bar Funnel Chart, include Chart.BarFunnel.js after Char

Chart.js 58 Nov 24, 2022
TradeX-chart is a trade chart written in plain (vanilla) JavaScript with minimal dependencies

TradeX-chart is a trade chart written in plain (vanilla) JavaScript with minimal dependencies; use it with any framework or backend.

null 24 Dec 12, 2022
Beautiful React SVG maps with d3-geo and topojson using a declarative api.

react-simple-maps Create beautiful SVG maps in react with d3-geo and topojson using a declarative api. Read the docs, or check out the examples. Why R

z creative labs 2.7k Dec 29, 2022
TChart.js - simple and configurable Bar and Line Chart library in Javascript

TChart.js Simple and configurable Bar and Line Chart library in Javascript Description TChart.js is a canvas-based simple Javascript Bar and Line Char

null 4 Mar 3, 2021
Chart.js plugin to calculate and draw statistical linear, exponential, power, logarithmic, and polynomial regressions.

chartjs-plugin-regression Chart.js plugin to calculate and draw statistical linear, exponential, power, logarithmic, and polynomial regressions using

Wilfredo Pomier 14 Dec 18, 2022
Redefined chart library built with React and D3

Recharts Introduction Recharts is a Redefined chart library built with React and D3. The main purpose of this library is to help you to write charts i

recharts 19.4k Jan 2, 2023
Chart image and QR code web API

QuickChart QuickChart is a service that generates images of charts from a URL. Because these charts are simple images, they are very easy to embed in

Ian Webster 1.3k Dec 25, 2022
J2CL and GWT Charts library based on CHART.JS

Charba - J2CL and GWT Charts library based on CHART.JS What's Charba GWT Web toolkit doesn't have charting library available out of the box. There are

Pepstock.org 56 Dec 17, 2022
Zoom and pan plugin for Chart.js

chartjs-plugin-zoom A zoom and pan plugin for Chart.js >= 3.0.0 For Chart.js 2.6.0 to 2.9.x support, use version 0.7.7 of this plugin. Panning can be

Chart.js 510 Jan 2, 2023
Chart.js Venn and Euler Diagrams

Chart.js Venn and Euler Diagram Chart Chart.js module for charting venn diagrams with up to five sets. Adding new chart type: venn and euler. Related

UpSet.js 23 Dec 6, 2022
Chart.js Box Plots and Violin Plot Charts

Chart.js Box and Violin Plot Chart.js module for charting box and violin plots. This is a maintained fork of @datavisyn/chartjs-chart-box-and-violin-p

Samuel Gratzl 61 Dec 14, 2022
:bar_chart: A D3-based reusable chart library

c3 c3 is a D3-based reusable chart library that enables deeper integration of charts into web applications. Follow the link for more information: http

C3.js 9.2k Jan 2, 2023
GPL version of Javascript Gantt Chart

dhtmlxGantt Getting started | Features | Follow us | License | Useful links dhtmlxGantt is an open source JavaScript Gantt chart that helps you illust

null 952 Dec 29, 2022
🍞📊 Beautiful chart for data visualization.

?? ?? Spread your data on TOAST UI Chart. TOAST UI Chart is Beautiful Statistical Data Visualization library. ?? Packages The functionality of TOAST U

NHN 5.2k Jan 2, 2023
:bar_chart: Re-usable, easy interface JavaScript chart library based on D3.js

billboard.js is a re-usable, easy interface JavaScript chart library, based on D3 v4+. The name "billboard" comes from the famous billboard chart whic

NAVER 5.4k Jan 1, 2023
:bar_chart: A library of modular chart components built on D3

Plottable Plottable is a library of chart components for creating flexible, custom charts for websites. It is built on top of D3.js and provides highe

Palantir Technologies 2.9k Dec 31, 2022
📈 A small, fast chart for time series, lines, areas, ohlc & bars

?? μPlot A small (~35 KB min), fast chart for time series, lines, areas, ohlc & bars (MIT Licensed) Introduction μPlot is a fast, memory-efficient Can

Leon Sorokin 7.5k Jan 7, 2023