TChart.js - simple and configurable Bar and Line Chart library in Javascript

Overview

TChart.js

Simple and configurable Bar and Line Chart library in Javascript

GitHub GitHub last commit GitHub code size in bytes

Description

TChart.js is a canvas-based simple Javascript Bar and Line Chart Library along with Animations if the user wants to create Animated charts.
TChart.js is a light library to provide a simple, configurable, and dependency-free experience.

Installation

Download the TChart.min.js and include it in your project

<script src="TChart.min.js"></script>

Usage

To create a Bar or Line chart, you'll need a block level container e.g 'div'.

<div id="chart">This will be our chart!</div>

Then you can create the TChart object in your Javascipt file.

let chart = new TChart(chartId, chartWidth, chartHeight, data);

Parameters

  • chartId - containerId (String) Defines the id of container like "chart"

  • chartWidth (Integer) Defines the width of chart like 600

  • chartHeight (Integer) Defines the Height of chart like 450

  • data (Objects Array) Defines the data objects. The objects should have 2 key-value pairs: label and value. Example data:

let data = [
  { label: "Jan", value: 24 },
  { label: "Feb", value: 124 },
  { label: "March", value: 65 },
  { label: "April", value: 98 },
  { label: "May", value: 65 },
  { label: "June", value: 129 },
  { label: "July", value: 198 },
  { label: "Aug", value: 256 },
  { label: "Sep", value: 77 },
];

Drawing Chart

After Creating TChart object call methods for creating Line or Bar Chart.

For Bar Chart:

Simple:
chart.drawBarChart();

"BarChart"

Animated:
chart.drawBarChart({ animation: true });

"BarChart-gif"

For Line Chart:

Simple:
chart.drawLineChart();

"Line"

Animated:
chart.drawLineChart({ animation: true });

"LineChart-gif"

License

MIT © M.Talha Khalid

You might also like...

:bar_chart: A D3-based reusable chart library

c3 c3 is a D3-based reusable chart library that enables deeper integration of charts into web applications. Follow the link for more information: http

Jan 2, 2023

:bar_chart: A library of modular chart components built on D3

Plottable Plottable is a library of chart components for creating flexible, custom charts for websites. It is built on top of D3.js and provides highe

Dec 31, 2022

React components for Chart.js, the most popular charting library

react-chartjs-2 React components for Chart.js, the most popular charting library. Supports Chart.js v3 and v2. Quickstart • Docs • Slack • Stack Overf

Jan 4, 2023

GPL version of Javascript Gantt Chart

GPL version of Javascript Gantt Chart

dhtmlxGantt Getting started | Features | Follow us | License | Useful links dhtmlxGantt is an open source JavaScript Gantt chart that helps you illust

Dec 29, 2022

Chart.js plugin to calculate and draw statistical linear, exponential, power, logarithmic, and polynomial regressions.

chartjs-plugin-regression Chart.js plugin to calculate and draw statistical linear, exponential, power, logarithmic, and polynomial regressions using

Dec 18, 2022

Chart image and QR code web API

Chart image and QR code web API

QuickChart QuickChart is a service that generates images of charts from a URL. Because these charts are simple images, they are very easy to embed in

Dec 25, 2022

Zoom and pan plugin for Chart.js

chartjs-plugin-zoom A zoom and pan plugin for Chart.js = 3.0.0 For Chart.js 2.6.0 to 2.9.x support, use version 0.7.7 of this plugin. Panning can be

Jan 2, 2023

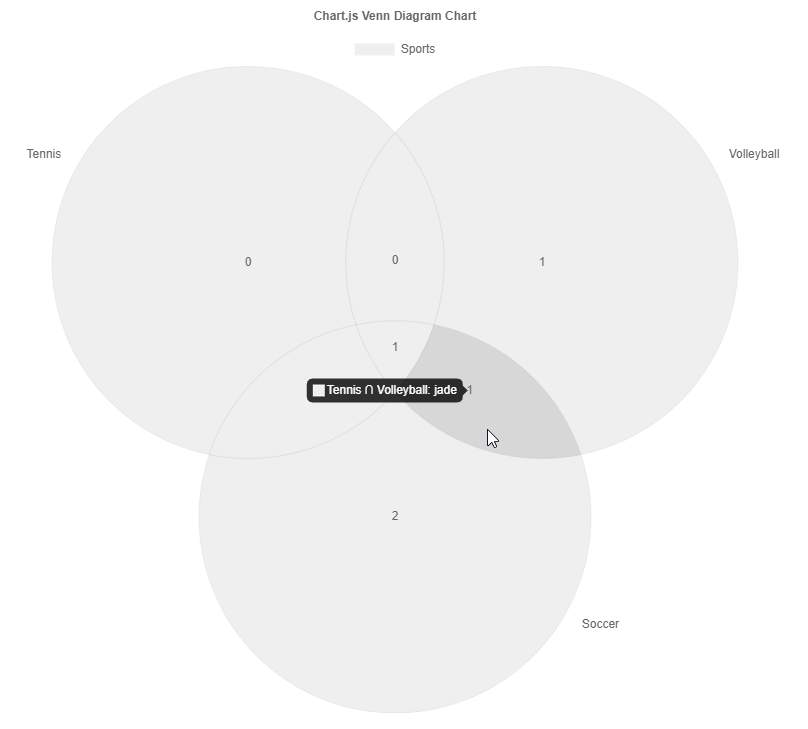
Chart.js Venn and Euler Diagrams

Chart.js Venn and Euler Diagrams

Chart.js Venn and Euler Diagram Chart Chart.js module for charting venn diagrams with up to five sets. Adding new chart type: venn and euler. Related

Dec 6, 2022

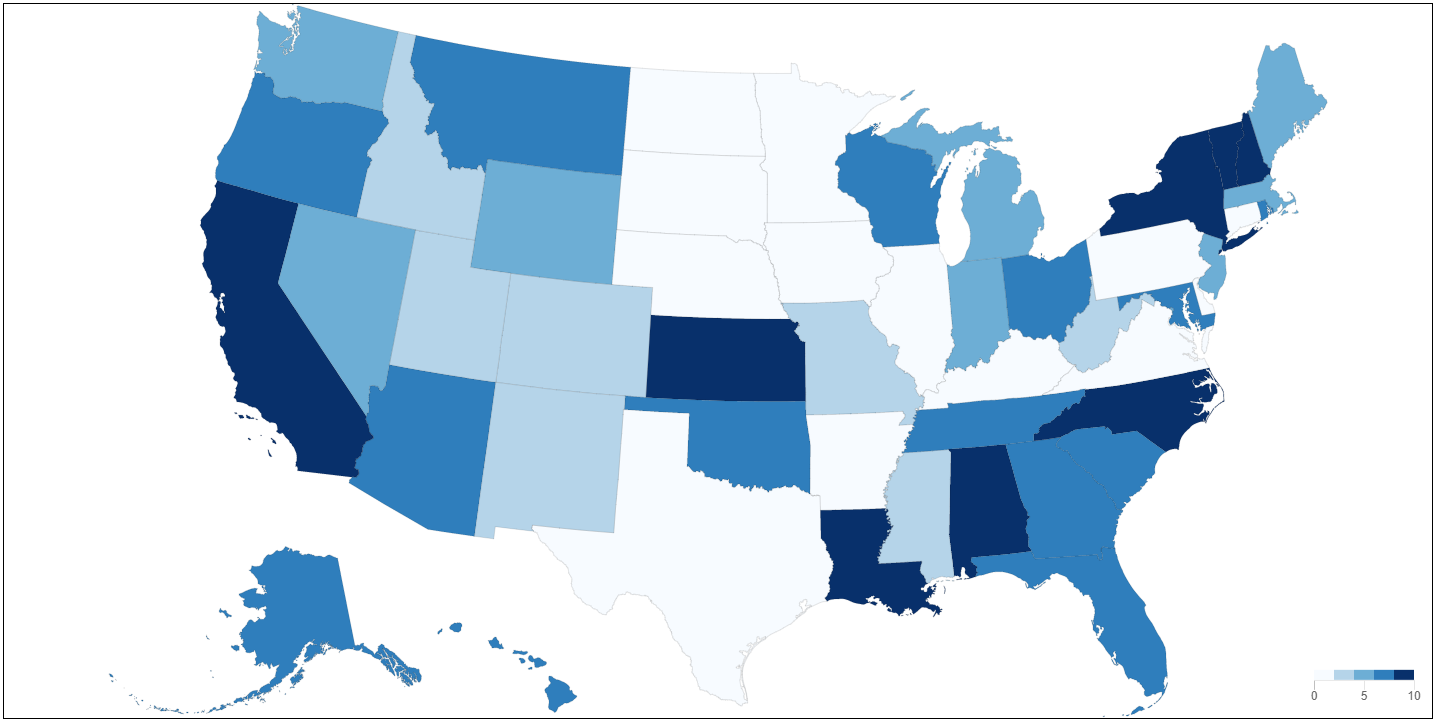
Chart.js Choropleth and Bubble Maps

Chart.js Choropleth and Bubble Maps

Chart.js Geo Chart.js module for charting maps with legends. Adding new chart types: choropleth and bubbleMap. works great with https://github.com/cha

Dec 28, 2022
Comments
  • Conversion to classic IE11 compatible class (no ES6 code)

    Conversion to classic IE11 compatible class (no ES6 code)

    Hi M.Talha Khalid,

    thanks for this very nice, little chart library! :smiley: I was looking for a very lightweight line and bar-chart library for two of my projects and found this (via Google -> cssscript.com).

    Unfortunately I've still the requirement to be compatible to IE11 (:stuck_out_tongue_closed_eyes: ) so I decided to convert it and remove all the ES6 code. I'll probably clean-up a little more later and add some additional options, but its working fine already.

    I thought this might be interesting for you so I'm posting the result here in the hope you might be willing to follow me down the bumpy IE11 road :grin: . If not I can totally understand this ;-)

    Anyway good work and thanks again! Florian

    opened by fquirin 0
Owner
null
Bar Funnel Chart extension for Chart.js

Chart.BarFunnel.js Provides a Bar Funnel Chart for use with Chart.js Documentation To create a Bar Funnel Chart, include Chart.BarFunnel.js after Char

Chart.js 58 Nov 24, 2022
A Simple Dashboard Chart in Laravel Nova using Chart JS

A Simple Dashboard Chart in Laravel Nova using Chart JS. Starting create your own dashboard with Chart JS Integration can save your time and help you maintain consistency across standard elements such as Bar, Stacked, Line, Area, Doughnut and Pie Chart.

Kuncoro Wicaksono 177 Jan 4, 2023
Progressive pie, donut, bar and line charts

Peity Peity (sounds like deity) is a jQuery plugin that converts an element's content into a mini <svg> pie, donut, line or bar chart. Basic Usage HTM

Ben Pickles 4.2k Jan 1, 2023
TradeX-chart is a trade chart written in plain (vanilla) JavaScript with minimal dependencies

TradeX-chart is a trade chart written in plain (vanilla) JavaScript with minimal dependencies; use it with any framework or backend.

null 24 Dec 12, 2022
Chart.js plugin to defer initial chart updates

Chart.js plugin to defer initial chart updates until the user scrolls and the canvas appears inside the viewport, and thus trigger the initial chart a

Chart.js 97 Nov 9, 2022
HTML5 Canvas Gauge. Tiny implementation of highly configurable gauge using pure JavaScript and HTML5 canvas. No dependencies. Suitable for IoT devices because of minimum code base.

HTML Canvas Gauges v2.1 Installation Documentation Add-Ons Special Thanks License This is tiny implementation of highly configurable gauge using pure

Mykhailo Stadnyk 1.5k Dec 30, 2022
Java library for use with Chart.js javascript library

Chart.java Chart.java enables integration with the excellent Chart.js library from within a Java application. Usage example In Java: BarDataset datase

Marceau Dewilde 102 Dec 16, 2022
:bar_chart: Re-usable, easy interface JavaScript chart library based on D3.js

billboard.js is a re-usable, easy interface JavaScript chart library, based on D3 v4+. The name "billboard" comes from the famous billboard chart whic

NAVER 5.4k Jan 1, 2023
Redefined chart library built with React and D3

Recharts Introduction Recharts is a Redefined chart library built with React and D3. The main purpose of this library is to help you to write charts i

recharts 19.4k Jan 2, 2023
J2CL and GWT Charts library based on CHART.JS

Charba - J2CL and GWT Charts library based on CHART.JS What's Charba GWT Web toolkit doesn't have charting library available out of the box. There are

Pepstock.org 56 Dec 17, 2022