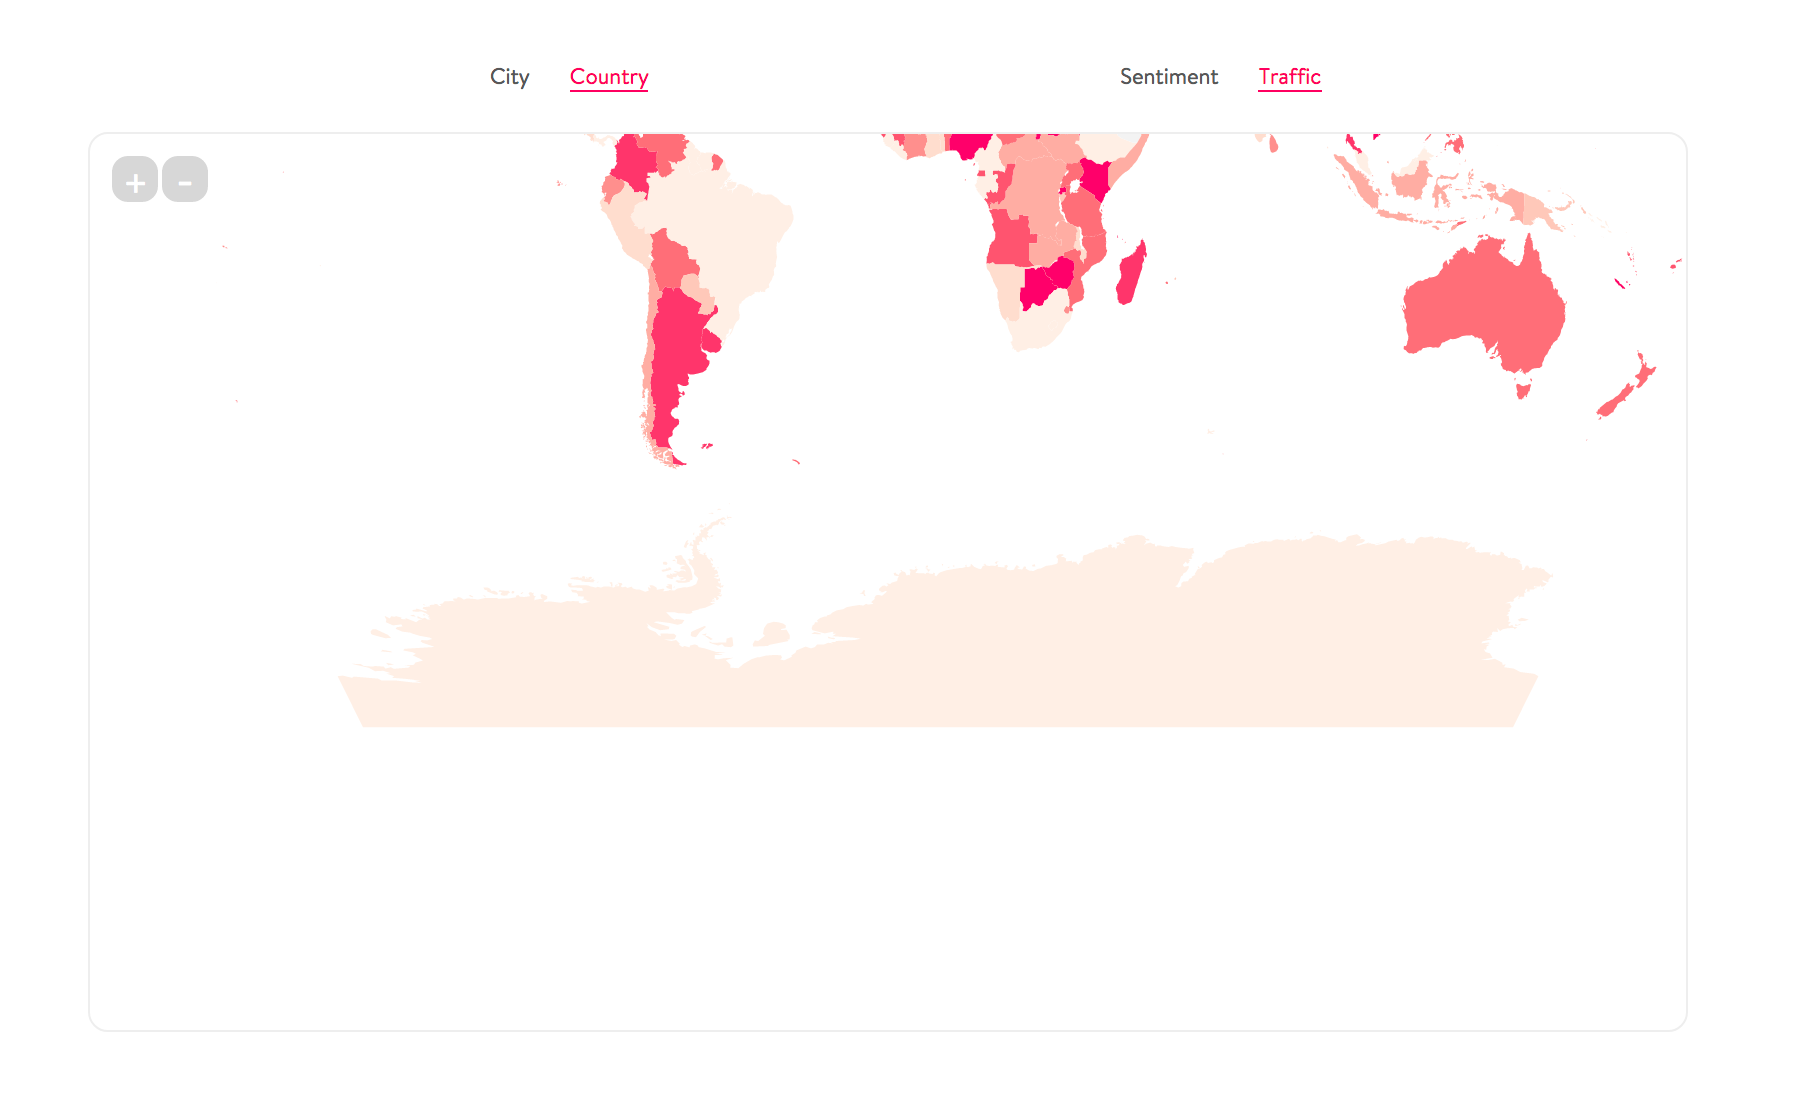
Beautiful React SVG maps with d3-geo and topojson using a declarative api.

Overview

react-simple-maps

Create beautiful SVG maps in react with d3-geo and topojson using a declarative api.

Read the docs, or check out the examples.

Why

React-simple-maps aims to make working with svg maps in react easier. It handles tasks such as panning, zooming and simple rendering optimization, and takes advantage of parts of d3-geo and topojson-client instead of relying on the entire d3 library.

Since react-simple-maps leaves DOM work to react, it can also easily be used with other libraries, such as react-spring and react-annotation.

Install

To install react-simple-maps

$ npm install --save react-simple-maps

...or if you use yarn:

$ yarn add react-simple-maps

Usage

React-simple-maps exposes a set of components that can be combined to create svg maps with markers and annotations. In order to render a map you have to provide a reference to a valid topojson file. You can find example topojson files in the topojson-maps folder or on topojson world-atlas. To learn how to make your own topojson maps from shapefiles, please read "How to convert and prepare TopoJSON files for interactive mapping with d3" on medium.

import React from "react"
import ReactDOM from "react-dom"
import {
  ComposableMap,
  Geographies,
  Geography,
} from "react-simple-maps"

// url to a valid topojson file
const geoUrl =
  "https://raw.githubusercontent.com/zcreativelabs/react-simple-maps/master/topojson-maps/world-110m.json"

const App = () => {
  return (
    <div>
      <ComposableMap>
        <Geographies geography={geoUrl}>
          {({geographies}) => geographies.map(geo =>
            <Geography key={geo.rsmKey} geography={geo} />
          )}
        </Geographies>
      </ComposableMap>
    </div>
  )
}

document.addEventListener("DOMContentLoaded", () => {
  ReactDOM.render(<App />, document.getElementById("app"))
})

Check out the live example

The above will render a world map using the equal earth projection. You can read more about this projection on Shaded Relief and on Wikipedia.

For other examples and components, check out the documentation.

License

MIT licensed. Copyright (c) Richard Zimerman 2017. See LICENSE.md for more details.

Comments
  • Tooltip integration with react-tooltip

    Tooltip integration with react-tooltip

    Hi!

    I finally decided to switch to your awesome library but found a little problem: I use some state to toggle a class active to some countries which applies the same color as the hover fill but when you hover over a sidebar of continents, each country belonging to that continent should highlight, my state is working correctly, but the map does not re-render, any ideas?

    Thanks in advance!

    opened by kutyel 21
  • Zoom in on Country

    Zoom in on Country

    It would be incredibly useful to center and zoom based on the returned <Geography />s within <Geographies />. I think it could be helpful as a prop within <ZoomableGroup />.

    opened by kevinahuber 16
  • albersUsa Projection

    albersUsa Projection

    Thanks for this great library!

    I'm using with the albersUsa projection and ran into a small issue I thought I would share. albersUsa doesn't have a rotate function and ZoomableGroup expects rotate to exist. One possible workaround would be to add a rotate function that doesn't actually rotate.

    I'm not using Zooming and Panning for this map so removed ZoomableGroup. ComposableMap seems to expect a single child so my workaround for now was creating a quick child component to pass the projection props along to it's children.

    const GeoGroup = ({ projection, children }) => ( children.map((child, i) => React.cloneElement(child, { projection, key: i, zoom: 1 })) );

    bug will investigate 
    opened by jlichti 13
  • Zoom on scrolling/wheel

    Zoom on scrolling/wheel

    Hi,

    is there a way to zoom by scrolling on the map ? I tried to add the scrolling event listener but it doesn't seem to work. I can't find a proper way to do it. Thank you

    opened by babbel1005 11
  • Map is broken / filled in, despite using valid GeoJSON

    Map is broken / filled in, despite using valid GeoJSON

    I'm creating a map in the style of the example at https://www.react-simple-maps.io/docs/geographies/. The only difference is that instead of a link to a TopoJSON file, I am using an array of GeoJSON MultiPolygons. The exact object I'm passing to Geographies can be found in this gist. If you want to see what it looks like, here it is formatted as a FeatureCollection. It's valid, because GitHub manages to display it fine.

    What I get looks like this:

    Screenshot from 2020-06-05 23-41-06

    The stroke I'm using is red, and the fill is black.

    What I expect to happen is something like the GitHub display linked above, but this isn't what happens. Any help is appreciated!

    opened by jthistle 10
  • Change the center of the map

    Change the center of the map

    Hi,

    I am trying to shift the center of the map a little bit up to make some space for overlay UI, so I used yOffset for that but I get pretty weird results, i.e misplaced markers etc...

    I pretty much follow the following example: https://www.react-simple-maps.io/with-react-motion

    This is my projection configuration:

    projectionConfig = {
      yOffset: -150 / this.state.zoom
    }
    
    opened by pronebird 10
  • Would like panning to stop at outer edges

    Would like panning to stop at outer edges

    Notice how I can drag the map until there is no data. Can boundary detection please be implemented to avoid this? If you have it already let me know which attribute to pass in where. screen shot 2017-06-08 at 5 23 04 pm

    enhancement 
    opened by mihir478 9
  • Maps breaking in IE11

    Maps breaking in IE11

    Hi!

    I saw that IE11 supports svg so there should be no problem but I can't see any of the maps in such browser 😱 . Haven't seen either a compatibility chart or something in the project, is it supported?

    opened by kutyel 8
  • GeoJSON results in a Black Screen where the component is placed

    GeoJSON results in a Black Screen where the component is placed

    New to React so forgive me if this is user error, but I've been stuck on this for 2 days.

    My project currently is building an Electoral Map of the UK, representing all 650 constituencies and showing how different election systems, such as PR, AV, and STV can alter the result of elections. To do this, I wish to be able to use the react simple maps framework!

    Instead, despite the JSON seemingly being correctly loaded as seen here in the console log image

    This is what I get image

    This is my code, where ElectoralMap is the child of another component

    image

    The directory. image

    JSON I'm using and ElectoralMap.js

    opened by soupmoth 7
  • Error when fetching the data of the countries (ERROR 404)

    Error when fetching the data of the countries (ERROR 404)

    I was developing a map to see the countries that visit my website when out of nowhere there was an error in the fetch to obtain the countries. I saw the examples from the official website https://www.react-simple-maps.io/ and the problem is the same, I think they removed it from the server. the 404 URL is this: GET https://raw.githubusercontent.com/zcreativelabs/react-simple-maps/master/topojson-maps/world-110m.json 404

    the error causes the map not to be displayed

    opened by kirak64 7
  • need help to figure out what's wrong with the map

    need help to figure out what's wrong with the map

    Hi,

    so i have made a topojson it contains the counties of Hungary.

    Tho, something is wrong, the map not getting rendered well. I have made a little repo for it, i'd appreciate if someone could point me to the right direction.

    Thanks,

    opened by zilahir 7
  • Module '

    Module '"react-simple-maps"' has no exported member 'useZoomPanContext'

    I'm using react-simple-maps + @types/react-simple-maps v3.0.0. useZoomPanContext and all the other hooks from the docs are missing from @types/react-simple-maps's type declarations.

    How can I help to fix that @zimrick ?

    opened by jbouhier 3
  • Really small geography elements

    Really small geography elements

    I'm trying to use a map of Germany. The SVG element is of an appropriate size, but the geography elements () are extremely small. Here's the JSON file: https://raw.githubusercontent.com/deldersveld/topojson/master/countries/germany/germany-regions.json

    How do I fix this?

    opened by DanielGGulliksen 0
  • TypeError: Cannot read properties of undefined (reading '0') stitch.js

    TypeError: Cannot read properties of undefined (reading '0') stitch.js

    Hi there

    I'm trying to use the following JSON to react-simple-maps v3.0.0 (but happens also with 2.3.0). But I get th following error: image

    I'm not very familiar with this format. But could it be that my file is not formatted correctly? Is there a way to validate it? world-50m-simplified.txt

    opened by nico-martin 0
  • How to flyTo and zoom

    How to flyTo and zoom

    It would be great to initiate a flyTo and/or zoom based on some event (e.g. - click, select, etc.). It is not clear from the documentation how to do that.

    Here's a MapBox example: https://docs.mapbox.com/mapbox-gl-js/example/flyto/ Here is a Leaflet example: https://codesandbox.io/s/react-leaflet-demo-o7ix8

    How would I approach this with react-simple-maps? TY

    opened by irSteve 0
  • Marker issue

    Marker issue

    I Face issue if i custom the marker by react element like box or div . it doesn't appear. if i want to make custom marker with the following features: 1-marker with svg icon and there is number inside it 2-if i click on the marker . i need popover appear own the marker

    opened by MBashandy 0
Javascript Canvas Library, SVG-to-Canvas (& canvas-to-SVG) Parser

Fabric.js Fabric.js is a framework that makes it easy to work with HTML5 canvas element. It is an interactive object model on top of canvas element. I

Fabric.js 23.6k Jan 3, 2023
:bar_chart: Declarative Charting Framework for Angular

ngx-charts Declarative Charting Framework for Angular! ngx-charts is unique because we don't merely wrap d3, nor any other chart engine for that matte

Swimlane 4.2k Dec 27, 2022
🌏 A Declarative 3D Globe Data Visualization Library built with Three.js

Gio.js English | 中文 React Version: react-giojs Wechat minigame: wechat usage Gio.js is an open source library for web 3D globe data visualization buil

syt123450 1.6k Dec 29, 2022
Chart.js Choropleth and Bubble Maps

Chart.js Geo Chart.js module for charting maps with legends. Adding new chart types: choropleth and bubbleMap. works great with https://github.com/cha

Samuel Gratzl 224 Dec 28, 2022
A lightweight JavaScript graphics library with the intuitive API, based on SVG/VML technology.

GraphicsJS GraphicsJS is a lightweight JavaScript graphics library with the intuitive API, based on SVG/VML technology. Overview Quick Start Articles

AnyChart 973 Jan 3, 2023
A lightweight JavaScript graphics library with the intuitive API, based on SVG/VML technology.

GraphicsJS GraphicsJS is a lightweight JavaScript graphics library with the intuitive API, based on SVG/VML technology. Overview Quick Start Articles

AnyChart 937 Feb 5, 2021
Create beautiful JavaScript charts with one line of React

React Chartkick Create beautiful JavaScript charts with one line of React See it in action Supports Chart.js, Google Charts, and Highcharts Quick Star

Andrew Kane 1.2k Dec 28, 2022
📸 Generate image using HTML5 canvas and SVG

egami → image README | 中文文档 Generate image using HTML5 canvas and SVG Fork from html-to-image Installation pnpm pnpm add egami npm npm i egami Usage i

weng 12 Jan 3, 2023
Demonstration of liquid effect on HTML Canvas using Matter.js and SVG Filters (Blur + Contrast)

Canvas Liquid Effect Demonstration of liquid (or gooey) effect on HTML Canvas using Matter.js and SVG Filters (feGaussianBlur and feColorMatrix). DEMO

Utkarsh Verma 78 Dec 24, 2022
Easy-to-use js library for building graphs using svg.

LineChart Easy-to-use js library for building graphs using svg. Examples How to use Just add linechart.js from 'src' directory to your project. And ad

Korpusov Maxim 8 Nov 21, 2022
Bring data to life with SVG, Canvas and HTML. :bar_chart::chart_with_upwards_trend::tada:

D3: Data-Driven Documents D3 (or D3.js) is a JavaScript library for visualizing data using web standards. D3 helps you bring data to life using SVG, C

D3 103.8k Jan 3, 2023
The lightweight library for manipulating and animating SVG

SVG.js A lightweight library for manipulating and animating SVG, without any dependencies. SVG.js is licensed under the terms of the MIT License. Inst

SVG.js 10k Dec 25, 2022
Progressive pie, donut, bar and line charts

Peity Peity (sounds like deity) is a jQuery plugin that converts an element's content into a mini <svg> pie, donut, line or bar chart. Basic Usage HTM

Ben Pickles 4.2k Jan 1, 2023
The lightweight library for manipulating and animating SVG

SVG.js A lightweight library for manipulating and animating SVG, without any dependencies. SVG.js is licensed under the terms of the MIT License. Inst

SVG.js 10k Jan 3, 2023
JavaScript SVG parser and renderer on Canvas

canvg JavaScript SVG parser and renderer on Canvas. It takes the URL to the SVG file or the text of the SVG file, parses it in JavaScript and renders

null 3.3k Jan 4, 2023
The JavaScript library for modern SVG graphics.

Snap.svg · A JavaScript SVG library for the modern web. Learn more at snapsvg.io. Follow us on Twitter. Install Bower - bower install snap.svg npm - n

Adobe Web Platform 13.6k Dec 30, 2022
Simple, responsive, modern SVG Charts with zero dependencies

Frappe Charts GitHub-inspired modern, intuitive and responsive charts with zero dependencies Explore Demos » Edit at CodePen » Contents Installation U

Frappe 14.6k Jan 4, 2023
Minimalistic, animated SVG gauge. Zero dependencies

SVG Gauge Minmalistic, configurable, animated SVG gauge. Zero dependencies Buy me a coffee ☕ If you like my work please consider making a small donati

Aniket Naik 264 Dec 17, 2022
Flat, round, designer-friendly pseudo-3D engine for canvas & SVG

Zdog Round, flat, designer-friendly pseudo-3D engine View complete documentation and live demos at zzz.dog. Install Download zdog.dist.min.js minified

Metafizzy 9.5k Jan 3, 2023