A Kubernetes monitoring tool to visualize large-scale activity and real-time comprehensive metrics within your cluster.

Overview

Armada Logo

Armada

A light-weight Kubernetes health monitoring tool.

Summary

Armada is an open-source tool for monitoring the health of your Kubernetes cluster. It features a dashboard which delivers an at-a-glance overview of the status of your cluster. It also features a metrics page to view time-series data of your cluster's performance, and an alerts page and logs page to stay on top of any events that may arise.

Features

Dashboard - Easily Assess and Diagnose Cluster Health

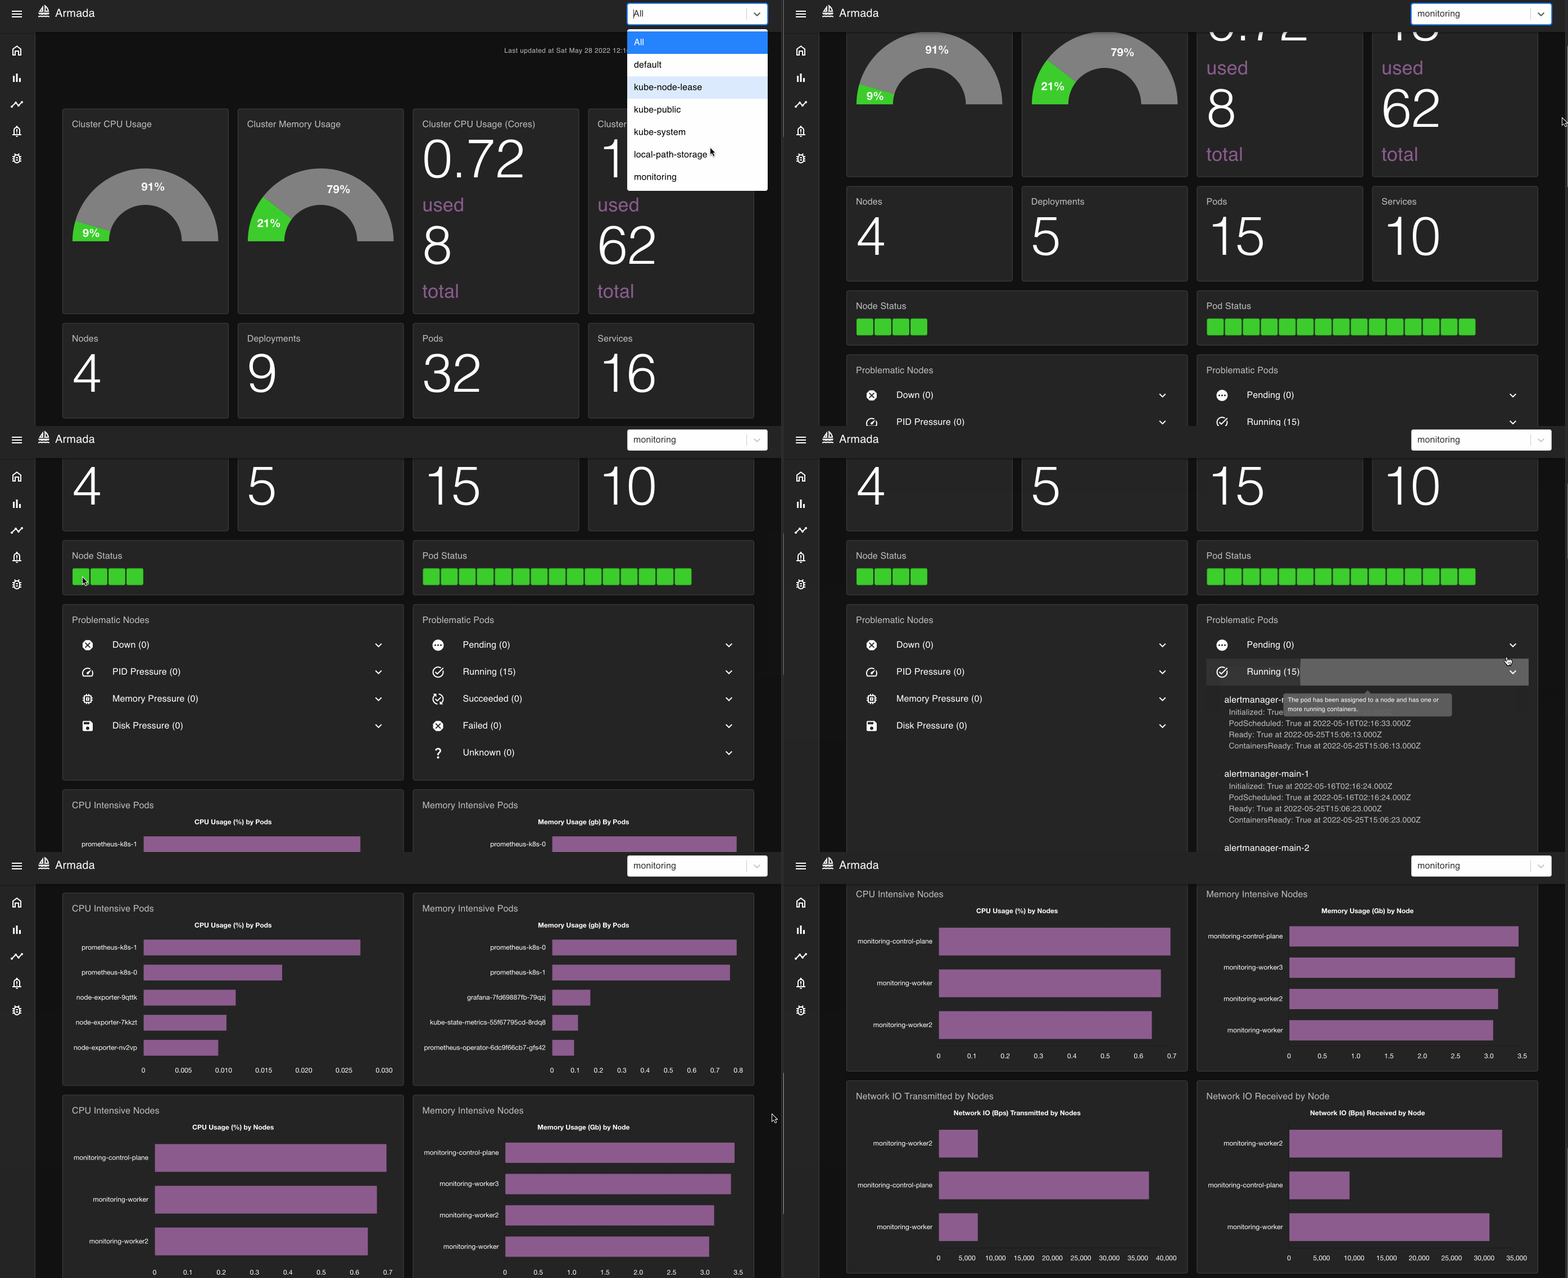
The homepage dashboard provides a comprehensive and easily digestible overview of your cluster health and performance. It shows overall cluster resource usage, cluster statistics, and node and pod statuses. It also features charts tracking the most resource-intensive nodes and pods in your cluster. All data across the application is filterable by namespace.

homepage

Metrics - In-Depth View of Cluster Performance

The metrics page displays a curated selection of time-series data regarding your cluster. You can view CPU usage, memory usage, and network data for namespaces, nodes, and pods. Not seeing the information you're looking for? Simply go to the custom query page and submit your query to see customized time-series charts.

metrics

Custom Metrics - Create a Custom View of Your Cluster Metrics

For additional flexibility, the custom metrics page allows users to select from over 800 Prometheus Queries to generate time-series charts with custom inputs for time range, step, and namespace.

custom

Alerts and Logs - Stay Updated on Cluster Events

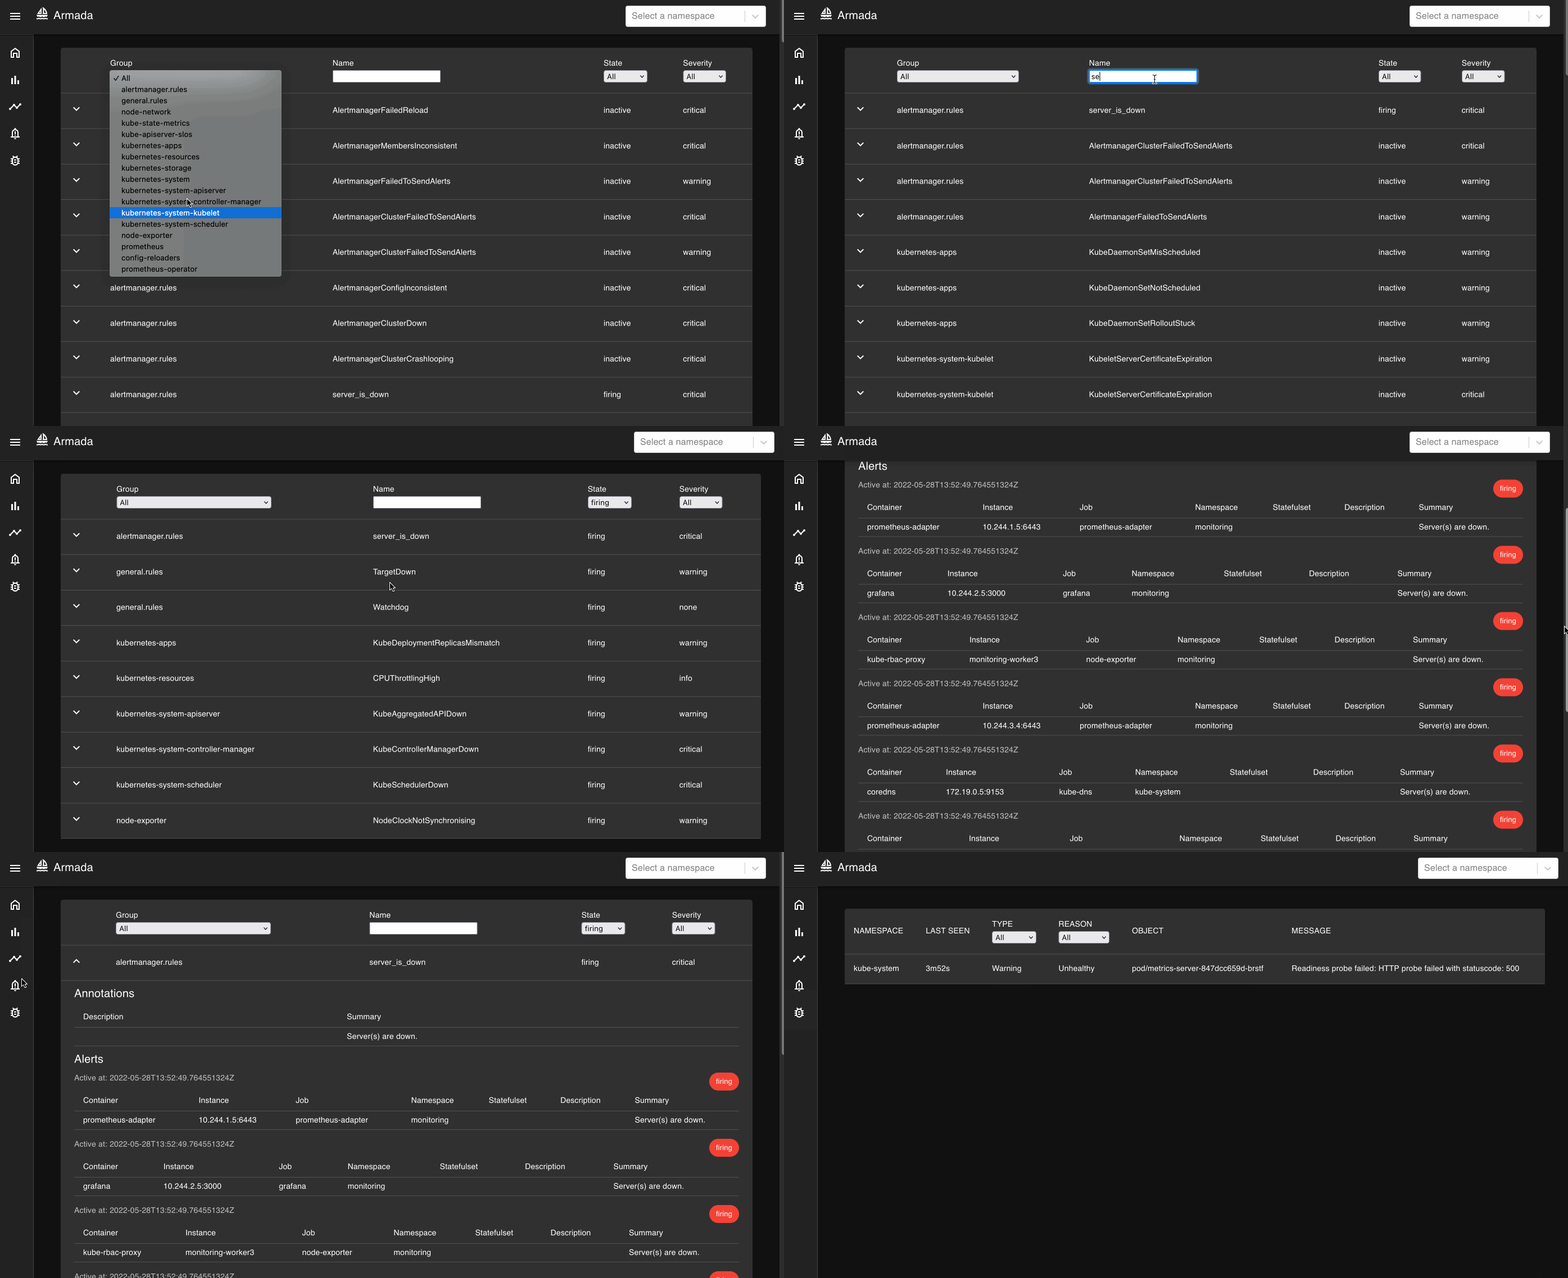
The alerts page displays all Prometheus rules, filterable by group, name, status, and severity. Upon expanding a rule you can see any active alerts, along with associated descriptions. You can view event logs on the log page, filterable by type and reason.

alerts

Getting Started

1. Prerequisites

Before you start with Armada, make sure you have a configured and running Kubernetes cluster and Prometheus. You can find detailed instructions on how to set this up here.

2. Clone this repo

Run this command in your terminal:

git clone [email protected]:oslabs-beta/Armada.git

3. Install dependencies and start the app

Run these commands from within the root directory:

npm install
npm run build
npm run start

4. Port-forward Prometheus to 9090

To port-forward Prometheus, run the following command, replacing the terms in brackets with the namespace and service name.

kubectl port-forward -n <namespace> svc/<service name> 9090

5. Start using Armada!

Go to http://localhost:3001/ and enjoy your new k8s experience!

Built With

The Team

You might also like...

A social network where you can share posts, view your profile metrics and follow other users.

Getting Started with Create React App This project was bootstrapped with Create React App. Available Scripts In the project directory, you can run: np

Aug 21, 2022

Uptime monitoring RESTful API server that allows authenticated users to monitor URLs, and get detailed uptime reports about their availability, average response time, and total uptime/downtime.

Uptime Monitoring API Uptime monitoring RESTful API server that allows authenticated users to monitor URLs, and get detailed uptime reports about thei

Jun 14, 2022

LayerX-AI is a comprehensive platform to annotate and manage your machine learning data.

LayerX-AI is a comprehensive platform to annotate and manage your machine learning data.

The AI Data Platform Annotate, Manage and Deploy Training Data The end-to-end AI data management platform that helps ML teams annotate, manage and dep

Dec 18, 2022

An affordable and easy-to-use monitoring tool for your AWS serverless applications.

An affordable and easy-to-use monitoring tool for your AWS serverless applications.

AWS Serverless Applications Monitoring Tool Table of Contents Motivation for Project Getting Started AWS End Users Installation and Setup Lambda Metri

Sep 21, 2022

Visualize, modify, and build your database with dbSpy! An open-source data modeling tool to facilitate relational database development.

Visualize, modify, and build your database with dbSpy! An open-source data modeling tool to facilitate relational database development.

Visualize, modify, and build your database with dbSpy! dbSpy is an open-source data modeling tool to facilitate relational database development. Key F

Dec 22, 2022

A powerful data visualization 2D/3D large-screen editor tool with low-code.

tp-editor(2D/3D)中文说明 A topology 2D/3D editor with nodejs, express, socket.io es6, HT for Web and vite. It's a powerful large-screen data visualization

Dec 25, 2022

A simple Prometheus (aggregated) push gateway allowing stateless/serverless workloads, ephemeral and batch jobs to easily expose their metrics.

A simple Prometheus (aggregated) push gateway allowing stateless/serverless workloads, ephemeral and batch jobs to easily expose their metrics.

Serverless Prometheus (aggregated) Push Gateway A simple Prometheus (aggregated) push gateway allowing stateless/serverless workloads, ephemeral and b

Dec 4, 2022

Introduction to Metrics, Logs and Traces session companion code.

Introduction to Metrics, Logs and Traces in Grafana This is the companion repository to a series of presentations over the three pillars of observabil

Dec 24, 2022

A lightweight (the actual ship is heavy though), performat & powerful sharder for Discord.JS. Indomitable uses cluster module to evenly spread her weight (load) across your cores

A lightweight (the actual ship is heavy though), performat & powerful sharder for Discord.JS. Indomitable uses cluster module to evenly spread her weight (load) across your cores

Indomitable A lightweight (the actual ship is heavy though), performat & powerful sharder for Discord.JS. Indomitable uses cluster module to evenly sp

Nov 29, 2022
Owner
OSLabs Beta
OSLabs Beta
An open-source visualization tool for monitoring Kafka cluster metrics

GitHub Tutorial Hyperion An open-source Kafka monitoring tool built for developers hyperionapp.dev Table of Contents About the Project Built With Gett

OSLabs Beta 46 Nov 10, 2022
A light-weight, simple, and straightforward learning tool for your Kubernetes cluster

Introducing Neptune Light-weight, simple, and straightforward learning tool for your Kubernetes cluster Neptune is an approachable learning tool, ligh

OSLabs Beta 109 Jan 4, 2023
A visual overview of Kubernetes architecture and Prometheus metrics

A visual overview of Kubernetes architecture and Prometheus metrics. Structure Navigate through the structures page to easily see your control planes

OSLabs Beta 213 Oct 11, 2022
A large scale simulation which pits millions of space ships against each other in a virtual universe all running directly in SingleStore.

Wasm Space Program In this demo we simulate a fake universe full of thousands of solar systems. In each solar system there are many space ships and en

SingleStore Labs 11 Nov 2, 2022
T3 is a client-side JavaScript framework for building large-scale web applications

Box has migrated using react, webpack, and the latest version of ECMAScript for our frontend projects as of 2018. We no longer support chan

Box 1.6k Dec 8, 2022
🗃️ An in-memory JS database optimized for large scale storage on the frontend.

BlinkDB is a in-memory JS database optimized for large scale storage on the frontend. import { many } from 'blinkdb'; const items = await many(userTa

BlinkDB 64 Dec 23, 2022
Changd is a open source web monitoring application for monitoring visual site changes using screenshots, XPath's or API's.

Changd is a open source web monitoring application and a free alternative to ChangeTower.com, Hexowatch.com, and other SaaS-based solutions. Changd ca

Paul Aschmann 110 Jan 3, 2023
The Trino datasource allows to query and visualize Trino data from within Grafana.

Trino Grafana Data Source Plugin The Trino datasource allows to query and visualize Trino data from within Grafana. Getting started Drop this into Gra

Starburst 13 Nov 3, 2022
Github action to collect metrics (CPU, memory, I/O, etc ...) from your workflows to help you debug and optimize your CI/CD pipeline

workflow-telemetry-action A GitHub Action to track and monitor the resource metrics of your GitHub Action workflow runs. If the run is triggered via a

Thundra 32 Dec 30, 2022
A map for 1337 Khouribga's new labs clusters. This tool will help 1337 students find available posts, and search for other students in the cluster by name or login.

1337KH Labs Clusters Map Hellow. This tool is made by 1337 Khouribga students for 1337 Khouribga students to help make their lives at the school easie

Oussama 18 Aug 8, 2022