A lightweight graphic library providing 2d draw for Apache ECharts

Overview

ZRender

A lightweight graphic library which provides 2d draw for Apache ECharts.

Build Status Commits Since 4.0.0

Documentation

https://ecomfe.github.io/zrender-doc/public/

License

BSD 3-Clause License

Copyright (c) 2017, Baidu Inc. All rights reserved.

Redistribution and use in source and binary forms, with or without modification, are permitted provided that the following conditions are met:

  • Redistributions of source code must retain the above copyright notice, this list of conditions and the following disclaimer.

  • Redistributions in binary form must reproduce the above copyright notice, this list of conditions and the following disclaimer in the documentation and/or other materials provided with the distribution.

  • Neither the name of the copyright holder nor the names of its contributors may be used to endorse or promote products derived from this software without specific prior written permission.

THIS SOFTWARE IS PROVIDED BY THE COPYRIGHT HOLDERS AND CONTRIBUTORS "AS IS" AND ANY EXPRESS OR IMPLIED WARRANTIES, INCLUDING, BUT NOT LIMITED TO, THE IMPLIED WARRANTIES OF MERCHANTABILITY AND FITNESS FOR A PARTICULAR PURPOSE ARE DISCLAIMED. IN NO EVENT SHALL THE COPYRIGHT HOLDER OR CONTRIBUTORS BE LIABLE FOR ANY DIRECT, INDIRECT, INCIDENTAL, SPECIAL, EXEMPLARY, OR CONSEQUENTIAL DAMAGES (INCLUDING, BUT NOT LIMITED TO, PROCUREMENT OF SUBSTITUTE GOODS OR SERVICES; LOSS OF USE, DATA, OR PROFITS; OR BUSINESS INTERRUPTION) HOWEVER CAUSED AND ON ANY THEORY OF LIABILITY, WHETHER IN CONTRACT, STRICT LIABILITY, OR TORT (INCLUDING NEGLIGENCE OR OTHERWISE) ARISING IN ANY WAY OUT OF THE USE OF THIS SOFTWARE, EVEN IF ADVISED OF THE POSSIBILITY OF SUCH DAMAGE.

Comments
  • 在IE下, 初始化zrender失败导致echart图表无法显示

    在IE下, 初始化zrender失败导致echart图表无法显示

    环境

    • windows 10
    • ie 11
    • "echarts": "^3.1.10",

    浏览器报错

    ···bash SCRIPT65535: Invalid calling object

    
    报错点 Animation.js (181,1)
    
    ···js
    
     start: function () {
                var self = this;
    
                this._running = true;
    
                function step() {
                    if (self._running) {
    
                        requestAnimationFrame(step);
    
                        self._update();
                    }
                }
    
                this._time = new Date().getTime();
                requestAnimationFrame(step);
            }


    运行requestAnimationFrame这个方法的时候就会报错

    谢谢。

    enhancement question 
    opened by shikelong 19
  • zrender 从3.6.3 升级到3.7.0 后引起Webpack uglify bug

    zrender 从3.6.3 升级到3.7.0 后引起Webpack uglify bug

    zrender 版本:3.7.0, Echarts 版本: 3.7.2 在项目源码引用Echarts 方式是 import Echarts from 'echarts'; 从3.6.3升级到3.7.0后, webpack uglify 报错,报错原因不能解析ES6语法. 去除uglify plugin, 项目build成功,但是上线后还是报错 screen shot 2017-11-08 at 6 15 35 pm screen shot 2017-11-08 at 6 15 45 pm

    opened by HuanxinHu 15
  • Fix for

    Fix for "Passive event listeners" warning in console logs

    This is a fix for this annoying warnings, when you scroll the page:

    screen shot 2018-02-02 at 11 29 22

    There is a quite good explanation why it happens and how to prevent it.

    My PR just contains the fix based on the recommendations.

    Btw, this issue is already opened

    https://github.com/ecomfe/zrender/issues/238

    opened by acierto 10
  • 监听resize之后,试图没有刷新

    监听resize之后,试图没有刷新

    我绘制一个图形,是通过 zr.getWidth()/2 绘制在中间位置的,当我resize的时候 调用zr.resize(),我从dom可以看到dom宽度已经正常变化了,但是我里面的图形没有变化,这是正常的吗? 我调用了 zr.resize(),zr.refresh,都没有刷新,或者说我如何可以在resize后图形自动刷新?

    opened by wayward-man 9
  • cpu占用问题

    cpu占用问题

    发现requestAnimationFrame非常占用cpu,觉得可以在不需要动画的时候停止,所以 我在代码中加了stopAnimation和startAnimation,如果这样没有问题的话,希望在后续版本中加入类似功能接口. 或者可以做到智能侦测?! self.startAnimation = function () { animation.start(); } self.stopAnimation = function () { animation.stop(); }

    opened by somax 9
  • 官方文档上写的 字体样式配置根本不生效

    官方文档上写的 字体样式配置根本不生效

    以下属性,在项目实战中,无法生效,

    opts.style.textLineHeight | number | 0 | 文字行高。

    demo 测试地址

    http://test.suwis.com/zrender/zrender.bug.html

    这些属性根本就不生效好吧,这个影响很大,请尽快修复!我还没有全部核查,请贵公司好好做产品

    new-feature 
    opened by Ivorzk 8
  • fix: Uncaught TypeError: Failed to execute 'createRadialGradient' on …

    fix: Uncaught TypeError: Failed to execute 'createRadialGradient' on …

    …'CanvasRenderingContext2D': The provided double value is non-finite.

    at createRadialGradient. Excute npm run test error fix! (#16649)
    

    The bug in Echarts https://github.com/apache/echarts/issues/16649

    opened by lefex 7
  • 如何让图片上面的文字, 跟着图片一起按照中心点旋转,而不是横向移动?

    如何让图片上面的文字, 跟着图片一起按照中心点旋转,而不是横向移动?

      this.getPaiZi('活动', this.zrW / 2, 220)
    //创建一个标题牌子(文字,横纵坐标)
    getPaiZi(text, x, y) {
      let paiZi = new zrender.Image({
        style: {
          position: [0, 0],
          image: shuPaiZi,
          width: 52,
          height: 40,
          y: y,
          x: x
        },
        textContent: new zrender.Text({
          style: {
            text: text,
            fontWeight: '800',
            fontSize: '14',
            textFill: '#333333',
            **textPosition: 'bottom',
            transformText: true,**  //这个代码并没有用
            x: (52 - 28) / 2,
            y: 20
          }
        }),
        textConfig: {
          position: 'center',
          origin: [x + 28, y]
        }
      }).on('click', () => {
        paiZi.animate('')
          .when(100, {
            origin: [x + 28, y],
            rotation: 0
          })
          .when(1000, {
            origin: [x + 28, y],
            rotation: -0.3
          })
          .when(2000, {
            origin: [x + 28, y],
            rotation: 0.3
          })
          .when(3000, {
            origin: [x + 28, y],
            rotation: 0
          }).start()
      })
      this.zr.add(paiZi)
    }
    

    image

    按理说图片上面的文字,应该是跟图片一样的倾斜角的,现在并没有发生对应的旋转而是对应角度平移

    opened by sssKKwater 7
  • fix: bind mouse events in web worker

    fix: bind mouse events in web worker

    Web workers do support addEventListener ( aka. EventTarget ) and requestAnimationFrame, but worker do not have the global object window.

    Instead of window, we should use a better option to get the global object. globalThis is the best option indeed, but we can't use it due to its poor compatibility. Browser and worker both support self, and it has very good browser compatibility. Using self can be a better option than using window.

    This PR generally enables OffscreenCanvas support of zrender, which may greatly improve the performance of echarts.

    Ref: https://github.com/apache/incubator-echarts/issues/9232

    opened by CarterLi 7
  • Are you planning to support OffscreenCanvas?

    Are you planning to support OffscreenCanvas?

    opened by liyuanqiu 7
  • fix(svg): fix animation on strokePercent will cause partially drawing.

    fix(svg): fix animation on strokePercent will cause partially drawing.

    If we apply an animation on 'style.strokePercent' from 0 to 1, the shape won't be drawn completely using SVG renderer.

    image

    This problem can be reproduced. You can reference https://codesandbox.io/s/condescending-mclaren-qrhdx?file=/src/App.js . If you click 'Restart Stroke Percent Animation' a few times, you'll see different results.

    opened by mrwd2009 6
  • Update tslib dependency

    Update tslib dependency

    PR updates this library to use the latest version of tslib (2.4.0) which was released back in April. An alternative change would be change this from a hard dependency version to a version constraint (^2.3.0). I am mainly looking to avoid having two copies of tslib in my dependency tree (2.3.0 from here and echarts, and 2.4.0 from other dependencies).

    opened by MasterOdin 0
  • feat: let dispatchEvent work. issues#17638

    feat: let dispatchEvent work. issues#17638

    fixed: #17638

    usage:

    When we want to dispatch an event. For example, a Wheel event.

    step 1 Capture a wheel event and create a new wheel event base that event.

    const event = new WheelEvent('wheel', e); // e is that wheel event that we captured.
    

    step 2 Set the dispatchedOffsetX and dispatchedOffsetY attributes of the event.

    event.dispatchedOffsetX = e.offsetX;
    event.dispatchedOffsetY = e.offsetY;
    

    step 3 PreventDefault and trigger/dispatch the event on Zrender.

    e.preventDefault();
    chart.getZr().handler.proxy.dom.dispatchEvent(event); // I just use the Echarts instance for example.
    
    opened by JinJianQi 0
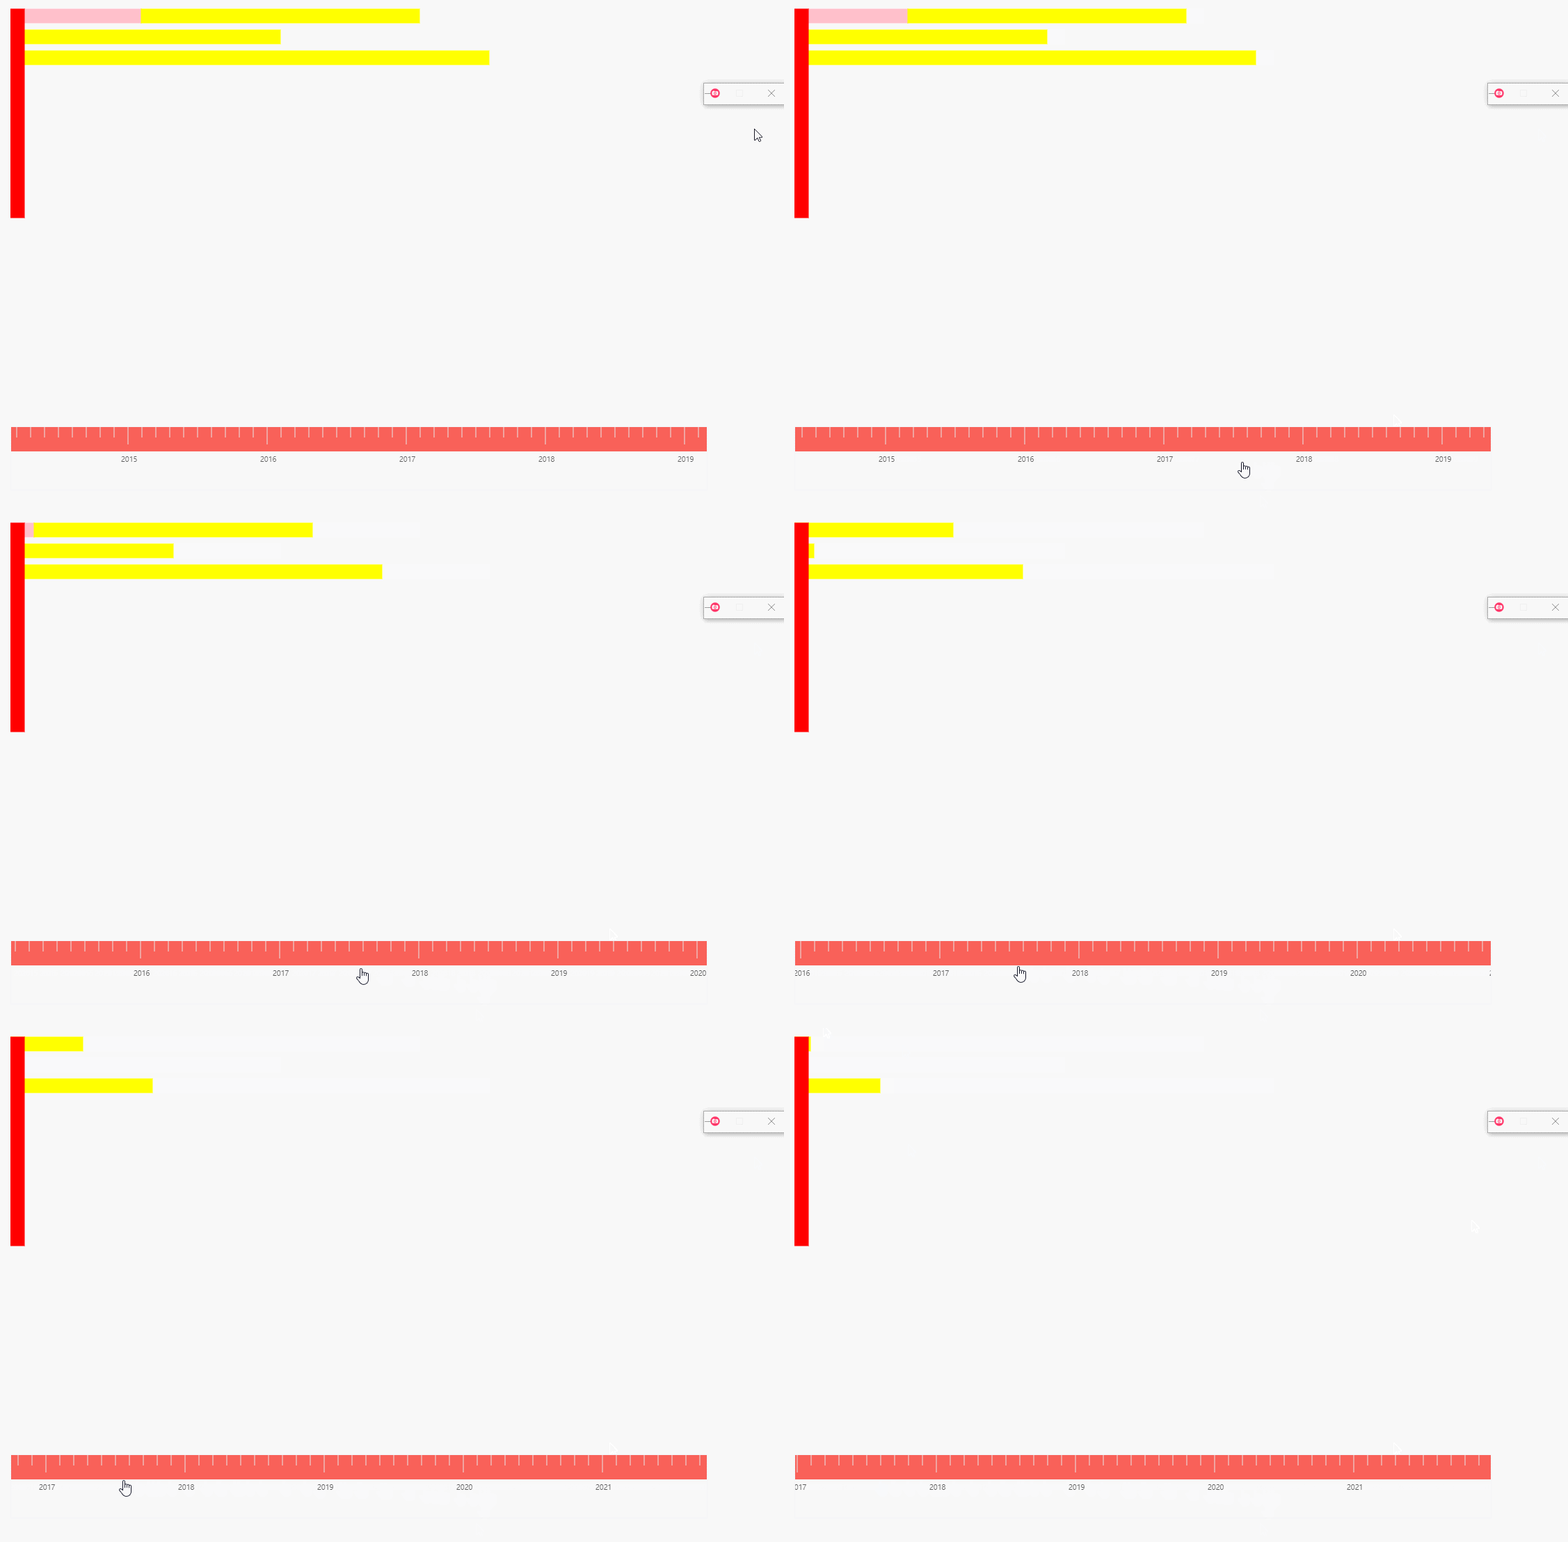
  • 怎么实现没有延时的实时动画

    怎么实现没有延时的实时动画

    demo1

    我想实现拖动下面的时间轴,上面的放开跟着实时移动,目前使用

    
          this.circle2.animateTo(
            {
              shape: {
                x: this.circle2x + data,
                y: 100,
              },
            },
            function() {
              // done
            }
          );
    

    发现一直会有延时的效果,上面的移动不能实时跟随下面的时间的拖动更新位置,请问有什么方法实现吗

    opened by better-pz 0
  • Resume method is invalid in the  version 5.3.2

    Resume method is invalid in the version 5.3.2

    In this version, the resume method is called to restore the animation, and the method fails. It seems that there are some problems with the step method.

    Animation.prototype._startLoop = function () { var self = this; this._running = true; function step() { if (self._running) { requestAnimationFrame$1(step); !self._paused && self.update(); } } requestAnimationFrame$1(step); };

    opened by userxiong 1
Releases(5.4.1)
  • 5.4.1(Nov 28, 2022)

    • feat(svg): support gradients and patterns for background color in SVG renderer. #959
    • feat(util): use native Map if available. #966
    • feat(util): add hasKey method into HashMap for ECharts. #971
    • fix(util): fix wrong expression for extracting the font size. #968
    • fix(morph): fix shape may disappear after morphing animation is finished in SVG renderer. #976
    Source code(tar.gz)
    Source code(zip)
  • 5.4.0(Sep 13, 2022)

    • featrue: Support coarse pointer. #918
    • fix: Fix pattern is not correctly scaled in canvas renderer. #938
    • fix: encode HTML when converting vnode to string. #935, apache/echarts#17399
    • fix: Fix rgb parsing. #930, #929
    Source code(tar.gz)
    Source code(zip)
  • 5.3.2(Jun 9, 2022)

  • 5.3.1(Mar 4, 2022)

  • 5.0.0-beta.2(Oct 26, 2020)

  • 5.0.0-beta.1(Oct 14, 2020)

  • 5.0.0-alpha.2(Aug 17, 2020)

  • 5.0.0-alpha.1(Jul 31, 2020)

  • 4.3.1(May 6, 2020)

  • 4.3.0(Mar 2, 2020)

    • [Feature]: Support setting draggable on Group.
    • [Feature]: Support converting coordinates from the base on one DOM element (left-top corner) to another DOM element. (Not exposed as a public API yet.)
    • [Fix]: Enable subPixelOptimize works when lineWidth is '0'/null/undefined (apache/incubator-echarts#11874 apache/incubator-echarts#11891).
    Source code(tar.gz)
    Source code(zip)
  • 4.2.0(Dec 12, 2019)

    • [Feature]: Support dragging outside of the zrender boundary. That is, while dragging, mousemove and mouseup event will continue to be fired when the pointer is out of the zrender area. And enable to drag an element outside the zrender boundary if the element is set as draggable: true. That is important for the improvement of the user experience when dragging something near the boundary without being terminated unexpectedly. Meanwhile, the event globalout will not be fired until the pointer released if having been dragging outside of the zrender boundary. This is essentially a break change but probaly won't bring effects in the most cases. If users need to confine a draggable element inside the boundary of zrender, they should better do collision detection between the element and the boundary. More details can be checked in #547.
    • [Fix]: Clear text when mouse leaves. (#535)
    • [Fix]: Fix removing el may have error when text is set to none. (#542)
    Source code(tar.gz)
    Source code(zip)
  • 4.1.2(Nov 7, 2019)

    4.1.2

    • Fix: processGesture does not work.
    • Fix: SVG plain text rendering.
    • Fix: Make Compat for iOS13 Safari z order bug.
    • Fix: shadow bug on SVG.
    Source code(tar.gz)
    Source code(zip)
  • 4.1.1(Sep 28, 2019)

  • 4.1.0(Aug 30, 2019)

    2019-08-30

    • Fix that refresh hover called twice. Remove some unnecessary restore.

    • Support mouse event in iOS when CSS transform used. close #463

    Source code(tar.gz)
    Source code(zip)
  • 4.0.7(Feb 25, 2019)

  • 4.0.5(Sep 14, 2018)

    v4.0.5

    2018-09-15
    • [Fix] Fix transform bug. See #337.
    • [Fix] Fix textRotate bug. See apache/incubator-echarts#8282.
    • [Fix] Fix fillOpacity for SVG renderer. See #351.
    • [Fix] Fix text scale bug when parent has scale for SVG renderer. See apache/incubator-echarts#8814.
    Source code(tar.gz)
    Source code(zip)
  • 4.0.4(Apr 24, 2018)

    v4.0.4

    2018-04-25
    • [Fix] transform decompose with origin. #337
    • [Fix] If a point is on the edge of a shape, it should be considered as "contain".
    • [Fix] SVG: text transform bug caused by textRotate.
    • [Fix] SVG: text position bug of SVG tooltip. apache/incubator-echarts#7947
    • [Fix] SVG: add default value for textRotation.
    • [Fix] Use a more accurate way to detect WeChat env.
    • [Fix] Set zlevel for main layer, fix bug for backgroundColor on wxa. ecomfe/echarts-for-weixin#6
    Source code(tar.gz)
    Source code(zip)
  • 4.0.3(Feb 28, 2018)

  • 4.0.2(Feb 27, 2018)

    v4.0.2

    2018-02-27
    • [+] Supported render finished event.

    • [+] Supported style.textRotation on SVG rendering engine.

    • [^] Fixed gradient bug when no data is set.

    • [^] Used arc instead of quadraticCurve for border radius of rect.

    Source code(tar.gz)
    Source code(zip)
Apache ECharts is a powerful, interactive charting and data visualization library for browser

Apache ECharts Apache ECharts is a free, powerful charting and visualization library offering an easy way of adding intuitive, interactive, and highly

The Apache Software Foundation 53.8k Jan 9, 2023
Apache ECharts is a powerful, interactive charting and data visualization library for browser

Apache ECharts Apache ECharts is a free, powerful charting and visualization library offering an easy way of adding intuitive, interactive, and highly

The Apache Software Foundation 53.8k Jan 5, 2023
An All-in-one Visualization Framework for TiddlyWiki5 based on ECharts

ECharts for TiddlyWiki5 When I first started using TiddlyWiki a long time ago, I wanted TiddlyWiki to be able to visualize data. I wanted to generate

Tiddly Gittly 31 Dec 30, 2022
JAVASCRIPT library with which you can easily draw CANVAS HTML

easycanvas Quick start Documentation: gaidadei.ru/easycanvas Download: gaidadei.ru/easycanvas/easyc.zip Buy premium: gaidadei.ru/easycanvas/premium (A

null 18 Nov 12, 2022
Apache Superset is a Data Visualization and Data Exploration Platform

Superset A modern, enterprise-ready business intelligence web application. Why Superset? | Supported Databases | Installation and Configuration | Rele

The Apache Software Foundation 49.9k Dec 31, 2022
DEPRECATED. Zeppelin has moved to Apache. Please make pull request there

Zeppelin has moved to Apache. Zeppelin's has moved to Apache incubator. This github repository is not going to be synced to the ASF's one after 20/Mar

ZEPL 417 Dec 15, 2022
A monitoring and visualization tool for Apache Kafka.

An open source monitoring tool for Apache Kafka Table of Contents Features Demo Installation Engineering Team Features User-friendly GUI Insights into

OSLabs Beta 44 Jan 2, 2023
A web app that shows visualizations of the most used graphs algorithms such as BFS, DFS, Dijsktra, Minimum spanning tree, etc. It allows you to draw your own graph.

Graph Visualizer Draw your own graphs and visualize the most common graph algorithms This web application allows you to draw a graph from zero, with p

Gonzalo Pereira 31 Jul 29, 2022
Chart.js plugin to calculate and draw statistical linear, exponential, power, logarithmic, and polynomial regressions.

chartjs-plugin-regression Chart.js plugin to calculate and draw statistical linear, exponential, power, logarithmic, and polynomial regressions using

Wilfredo Pomier 14 Dec 18, 2022
An Attack Graphs Extension for Draw.io

Attack Graphs Plugin for draw.io Installation and User Guide Please find the detailed documentation here. Technical Documentation Overview of the Plug

INCYDE GmbH 9 Nov 21, 2022
danfo.js is an open source, JavaScript library providing high performance, intuitive, and easy to use data structures for manipulating and processing structured data.

Danfojs: powerful javascript data analysis toolkit What is it? Danfo.js is a javascript package that provides fast, flexible, and expressive data stru

JSdata 4k Dec 29, 2022
The lightweight library for manipulating and animating SVG

SVG.js A lightweight library for manipulating and animating SVG, without any dependencies. SVG.js is licensed under the terms of the MIT License. Inst

SVG.js 10k Dec 25, 2022
A lightweight JavaScript graphics library with the intuitive API, based on SVG/VML technology.

GraphicsJS GraphicsJS is a lightweight JavaScript graphics library with the intuitive API, based on SVG/VML technology. Overview Quick Start Articles

AnyChart 973 Jan 3, 2023
The lightweight library for manipulating and animating SVG

SVG.js A lightweight library for manipulating and animating SVG, without any dependencies. SVG.js is licensed under the terms of the MIT License. Inst

SVG.js 10k Jan 3, 2023
A lightweight JavaScript graphics library with the intuitive API, based on SVG/VML technology.

GraphicsJS GraphicsJS is a lightweight JavaScript graphics library with the intuitive API, based on SVG/VML technology. Overview Quick Start Articles

AnyChart 937 Feb 5, 2021
Financial lightweight charts built with HTML5 canvas

Lightweight Charts Demos | Documentation | Discord community TradingView Lightweight Charts are one of the smallest and fastest financial HTML5 charts

TradingView, Inc. 5.8k Jan 9, 2023
A simple and minimal, ultra-lightweight vanilla JS framework with 0 deps.

piss.js A simple and minimal, ultra-lightweight vanilla JS framework with 0 deps, containing one function, piss. This function has the background colo

grian 15 Oct 21, 2022
Lightweight, interactive planning tool that visualizes a series of tasks using an HTML canvas

Planner Lightweight, interactive planning tool that visualizes a series of tasks using an HTML canvas. Try it yourself at plannerjs.dev Plans created

Brian Vaughn 512 Jan 2, 2023
Java library for use with Chart.js javascript library

Chart.java Chart.java enables integration with the excellent Chart.js library from within a Java application. Usage example In Java: BarDataset datase

Marceau Dewilde 102 Dec 16, 2022