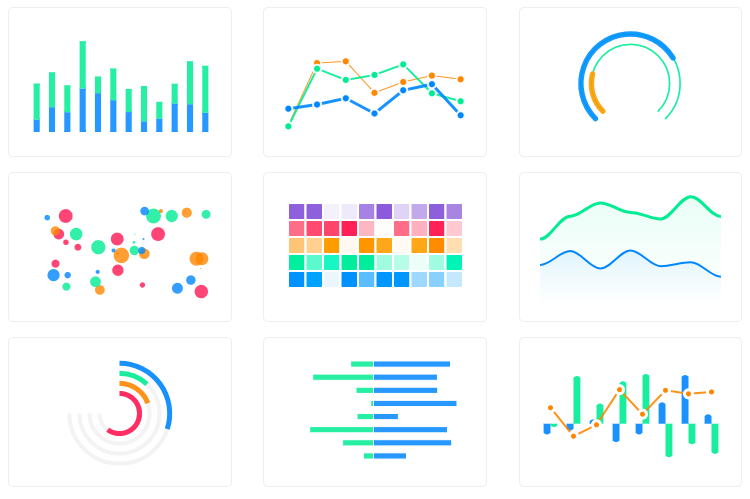
๐Ÿ“Š Interactive JavaScript Charts built on SVG

Overview

License build downloads ver size prettier jsdelivr

A modern JavaScript charting library to build interactive charts and visualizations with simple API.


Our Partner


ApexCharts is now a partner of FusionCharts to bring a wider range of data visualization components.
They offer data driven maps, gauges, widgets, advanced timeseries charts and much more.
Browsers support

Firefox
Firefox
Chrome
Chrome
Safari
Safari
Edge
Edge
IE
IE11
31+ โœ” 35+ โœ” 6+ โœ” Edge โœ” (IE11) โœ”

Download and Installation

Installing via npm
npm install apexcharts --save
Direct <script> include
<script src="https://cdn.jsdelivr.net/npm/apexcharts"></script>

Wrappers for Vue/React/Angular

Integrate easily with 3rd party frameworks

Unofficial Wrappers

Useful links to wrappers other than the popular frameworks mentioned above

Usage

import ApexCharts from 'apexcharts'

To create a basic bar chart with minimal configuration, write as follows:

var options = {
  chart: {
    type: 'bar'
  },
  series: [
    {
      name: 'sales',
      data: [30, 40, 35, 50, 49, 60, 70, 91, 125]
    }
  ],
  xaxis: {
    categories: [1991, 1992, 1993, 1994, 1995, 1996, 1997, 1998, 1999]
  }
}

var chart = new ApexCharts(document.querySelector('#chart'), options)
chart.render()

This will render the following chart

A little more than the basic

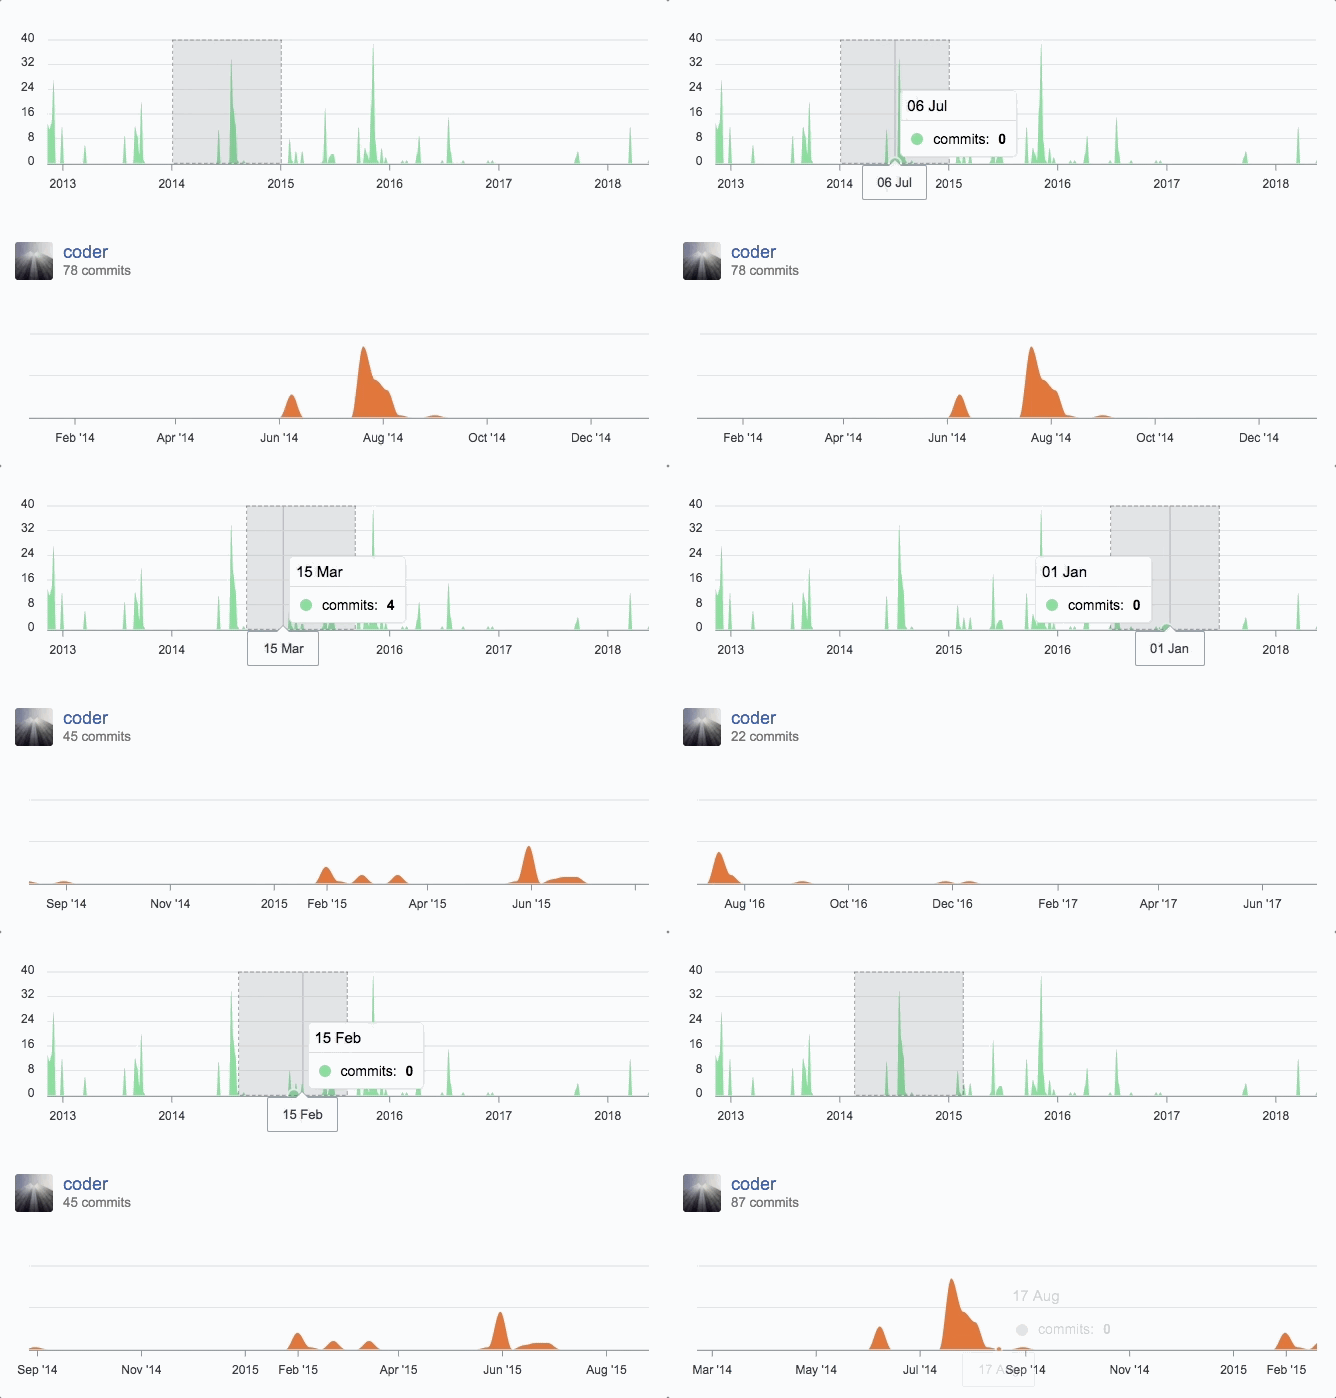
You can create a combination of different charts, sync them and give your desired look with unlimited possibilities. Below is an example of synchronized charts with github style.

Interactivity

Zoom, Pan, Scroll through data. Make selections and load other charts using those selections. An example showing some interactivity

interactive chart

Dynamic Series Update

Another approach to Drill down charts where one selection updates the data of other charts. An example of loading dynamic series into charts is shown below

dynamic-loading-chart

Annotations

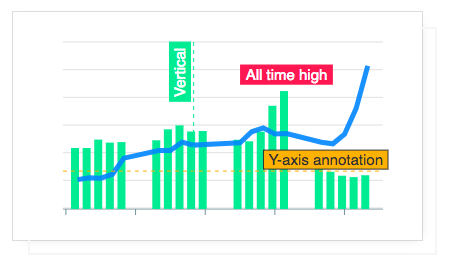
Annotations allows you to write custom text on specific values or on axes values. Valuable to expand the visual appeal of your chart and make it more informative.

annotations

Mixed Charts

You can combine more than one chart type to create a combo/mixed chart. Possible combinations can be line/area/column together in a single chart. Each chart-type can have it's own y-axis.

annotations

Candlestick

Use a candlestick chart (a common financial chart) to describe price changes of a security, derivative, or currency. Below image show how you can use another chart as a brush/preview-pane which acts as a handle to browse the main candlestick chart.

candlestick

Heatmaps

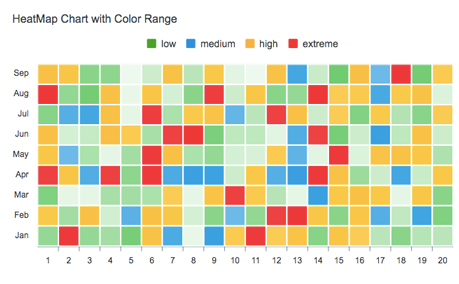
Use Heatmaps to represent data through colors and shades. Frequently used with bigger data collections, they are valuable for recognizing patterns and area of focus.

heatmap

Gauges

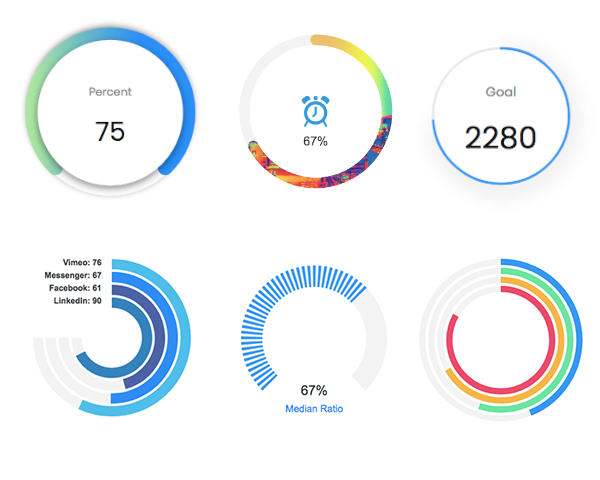
The tiny gauges are an important part of a dashboard and are useful in displaying single series data. A demo of these gauges:

radialbar-chart

Sparklines

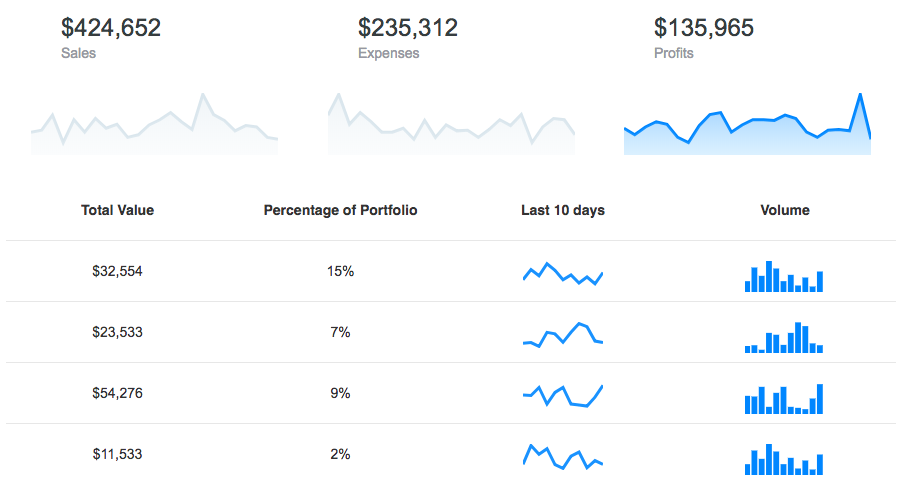
Utilize sparklines to indicate trends in data, for example, occasional increments or declines, monetary cycles, or to feature most extreme and least values:

sparkline-chart

More advanced chart types from our friends at FusionCharts

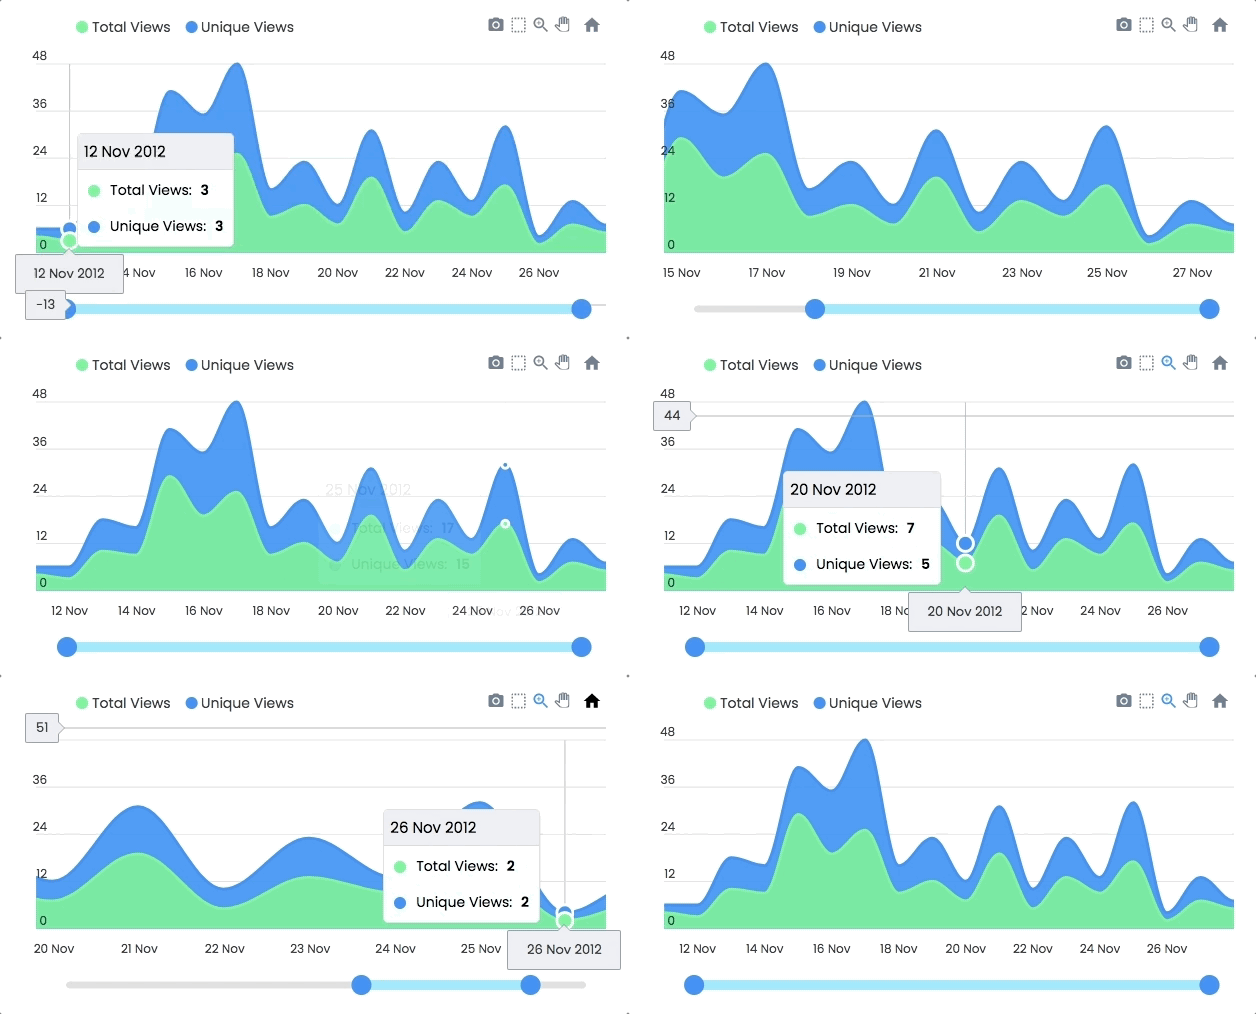
Thanks to our friends at FusionCharts, you now have a better data experience of your time-series data with features like visual time navigator, annotations with the date and event markers, multi-variate analysis, and real-time support.

time-series

Export full dashboards

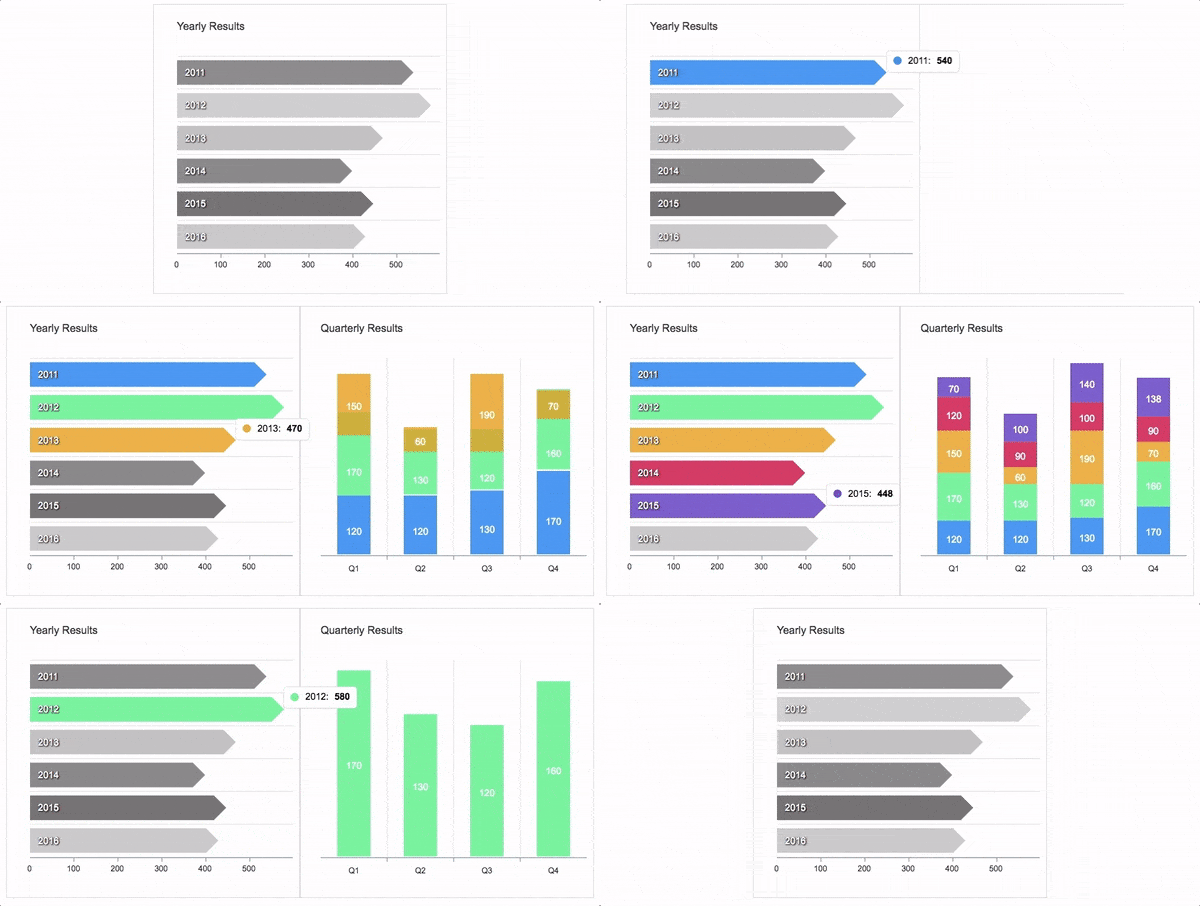
Want to export your dashboards to PDF, send them via email or simply export a chart on the server-side? You can do these and more with FusionExport, a new product from our friends at FusionCharts.

fusionexport

What's included

The download bundle includes the following files and directories providing a minified single file in the dist folder. Every asset including icon/css is bundled in the js itself to avoid loading multiple files.

apexcharts/
โ”œโ”€โ”€ dist/
โ”‚   โ””โ”€โ”€ apexcharts.min.js
โ”œโ”€โ”€ src/
โ”‚   โ”œโ”€โ”€ assets/
โ”‚   โ”œโ”€โ”€ charts/
โ”‚   โ”œโ”€โ”€ modules/
โ”‚   โ”œโ”€โ”€ utils/
โ”‚   โ””โ”€โ”€ apexcharts.js
โ””โ”€โ”€ samples/

Using it with IE11

If you need to make it work with IE11, you need to include these polyfills before including ApexCharts

Development

Install dependencies and run project

npm install
npm run dev

This will start the webpack watch and any changes you make to src folder will auto-compile and output will be produced in the dist folder.

Minifying the src

npm run build

Where do I go next?

Head over to the documentation section to read more about how to use different kinds of charts and explore all options.

Contacts

Email: [email protected]

Twitter: @apexcharts

Facebook: fb.com/apexcharts

Dependency

ApexCharts uses SVG.js for drawing shapes, animations, applying svg filters and a lot more under the hood. The library is bundled in the final build file, so you don't need to include it.

Supporting ApexCharts

ApexCharts is an open source project. Financial contributions to ApexCharts go towards ongoing development costs, servers, etc. You can help by becoming a supporter on Patreon or doing a one time donation on PayPal

Our Partners


While ApexCharts brings you the goodness of open-source charts, FusionCharts offers additional visualizations for your dashboards. With extensive documentation, consistent API, and cross-browser support, FusionCharts is loved by 28,000+ customers and 750,000+ developers across the globe.

License

ApexCharts is released under MIT license. You are free to use, modify and distribute this software, as long as the copyright header is left intact.

Comments
  • chart.updateSeries() doesn't update X Axis.

    chart.updateSeries() doesn't update X Axis.

    I load in new data but the X axis values (the vertical values representing, in my case, price data values) don't update according to the new data. Am I doing something wrong? Thanks.

    opened by GalacticSun 31
  • Connect values between null points in Line Chart

    Connect values between null points in Line Chart

    Connect values between null points in Line/Area Chart

    This PR regards #747. It adds a new spanNullValues option to chart.

    See apexcharts.js/samples/vanilla-js/line/basic-line.html for a working example. Just a first, somewhat naive approach to implement this feature. I'm sure as the creator of Apexcharts, you have plenty of tips on how to optimize.

    Type of change

    • [x] New feature (non-breaking change which adds functionality)
    • [x] This change requires a documentation update

    Checklist:

    • [x] My code follows the style guidelines of this project
    • [x] I have performed a self-review of my own code
    • [x] I have commented my code, particularly in hard-to-understand areas
    • [x] My changes generate no new warnings
    • [x] New and existing unit tests pass locally with my changes

    Existing tests

    Test Suites: 8 passed, 8 total
    Tests:       16 passed, 16 total
    
    opened by cseelus 30
  • Mobile: Impossible to pan/zoom selection/selection

    Mobile: Impossible to pan/zoom selection/selection

    Touching the screen only permits to see the points on the yaxis. Maybe not if tooltip's shared property is set to false, it's sometimes non sense to set shared to false.

    Also, this is certainly related to the fact that it's not well supported yet, but when touching and moving to try to get the value expected, on iOS it unselect the point really easily. As such, there's no other choice than removing toolbar for mobile users as it's frustrating.

    feature-request no-issue-activity 
    opened by arkhenstone 29
  • Make Chart Margins and Padding Optional/Adjustable

    Make Chart Margins and Padding Optional/Adjustable

    Is your feature request related to a problem? Please describe.

    We have removed the left axis labels, but can't left-align the chart because the entire element has been translated:

    <g class="apexcharts-inner apexcharts-graphical" transform="translate(20, 30)">
    

    screen shot 2018-10-28 at 1 11 05 pm

    • Red Line: This is the left SVG bound, where we would like to align the chart.
    • Green Line: This is where the chart begins because of the translate. Margin should be optional
    • Blue Line: This is where the series data starts, this data should also be optional
    • Orange Lines: The same data padding on the right side should be optional

    Describe the solution you'd like

    Give options to remove/adjust these margins/padding (currently the only way is to use Sparklines, but this limits other options)

    Describe alternatives you've considered

    Forking repo; manual/external CSS overrides; masking with external elements; etc

    Additional context

    n/a

    feature-request 
    opened by benhaynes 28
  • fix autoScale option

    fix autoScale option

    previous version was not the correct version, sorry for the inconvenience. _initialize min and max with the first value of selection range _add null values exception

    New Pull Request

    I'm so sorry, I forgot to push my local changes before making the previous pull request. The previous version was just not working at all (but didn't create new bugs) I tested this version and it works totally! Sorry again for the inconvenience

    Fixes # (246)

    Type of change

    • [x] Bug fix (non-breaking change which fixes an issue)

    Checklist:

    • [x] My code follows the style guidelines of this project
    • [x] I have performed a self-review of my own code
    • [x] My changes generate no new warnings
    • [x] New and existing unit tests pass locally with my changes
    opened by AurelReb 26
  • Multiple Y Axes - Assign Series to specific Y Axis

    Multiple Y Axes - Assign Series to specific Y Axis

    After studying the doc on multiple y-axes I haven't found a way to directly link a series to a specified y-axis (for example through an axis Identifier). Currently, the only option seems to be to create as many y-axes in the options as I have series. However, the number of series in my case depends on the user input.

    feature-request 
    opened by richardpolzer 26
  • Did you removed option for rounded bar chart??

    Did you removed option for rounded bar chart??

    Hi, I am using bar chart. In your previous version of vue-apexcharts I had rounded bar charts. But as I updated to latest version. I lost my rounded corners in my bar chart. I checked your docs I can not find option I used previously.

    ...
    endingShape: 'rounded',
    ...
    

    Before(ver 1.2.8): sdf Now: sdfdf I have same code. I havn't changed any parameter in chart options.

    ~ Regards

    high-priority 
    opened by jsinhSolanki 25
  • How can I draw an area chart from y.min to y.max values (Range Area Charts)

    How can I draw an area chart from y.min to y.max values (Range Area Charts)

    Basic area charts are drawn from x-axis (from zero) to some value, but I need to draw an area of min-max ranges. Someshing like on the attached picture. Can I achieve that with apexcharts? area

    feature-request 
    opened by Dimanoid 24
  • x-axis is displayed as local datetime instead of UTC

    x-axis is displayed as local datetime instead of UTC

    (This may or may not be related to #95)

    First of all, I assume that I've miss-configured something, but my X-axis appears to always be shown as local time instead of UTC. I tried using both timestamp (1536104489000) and datetime (2018-09-04 23:41:29) as x-axis data.

    The first entry in the raw data is 1536104489000 (2018-09-04T23:41:29) but when viewed it shows up as 2018-09-05 01:41:29. I am in a UTC+2 timezone.

    Is it possible that Apexcharts or underlying frameworks somehow converts my UTC data into local timezone? If so, is it possible to turn it off?

    PS: Thank you so much for Apex :) I love it

    opened by tforssander 24
  • Loading using Require.js (AMD) broken

    Loading using Require.js (AMD) broken

    Codepen

    Just open this codepen and check the dev-console (F12):

    image

    Explanation

    I think that SVG is not defined because there is something wrong on module bundler. Do i need to include SVG.js as external library?

    bug 
    opened by Micene09 23
  • X axis labels are still misaligned

    X axis labels are still misaligned

    Codepen

    https://codepen.io/jimfilippou-the-animator/pen/VEBrwe

    Explanation

    I believe this was an older issue which wasn't fixed. I am aware that using labels: [1,2,3,4,5,6,7,8,9] will solve the problem, but this is not a solution since the default behavior should align the x-axis properly. What do you suggest wise man? ๐Ÿ’ฏ

    Removing paddings is not a solution

    • What is the behavior you expect? untitlee

    • What is happening instead? untitled

    • What error message are you getting? No error message.

    opened by jimfilippou 23
  • Fix issues with empty tooltip being shown and console errors when setting 'between' for xAxis.tickPlacement on certain charts

    Fix issues with empty tooltip being shown and console errors when setting 'between' for xAxis.tickPlacement on certain charts

    New Pull Request

    This fixes an issue where the getNearestValues function in src/modules/tooltip/Utils.js doesn't handle cases where the config.xaxis.tickPlacement option has a value of 'between'. This results in the incorrect point being returned when globals.comboCharts is false. It can also return an out of bounds index when globals.comboCharts is true and the cursor is near the end of the x axis, causing unhandled errors when building tooltips.

    Fixes #3521

    Type of change

    Please delete options that are not relevant.

    • [x ] Bug fix (non-breaking change which fixes an issue)

    Checklist:

    • [x ] My code follows the style guidelines of this project
    • [x ] I have performed a self-review of my own code
    • [x ] I have commented my code, particularly in hard-to-understand areas
    • [x ] My changes generate no new warnings
    • [x ] New and existing unit tests pass locally with my changes
    opened by nikkorn 0
  • xAxisLabelClick not working on radar chart

    xAxisLabelClick not working on radar chart

    Description

    The xAxisLabelClick event is not working on radar charts. Related issue.

    Steps to Reproduce

    1. Set chart type to radar
    2. Add a xAxisLabelClick event that fires a function:
        events: {
          xAxisLabelClick: (event, chartContext, config) => {
            alert("clicked!");
          }
        }
    
    1. Click on the label

    Expected Behavior

    Function should be called when clicking on x-axis label

    Actual Behavior

    Nothing happens when clicking on x-axis label.

    Reproduction Link

    https://codepen.io/devilcius/pen/WNKoboB

    bug 
    opened by devilcius 0
  • Grid lines for x-axis don't work after update from 3.35.0 to 3.36.3

    Grid lines for x-axis don't work after update from 3.35.0 to 3.36.3

    Description

    Missing vertical lines (x-axis) in grid in line chart

    Steps to Reproduce

    1. Create standard line chart
    2. Add grid lines for x-axis in options (like in documentation): grid: { xaxis: { lines: { show: true } } }

    Expected Behavior

    Should display full grid, but still missing vertical lines

    Actual Behavior

    Missing vertical lines

    Screenshots

    In 3.35.0:

    image

    In 3.36.3:

    image

    Reproduction Link

    https://codesandbox.io/s/vue-xaxis-grid-bug-sjkh9s

    bug 
    opened by serwerin 1
  • horizontal bar chart - total dataLabel overflow on stackType 100%

    horizontal bar chart - total dataLabel overflow on stackType 100%

    Description

    When creating a horizontal 100% stacked bar chart with a total-dataLabel, the dataLabel gets cut off.

    Steps to Reproduce

    1. create a horizontal 100% stacked bar chart (chart.stacked = true, chart.stackType = "100%", plotOptions.bar.horizontal = true)
    2. enabled total-datalabels (plotOptions.bar.dataLabels.total.enabled = true) => total dataLabel gets cut off

    Expected Behavior

    The chart adds a right padding dependent on the max dataLabel width.

    Actual Behavior

    The total-dataLabel gets positioned right of the bar and gets cut off, because it overflows.

    Screenshots

    chrome_CTOZi7kLSm

    Reproduction Link

    https://codepen.io/moddesteni/pen/vYaKJQq

    Workaround

    Defining a manual offset via grid.padding.right works as a workaround, but depending on the data it can still get cut off, if a big number is needed to be shown.

    bug 
    opened by delphi-sucks 0
  • horizontal bar chart - total dataLabels not centered

    horizontal bar chart - total dataLabels not centered

    Description

    When creating a horizontal bar chart with total dataLabels, the labels aren't centered. They only get centered if the dataLabels (not total) are enabled.

    Steps to Reproduce

    1. create a horizontal bar chart (chart.stacked = true, plotOptions.bar.horizontal = true)
    2. enabled the total-dataLabels (plotOptions.bar.dataLabels.total.enabled = true)
    3. disable the normal dataLabels (dataLabels.enabled = false) => total-dataLabel isn't vertically centered

    Expected Behavior

    Total dataLabels are center aligned even if dataLabels are not shown (see Screenshot).

    Actual Behavior

    Total dataLabels are aligned to the top of the bar if dataLabels are not shown (see Screenshot).

    Screenshots

    Broken

    chrome_SuL4h4NhdK

    "Works"

    chrome_FhgPgwjqpx

    Reproduction Link

    https://codepen.io/moddesteni/pen/wvxWqEM

    bug 
    opened by delphi-sucks 0
  • vertical line chart

    vertical line chart

    Summary

    Add vertical line chart. Map of current line chart but rotated 90 degrees, a la https://recharts.org/en-US/examples/VerticalLineChart. Line analog of Bar vs Column chart.

    API Changes

    Naming suggestion would be "type: 'vline". All other options identical to LineChart.

    Intended Use Case

    In scientific disciplines its is very common to plot vertical profiles where data vary with elevation/depth/height as this intuitive orientation of the data (e.g. https://en.wikipedia.org/wiki/Atmospheric_temperature http://www-odp.tamu.edu/publications/199_IR/chap_12/c12_f41.htm) . We've vertical profile data that vary in just such a manner that we would like to plot as so.

    feature-request 
    opened by ngodber 0
Releases(v3.36.0)
  • v3.36.0(Oct 23, 2022)

    ๐Ÿ†• Enhancements

    • New chart-type: RANGE AREA CHART - Example
    Screenshot 2022-10-08 at 12 04 36 PM
    • Allow fill config to be passed with individual data-point in a XY series
    • Total data label in a stacked bar/column chart - Example

    ๐Ÿž Bug Fixes

    • Fix x-axis labels overlap when all series are collapsed
    • Fix text-anchor in horizontal bars if a negative value is present
    • Fix deselect first series exports empty CSV; Thanks Luca Tognazzi
    Source code(tar.gz)
    Source code(zip)
  • v3.35.0(Mar 31, 2022)

  • v3.34.0(Mar 30, 2022)

    ๐Ÿ†• Enhancements

    ๐Ÿž Bug Fixes

    • Fix bugs with collapsed series data on updating options/series - Thanks, @tkieft
    • Fix bug when value below 1 in log scale - Thanks, @blerman
    • Improve shared tooltip position in bar charts and heatmap charts
    • Refactor annotations code

    Misc changes

    • Added LV Locale - Thanks, @snemvalts
    Source code(tar.gz)
    Source code(zip)
  • v3.33.0(Jan 11, 2022)

    ๐Ÿ†• Enhancements

    • Prevent tooltip overflow outside the chart area
    • Fix empty tooltip; fixes #2851
    • Disable tooltip if all datasets are hidden - fixes #2566
    • Bar and Heatmap tooltip improvements

    ๐Ÿž Bug Fixes

    • Fix for not rendering 0 as min when using logarithmic, thanks @rubenstolk
    • Fix tooltip bug when 1st series is hidden; fixes #2744
    • Fix boxplot with multiple outliers - fixes #2706
    • Fix runtime error if tooltip not present
    • Marker size bug - fixes #2872
    • Tooltip bug; fixes #2879
    Source code(tar.gz)
    Source code(zip)
  • v3.32.0(Jan 11, 2022)

    ๐Ÿž Bug Fixes

    • fixing regression bug that was caused by commit e153a2
    • fix distributed and inversed color scale - fixes #2808
    • check if lastDataLabelRect exists in bar charts
    Source code(tar.gz)
    Source code(zip)
  • v3.31.0(Nov 28, 2021)

  • v3.30.0(Nov 13, 2021)

    Enhancements

    • Replace old DetectElementResize script with ResizeObserver, fixes #1332, #2743
    • Inject ApexCharts CSS to shadow root if weโ€™re in a shadow DOM context, fixes #238
    • Debounce tooltip mouse events to reduce overhead

    ๐Ÿž Bug Fixes

    • Hover-active filter bugfix; fixes #2776
    • Hash presence in CSV export; fixes #2665
    • ToggleSeries bugfix for boxplots; fixes #2672
    • Combo chart type bug fix; fixes #2388
    • Return promise in updateOptions and updateSeries; fixes #2642
    • Point-annotation position fix when x-axis is category; fixes #2646
    • Remove radial-bar extra space in firefox; fixes #1243
    • Export to png bug fix; fixes #1671
    • Bugfix: y-axis annotation labels are placed at the wrong y-coordinate at the top of the graph; fixes #2770
    • Add a null check to prevent errors on Safari mobile
    Source code(tar.gz)
    Source code(zip)
  • v3.28.2(Sep 16, 2021)

    Enhancements

    • Allow HTML in legend while also sanitizing inputs for XSS vulnerability - fixes #2214, fixes #2463, fixes #2202
    • Added support for series-specific border-radius on a bar chart
    • Improve goals marker drawing options in bars/columns

    ๐Ÿž Bug Fixes

    • Fix legend class names to prevent conflict with other libraries
    • svg.js namespace issue - fixes #2571
    Source code(tar.gz)
    Source code(zip)
  • v3.28.1(Sep 16, 2021)

  • v3.27.3(Jul 22, 2021)

  • v3.27.0(Jun 6, 2021)

    ๐Ÿ†• Enhancements

    • New feature - bar/column with markers fc3noor2 (2)

    ๐Ÿž Bug Fixes

    • Add title element for Y-axis labels. #2281
    • Sanitize input to prevent cross-site scripting
    Source code(tar.gz)
    Source code(zip)
  • v3.26.3(May 18, 2021)

    ๐Ÿ†• Enhancements

    • New prop - xaxis.overwriteCategories which allows t overwrite all generated x-axis labels and replace with custom labels
    • Add scaling options while exporting to SVG/PNG - Thanks, Antonio Rezende
    Source code(tar.gz)
    Source code(zip)
  • v3.26.2(May 9, 2021)

    ๐Ÿ†• Enhancements

    • New prop - xaxis.decimalsInFloat

    ๐Ÿž Bug Fixes

    • Data-label overflow - fixes #2264
    • Fix missing first label on the x-axis bar graph - fixes #1730
    • Fix y-axis title cropped - fixes #2394
    Source code(tar.gz)
    Source code(zip)
  • v3.26.1(Apr 18, 2021)

    ๐Ÿ†• Enhancements

    • Add start and end dates in rangeBar tooltip options in a custom tooltip
    • Heatmap reverseNegativeShade issue - fixes #1704
    • Add hungarian locale - thanks, @MartinKravec
    • New feature in TimeScale: added seconds scale - thanks, @nekitk

    ๐Ÿž Bug Fixes

    • CSV export fix - fixes #2295
    • Check circle radius if less than 0
    • Fix treemap data update - fixes #2356
    • Datalabel type fix - fixes #2355
    • Combo candlestick tooltip issue - fixes #2354
    • Prevent hiding 1st x-label when y-axis is hidden in bar charts
    Source code(tar.gz)
    Source code(zip)
  • v3.26.0(Mar 15, 2021)

    ๐Ÿ†• Enhancements

    • Add square for marker shape
    • Allow shared tooltip in a horizontal bar chart
    • New property - borderRadius in bar charts; fixes #2291

    ๐Ÿž Bug Fixes

    • Fix polar area spokes position when startAngle is custom
    • Fixed y-axis formatter not working when range contains zero. Thanks, @venarius
    • Fix for #1629, adds BOM to CSV export
    • Forcing the DataLabel to be drawn only within the boundaries of the chart
    Source code(tar.gz)
    Source code(zip)
  • v3.23.1(Dec 28, 2020)

    ๐Ÿž Bug Fixes

    • Panning fixed in timeline charts
    • Mixed chart x-axis issue - fixes #2064
    • A small correction in y-axis min-max - fixes #538
    • Preserve selection on resize in pie, donut - fixes #2110
    • Floating y-axis in bar and timelines - fixes #2123
    • TooltipHoverFormatter in pie charts - fixes #2122
    Source code(tar.gz)
    Source code(zip)
  • v3.23.0(Dec 15, 2020)

    ๐Ÿ†• Enhancements

    • Zoom and Pan enabled in timeline charts - fixes #763

    ๐Ÿž Bug Fixes

    • Fix export to csv when timestamps are provided - fixes #2101
    • Bigfix in min/max functions in y-axis - fixes #538, fixes #2098
    • Improve logscale
    Source code(tar.gz)
    Source code(zip)
  • v3.22.3(Dec 6, 2020)

    ๐Ÿ†• Enhancements

    • Customizable export filenames - fixes #2042
    • Show x-axis gridlines even when x-axis labels are hidden - fixes #2089

    ๐Ÿž Bug Fixes

    • Fix undefined tooltip issue in a timeline chart
    • Remove resize handler properly on destroy - fixes #2020
    • CSV bug export when category contains a comma - fixes #2036
    • Fix multiline text in x-axis when using XY format in series - fixes
    • Add passive: true to event listeners - ref #937
    • Fix auto height increase when the height is 100% - fixes #2059
    • Fix log scale in radar chart - fixes #2078
    • Remove code to hide data label when it is cropped
    • Add tooltip title formatter for horizontal chart
    • Bugfix when no data in treemap - fixes #2090
    • Bug fix in min/max functions in y-axis - fixes #538
    • Fix Y-axis tickamount when formatter is applied - fixes #2086
    Source code(tar.gz)
    Source code(zip)
  • v3.22.2(Dec 6, 2020)

    ๐Ÿ†• Enhancements

    • Semi donut - New property endAngle in pie to create semi donut charts
    • allow legendClick to run even when toggleDataSeries is off - fixes #835
    • Add seriesIndex for pie/donut tooltips formatter

    ๐Ÿž Bug Fixes

    • bug-fix for long x-axis labels causing left padding - fixed #1989
    • Gradient bug fix - fixes #2026
    • Fix resize issue - eventlistener not being removed on destroy - fixes #2020
    Source code(tar.gz)
    Source code(zip)
  • 3.22.1(Nov 1, 2020)

    ๐Ÿ†• Enhancements

    • Add min/maxSecond to DateTime.getTimeUnitsfromTimestamp() - Thanks, @jessecrossley
    • New property redrawOnWindowResize which allows you to control whether the chart should update when the window size changes. This is different from redrawOnParentResize which just checks for parent container resize events.
    • Re-add ESM build as requested by many users.

    ๐Ÿž Bug Fixes

    • Prevent duplicate values on the y-axis - fixes #1960
    • Fixed circle chart size when show legend - Thanks, @FunkiR
    • Polar-area chart maxY bug fix
    Source code(tar.gz)
    Source code(zip)
  • 3.22.0(Oct 3, 2020)

    ๐Ÿ†• Enhancements

    • Add a flag to group rows together (rangeBarGroupRows) in a multi-series timeline chart - thanks, @kgram007
    • New event - beforeResetZoom
    • dateformatter option added in xaxis.labels.formatter to allow the user to format dates when using xaxis.labels.formatter

    ๐Ÿž Bug Fixes

    • Corrected shade color in heatmap - fixes #1916
    • X-axis title color - fixes #1922
    • Treemap drop shadow; check the series length in theme - fixes #1935
    • Prevent legend to take up all space - fixes #1835
    • Stacked data labels bug fix - fixes #1951

    Misc changes

    • Add Simplified Chinese (zh-cn) locale. - Thanks, @f0rb1d
    Source code(tar.gz)
    Source code(zip)
  • 3.21.0(Sep 20, 2020)

    ๐Ÿ†• Enhancements

    • New chart type TREEMAP added ๐Ÿ”ฅ
    • New event when scrolling on brush chart. chart.events.brushScrolled

    ๐Ÿž Bug Fixes

    • Bug fix in hideSeries - fixes #1901
    • Check window.Apex before resetting it - fixes #1909
    Source code(tar.gz)
    Source code(zip)
  • v3.20.2(Sep 11, 2020)

  • v3.20.1(Sep 8, 2020)

    ๐Ÿ†• Enhancements

    • Category tick-amounts implemented; improve axes utils - fixes #939
    • Add a seriesName attribute in legend for easier CSS access - fixes #1883

    ๐Ÿž Bug Fixes

    • Fix bugs when x-axis values are duplicated - fixes #1826
    • Prevent scrollToTop when clicking on the chart - fixes #1825
    • Add check for series in Candlestick in mixed charts - fixes #1840
    • Add check for baseEl which throws undefined error while destroying
    • Fix tooltip.inverseOrder - fixes #1402
    • Annotations bug fix - fixes apexcharts/vue-apexcharts#279
    • Remove forceful series injection while updating - fixes #1875
    • Using fillColor in series.data should show correct color in tooltip - fixes #1668
    Source code(tar.gz)
    Source code(zip)
  • v3.20.0(Jul 31, 2020)

    ๐Ÿ†• Enhancements

    • Preserve order of series and data-labels - fixes #1709
    • Allow user to select a color series wise for axis charts
    • Preserve y-axis min/max on update
    • Remove unnecessary condition in tooltip check - fixes #1720

    ๐Ÿž Bug Fixes

    • Bugfix in the time difference in chrome and safari - fixes #1726, fixes #1544,
    • Mixed chart null values fix - fixes #1389
    • Bugfix in destroy function - fixes apexcharts/vue-apexcharts#256
    • Make chart's height equal whether the legend is present or not - fixes #1414
    • Fix marker colors in stacked charts - fixes #1725
    • Marker color fill and stroke for 1st point - fixes #1742
    • Fix y-axis title rotate bug - fixes #1766
    • Breaking change - remove annotations.shape
    • Fix legend click issue when panning is enabled - fixes #1474
    • Remove esm build as it breaks all other wrapper libs
    • ShowDuplicates bug in x-axis - fixes #1729
    • Remove comma from the multiline x-axis title tag
    • Timeline gridline drawing fix when xaxis.labels.formatter is present
    • Fix unhandled error when toggling visibility - Thanks, @mattkhaw
    Source code(tar.gz)
    Source code(zip)
  • v3.19.3(Jun 26, 2020)

    ๐Ÿ†• Enhancements

    • Configurable CSV options - fixes #1527
    • In area charts, allow fill to extend to bottom for negative values - fixes #1472
    • In the tooltip, remove default colon to allow customization - fixes #1660
    • Draw lines as shape annotations - Thanks, @Clint-Chester
    • Radar chart size based on x-axis labels width - fixes #1663

    ๐Ÿž Bug Fixes

    • Modify sort function to fix tooltip color in firefox - fixes #1624
    • Set HeatMap's baseline color appropriately for dark mode - Thanks, @short2strings
    • Fixed exported background for the dark theme - fixes #1669
    • Candlestick reset zoom fix; Also fixes the series issue when cloned - fixes #1679
    • fix backgroundBarColors - fixes #1375
    • logscale fix for multiple charts - fixes #1335
    • tooltip.marker.fillColors - fixes #1618
    • remove min-height on destroy - fixes #1654
    • prevent animation on each render in bubble chart - fixes #1670
    • background option in pie data-labels - fixes #1625
    • csv datetimeformatter - fixes #1647

    Misc

    • Add Albanian locale. Thanks, @sirdree
    Source code(tar.gz)
    Source code(zip)
  • v3.19.2(May 19, 2020)

  • v3.19.1(May 19, 2020)

    ๐Ÿ†• Enhancements

    • New property in pie/donut - plotOptions.pie.startAngle. Thanks, @YtGz

    ๐Ÿž Bug Fixes

    • Prevent brush selection to go outside pane - fixes #738, fixes #1459
    • Fix tooltip position for numerical bar charts
    • Opposite y-axis should not shift the left position of chart beyond 0 - fixes #1599
    • Fix for single data-point stacked bar charts - fixes #1617
    • Fixed an issue where null values in a series were converted to {}
    • Fix a bug in pie chart to allow single values - references #1611
    Source code(tar.gz)
    Source code(zip)
  • v3.19.0(Apr 23, 2020)

    ๐Ÿ†• Enhancements

    • New property - borderRadius in annotation label

    ๐Ÿž Bug Fixes

    • Pie/donut chart - toggledatapointselection issue - fixes #1464
    • X-axis timescale fix - fixes #1478
    • Y-axis labels colors issue - fixes #1490
    • Prevent mutating original series when hiding through legend. Fixes thin bar issues when series is hidden and reset zoom is pressed.
    • Allow disabling y-axis tooltip in a multi-yaxes chart - fixes #1482
    • showSeries method fix for stacked bar charts - fixes #1517
    • Prevent drawing marker outside drawing area - fixes #1520
    • Sync zoom and pan tools in synced charts - fixes #1530
    • Change the dark theme color - references #218
    • Data-labels bug fixes in bar charts - fixes #1524
    • Grid line fixes for bar charts

    Misc changes

    • Fix wrong polish translation of zoomOut - Thanks, @fracz
    Source code(tar.gz)
    Source code(zip)
  • v3.18.1(Apr 23, 2020)

    ๐Ÿž Bug Fixes

    • Update source chart on panning target chart - fixes #957
    • Brush chart - prevent resetting brush to initial position - fixes #1104
    • Distributed bar colors - fixes #1463; fixes #1468

    Misc changes

    • Added Hebrew local file - Thanks @meirroth
    • Add a missing key in th.json local - @Saharak-Dove
    Source code(tar.gz)
    Source code(zip)
JavaScript diagramming library for interactive flowcharts, org charts, design tools, planning tools, visual languages.

GoJS, a JavaScript Library for HTML Diagrams GoJS is a JavaScript and TypeScript library for creating and manipulating diagrams, charts, and graphs. S

Northwoods Software Corporation 6.6k Dec 30, 2022
Beautiful and interactive javascript charts for Java-based web applications.

Wicked Charts Beautiful and interactive JavaScript charts for Java-based web applications. Check out the Changelog Check out the Feature Overview with

adesso SE 85 Aug 23, 2022
Simple, responsive, modern SVG Charts with zero dependencies

Frappe Charts GitHub-inspired modern, intuitive and responsive charts with zero dependencies Explore Demos ยป Edit at CodePen ยป Contents Installation U

Frappe 14.6k Jan 4, 2023
Progressive pie, donut, bar and line charts

Peity Peity (sounds like deity) is a jQuery plugin that converts an element's content into a mini <svg> pie, donut, line or bar chart. Basic Usage HTM

Ben Pickles 4.2k Jan 1, 2023
Javascript Canvas Library, SVG-to-Canvas (& canvas-to-SVG) Parser

Fabric.js Fabric.js is a framework that makes it easy to work with HTML5 canvas element. It is an interactive object model on top of canvas element. I

Fabric.js 23.6k Jan 3, 2023
Javascript Canvas Library, SVG-to-Canvas (& canvas-to-SVG) Parser

Fabric.js Fabric.js is a framework that makes it easy to work with HTML5 canvas element. It is an interactive object model on top of canvas element. I

Fabric.js 23.6k Jan 3, 2023
๐Ÿ“Š A highly interactive data-driven visualization grammar for statistical charts.

English | ็ฎ€ไฝ“ไธญๆ–‡ G2 A highly interactive data-driven visualization grammar for statistical charts. Website โ€ข Tutorial Docs โ€ข Blog โ€ข G2Plot G2 is a visua

AntV team 11.5k Dec 30, 2022
Financial lightweight charts built with HTML5 canvas

Lightweight Charts Demos | Documentation | Discord community TradingView Lightweight Charts are one of the smallest and fastest financial HTML5 charts

TradingView, Inc. 5.8k Jan 9, 2023
Attractive JavaScript charts for jQuery

flot About flot is a JavaScript plotting library for engineering and scientific applications derived from Flot: http://www.flotcharts.org/ Take a look

Flot 5.9k Dec 22, 2022
A plugin for the jQuery javascript library to generate small sparkline charts directly in the browser

jQuery Sparklines This jQuery plugin makes it easy to generate a number of different types of sparklines directly in the browser, using online a line

Gareth Watts 1.2k Jan 4, 2023
Create beautiful charts with one line of JavaScript

Chartkick.js Create beautiful charts with one line of JavaScript See it in action Supports Chart.js, Google Charts, and Highcharts Also available for

Andrew Kane 1.2k Jan 2, 2023
Ember Charts 3.5 2.3 L2 JavaScript A powerful and easy to use charting library for Ember.js

Ember Charts A charting library built with the Ember.js and d3.js frameworks. It includes time series, bar, pie, and scatter charts which are easy to

Addepar 793 Dec 7, 2022
Reusable JavaScript library for creating sketchy/hand-drawn styled charts in the browser.

roughViz.js is a reusable JavaScript library for creating sketchy/hand-drawn styled charts in the browser, based on D3v5, roughjs, and handy. Why? Use

Jared Wilber 6.4k Jan 4, 2023
Create beautiful JavaScript charts with one line of React

React Chartkick Create beautiful JavaScript charts with one line of React See it in action Supports Chart.js, Google Charts, and Highcharts Quick Star

Andrew Kane 1.2k Dec 28, 2022
Create beautiful JavaScript charts with one line of Ruby

Chartkick Create beautiful JavaScript charts with one line of Ruby. No more fighting with charting libraries! See it in action Chartkick 4.0 was recen

Andrew Kane 6.1k Jan 8, 2023
Emprise Javascript Charts

EJSChart 100% Powerful, Clean & Functional Javascript Charts Whether at home, a medium sized or enterprise venture, EJSCharts will seamlessly help you

Emprise Corporation 34 Jun 3, 2021
A simple script for pure javascript charts.

MK Charts A simple pure Javascript for displaying circle charts. Demo: https://mkirschen.de/mk-scripts/mk-charts/ Circle charts To insert a chart all

Marcus Kirschen 6 Dec 14, 2022
Simple HTML5 Charts using the tag

Simple yet flexible JavaScript charting for designers & developers Documentation Currently, there are two versions of the library (2.9.4 and 3.x.x). V

Chart.js 59.4k Jan 7, 2023
Simple responsive charts

Big welcome by the Chartist Guy Checkout the documentation site at http://gionkunz.github.io/chartist-js/ Checkout this lightning talk that gives you

Gion Kunz 26 Dec 30, 2022