Planner
Lightweight, interactive planning tool that visualizes a series of tasks using an HTML canvas.

Try it yourself at plannerjs.dev
Plans created with Planner are automatically saved to the URL and can be easily shared with others.
If you like this project
Examples
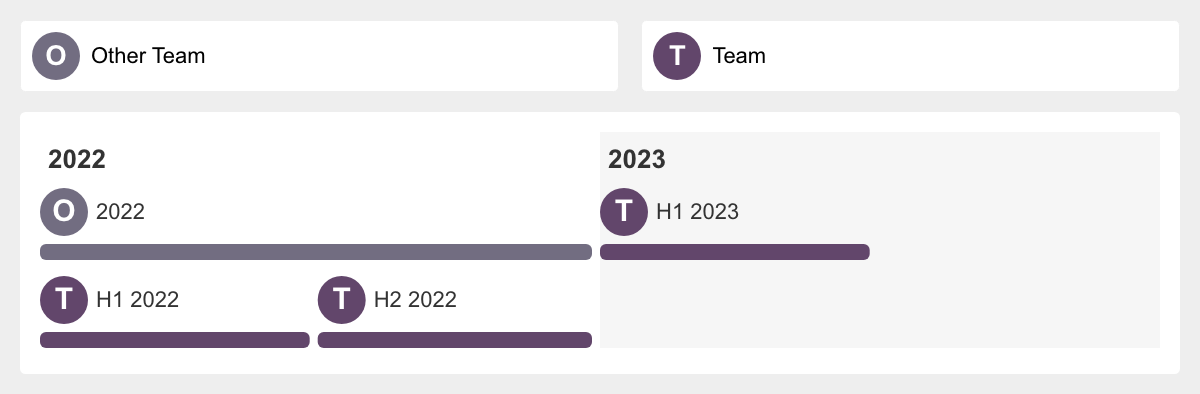
View years example
View months example

View weeks example

View days example

Converting legacy plans
Planner switched from jsurl2 to Base64 encoding due to URL parsing problems jsurl2 caused websites like Twitter. If you created a plan with using the old jsurl2 encoding, you can migrate to the new format at the URL below:


 23.6k Jan 3, 2023
 6.6k Dec 30, 2022
 1.5k Dec 30, 2022
 4.9k Jan 9, 2023
 15 Apr 13, 2022
 78 Dec 24, 2022
 5.8k Jan 9, 2023
 103.8k Jan 3, 2023
 18 Nov 12, 2022
 3 Mar 29, 2022
 2.3k Dec 30, 2022
 7k Dec 24, 2022
 4.9k Jan 3, 2023
 7.5k Jan 7, 2023
 60 Dec 29, 2022
 59.4k Jan 7, 2023
 13.5k Dec 30, 2022