API to generate candlestick chart data for any time period based on transactions data

Overview

candel-maker

API to generate candlestick chart data for any time period based on transactions data

Installation

clone repo

git clone https://github.com/dev-farbod/candel-maker.git

clone to directori

cd candel-maker

Use the package manager npm to install dependencies.

npm install

run server

node index.js

server will be run on localhost:5050

API refrenc

make candels

  POST /candel
Parameter Type Description default
transactions array Required. array of your transactions
time_frame number requested time frame (minute) 1
output_timestamp_type string (s / ms) choose type of candels timestamp,second or milisecond s

Example

{
	"transactions":[
		{
			"timestamp":"1644394447",
			"price":"30",
			"amount":2
		},
			{
			"timestamp":1644394437,
			"price":20,
			"amount":2
		}
		],
		"time_frame":"2",
    "output_timestamp_type":"ms"
}

response

{
    "status": true,
    "msg": "",
    "candels": [
        {
            "open": 20,
            "close": 30,
            "high": 30,
            "low": 20,
            "time": 1644394447000,
            "volume": 4
        }
    ]
}
You might also like...

A Phigros chart render based on Pixi.js

A Phigros chart render based on Pixi.js

Dec 30, 2022

A jsPlumb-based tree chart implementation for jQuery.

jsPlumbTree A jQuery plugin for generating a tree structure using jsPlumb. The tree is drawn from left to right, top to bottom. Please note that only

Jul 27, 2022

Generate a TOC of any page anywhere to quickly access the page's content.

Generate a TOC of any page anywhere to quickly access the page's content.

logseq-plugin-tocgen 在任何地方生成任一页面/块的目录,通过它你可以快速访问页面/块内容。同时提供了滚动回页面顶部的功能。 Generate a TOC of any page/block anywhere and quickly access the page/block's

Jan 4, 2023

Make Your Company Data Driven. Connect to any data source, easily visualize, dashboard and share your data.

Make Your Company Data Driven. Connect to any data source, easily visualize, dashboard and share your data.

Redash is designed to enable anyone, regardless of the level of technical sophistication, to harness the power of data big and small. SQL users levera

Dec 30, 2022

Chart image and QR code web API

Chart image and QR code web API

QuickChart QuickChart is a service that generates images of charts from a URL. Because these charts are simple images, they are very easy to embed in

Dec 25, 2022

🍞📊 Beautiful chart for data visualization.

🍞📊  Beautiful chart for data visualization.

🍞 📈 Spread your data on TOAST UI Chart. TOAST UI Chart is Beautiful Statistical Data Visualization library. 📦 Packages The functionality of TOAST U

Jan 2, 2023

🍞📊 Beautiful chart for data visualization.

🍞📊  Beautiful chart for data visualization.

🍞 📈 Spread your data on TOAST UI Chart. TOAST UI Chart is Beautiful Statistical Data Visualization library. 📦 Packages The functionality of TOAST U

Jan 6, 2023

Chart.js plugin for live streaming data

chartjs-plugin-streaming Chart.js plugin for live streaming data chartjs-plugin-streaming 2.x requires Chart.js 3.0.0 or later. If you need Chart.js 2

Dec 27, 2022

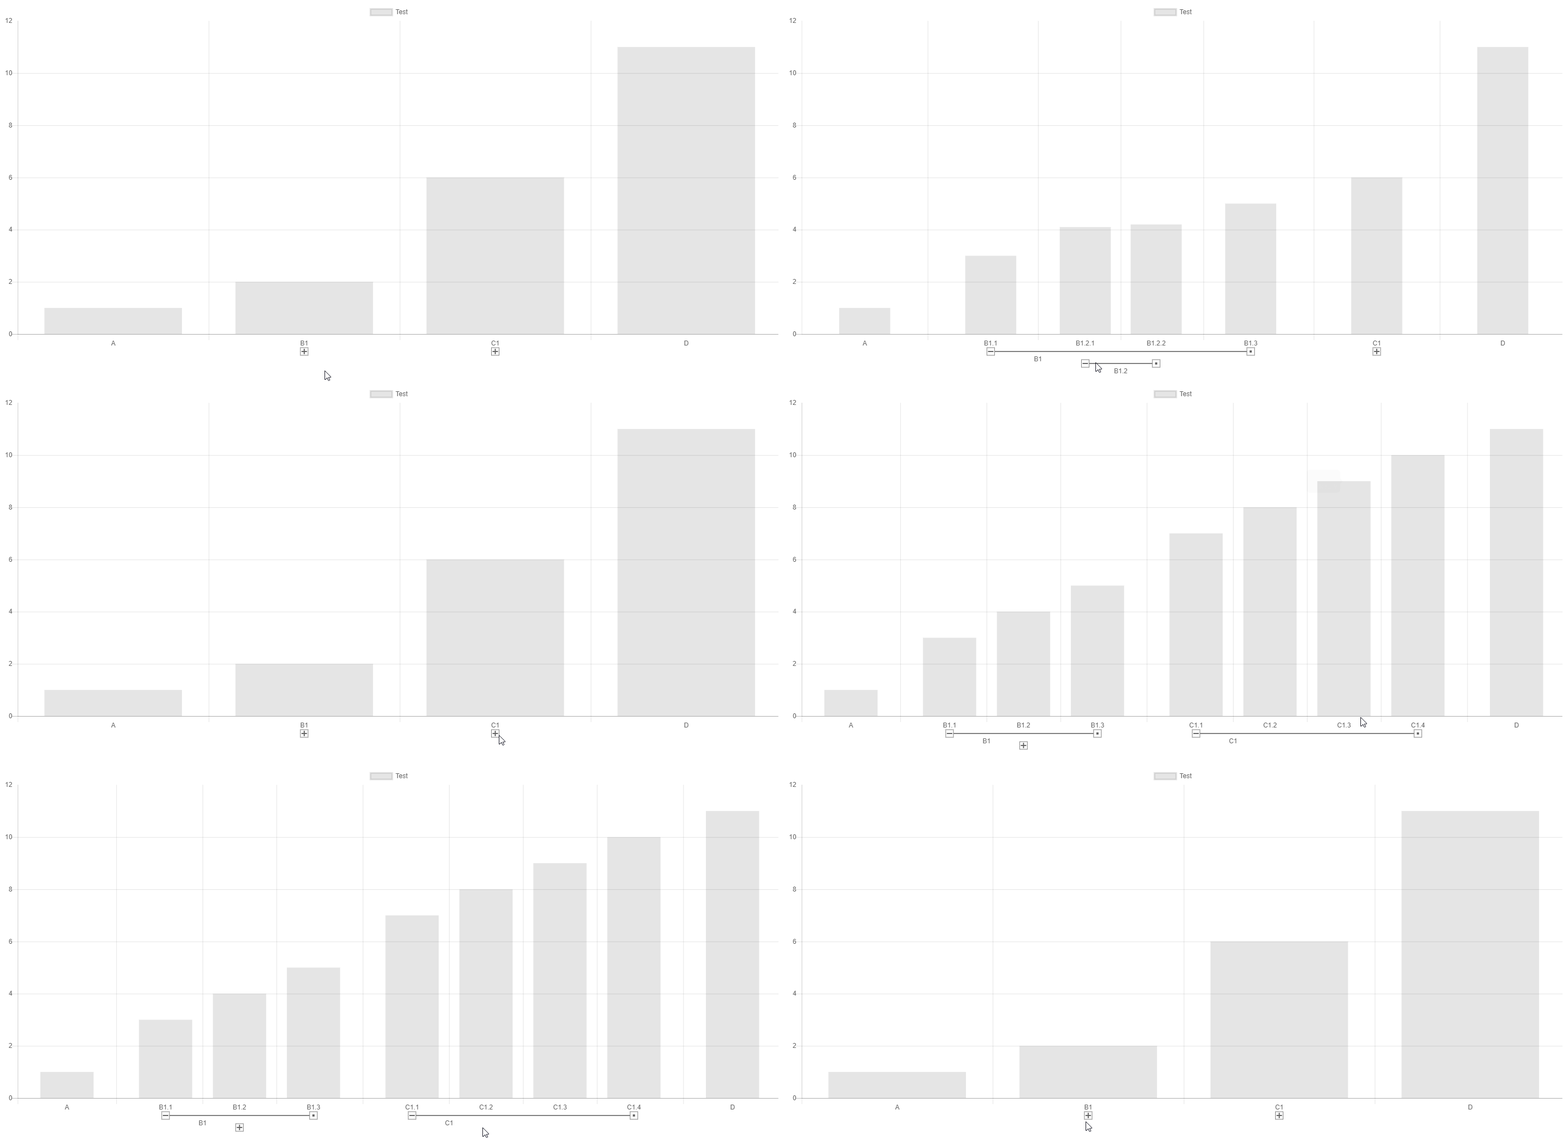
Chart.js scale for hierarchical tree-like data structure

Chart.js scale for hierarchical tree-like data structure

Chart.js Hierarchical Scale Plugin Chart.js module for adding a new categorical scale which mimics a hierarchical tree. Related Plugins Check out also

Dec 17, 2022
Owner
null
A Simple Dashboard Chart in Laravel Nova using Chart JS

A Simple Dashboard Chart in Laravel Nova using Chart JS. Starting create your own dashboard with Chart JS Integration can save your time and help you maintain consistency across standard elements such as Bar, Stacked, Line, Area, Doughnut and Pie Chart.

Kuncoro Wicaksono 177 Jan 4, 2023
Chart.js plugin to defer initial chart updates

Chart.js plugin to defer initial chart updates until the user scrolls and the canvas appears inside the viewport, and thus trigger the initial chart a

Chart.js 97 Nov 9, 2022
Bar Funnel Chart extension for Chart.js

Chart.BarFunnel.js Provides a Bar Funnel Chart for use with Chart.js Documentation To create a Bar Funnel Chart, include Chart.BarFunnel.js after Char

Chart.js 58 Nov 24, 2022
TradeX-chart is a trade chart written in plain (vanilla) JavaScript with minimal dependencies

TradeX-chart is a trade chart written in plain (vanilla) JavaScript with minimal dependencies; use it with any framework or backend.

null 24 Dec 12, 2022
Timeline/Graph2D is an interactive visualization chart to visualize data in time.

vis-timeline The Timeline/Graph2D is an interactive visualization chart to visualize data in time. The data items can take place on a single date, or

vis.js 1.2k Jan 3, 2023
📈 A small, fast chart for time series, lines, areas, ohlc & bars

?? μPlot A small (~35 KB min), fast chart for time series, lines, areas, ohlc & bars (MIT Licensed) Introduction μPlot is a fast, memory-efficient Can

Leon Sorokin 7.5k Jan 7, 2023
:bar_chart: A D3-based reusable chart library

c3 c3 is a D3-based reusable chart library that enables deeper integration of charts into web applications. Follow the link for more information: http

C3.js 9.2k Jan 2, 2023
:bar_chart: Re-usable, easy interface JavaScript chart library based on D3.js

billboard.js is a re-usable, easy interface JavaScript chart library, based on D3 v4+. The name "billboard" comes from the famous billboard chart whic

NAVER 5.4k Jan 1, 2023
J2CL and GWT Charts library based on CHART.JS

Charba - J2CL and GWT Charts library based on CHART.JS What's Charba GWT Web toolkit doesn't have charting library available out of the box. There are

Pepstock.org 56 Dec 17, 2022
Beautiful charts for Angular based on Chart.js

ng2-charts slack Beautiful charts for Angular based on Chart.js Usage & Demo Samples using ng2-charts https://valor-software.com/ng2-charts/ Installat

Valor Software 2.2k Jan 4, 2023