chartjs-chart-sankey
Chart.js v3.3.x module for creating sankey diagrams


![]()


Browser support
All modern and up-to-date browsers are supported, including, but not limited to:
- Chrome
- Edge
- Firefox
- Safari
Internet Explorer 11 is not supported.
Typescript
Typescript 3.x and higher is supported.
Documentation
You can use chartjs-chart-sankey.js as ES module. You'll need to manually register two components
import {Chart} from 'chart.js';
import {SankeyController, Flow} from 'chartjs-chart-sankey';

Chart.register(SankeyController, Flow);
To create a sankey chart, include chartjs-chart-sankey.js after chart.js and then create the chart by setting the type attribute to 'sankey'
const chart = new Chart(ctx, {
  type: 'sankey',
  data: dataObject
});
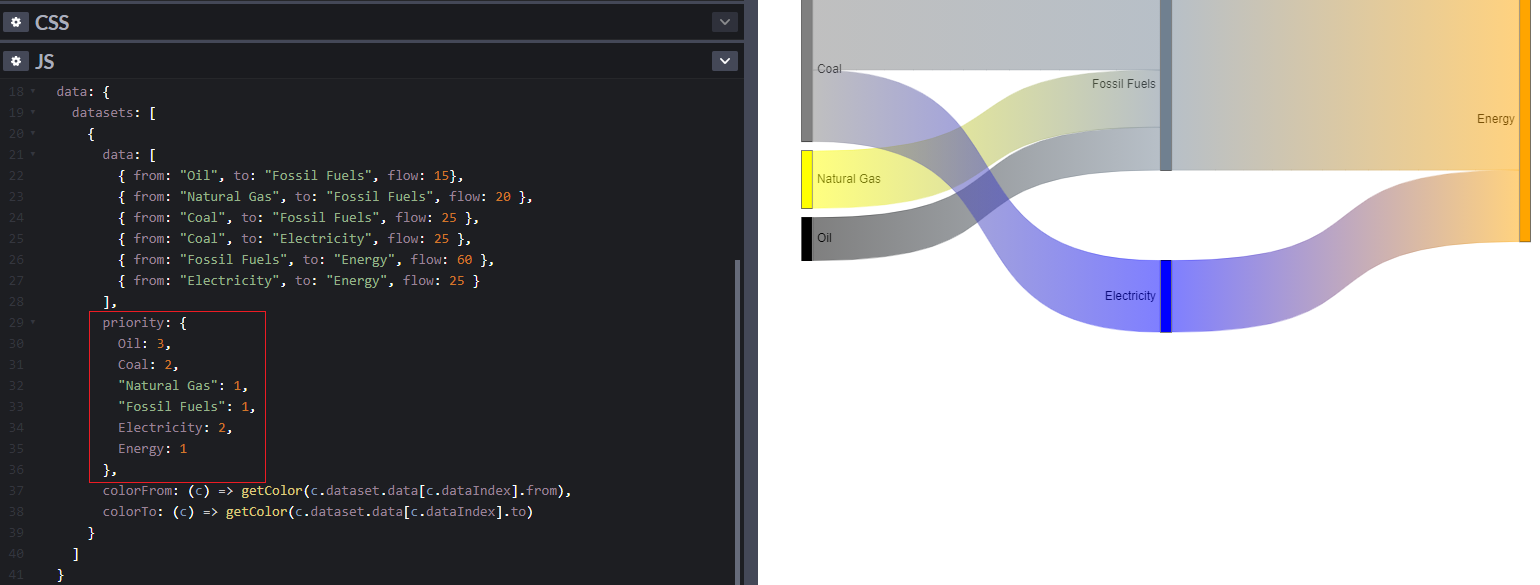
Configuration
Example:
const chart = new Chart(ctx, {
  type: 'sankey',
  data: {
    datasets: [{
      label: 'My sankey',
      data: [
        {from: 'a', to: 'b', flow: 10},
        {from: 'a', to: 'c', flow: 5},
        {from: 'b', to: 'c', flow: 10}
      ],
      colorFrom: (c) => getColor(c.dataset.data[c.dataIndex].from),
      colorTo: (c) => getColor(c.dataset.data[c.dataIndex].to),
      colorMode: 'gradient', // or 'from' or 'to'
      /* optional labels */
      labels: {
        a: 'Label A',
        b: 'Label B',
        c: 'Label C'
      },
      /* optional priority */
      priority: {
        a: 0,
        b: 1,
        c: 2
      },
      size: 'max', // or 'min' if flow overlap is preferred
    }]
  },
});
Example

Online examples
Development
You first need to install node dependencies (requires Node.js):
> npm install
The following commands will then be available from the repository root:
> npm run build         // build dist files
> npm run autobuild     // build and watch for changes
> npm test              // run all tests
> npm autotest          // run all tests and watch for changes
> npm lint              // perform code linting
> npm package           // create an archive with dist files and samples
License
chartjs-chart-sankey is available under the MIT license.


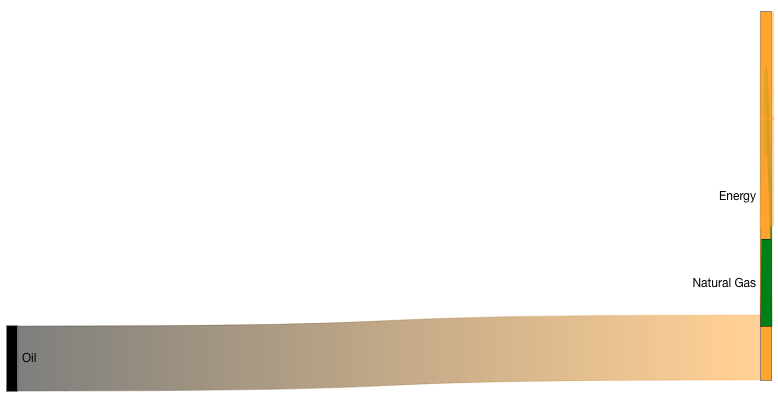
 It doesn't look nice.
So the 'adjustOverlaps === true' param does the following:
It doesn't look nice.
So the 'adjustOverlaps === true' param does the following:

 But i expected one of the images above.


 23 Dec 6, 2022
 99 Dec 18, 2022
 177 Jan 4, 2023
 97 Nov 9, 2022
 24 Dec 12, 2022
 19.4k Jan 2, 2023
 9.2k Jan 2, 2023
 952 Dec 29, 2022
 5.2k Jan 2, 2023
 5.4k Jan 1, 2023
 2.9k Dec 31, 2022
 1.3k Dec 25, 2022
 7.5k Jan 7, 2023
 4 Mar 3, 2021
 68 Dec 8, 2022
 13 Aug 20, 2022