Chart.js scale for hierarchical tree-like data structure

Overview

Chart.js Hierarchical Scale Plugin
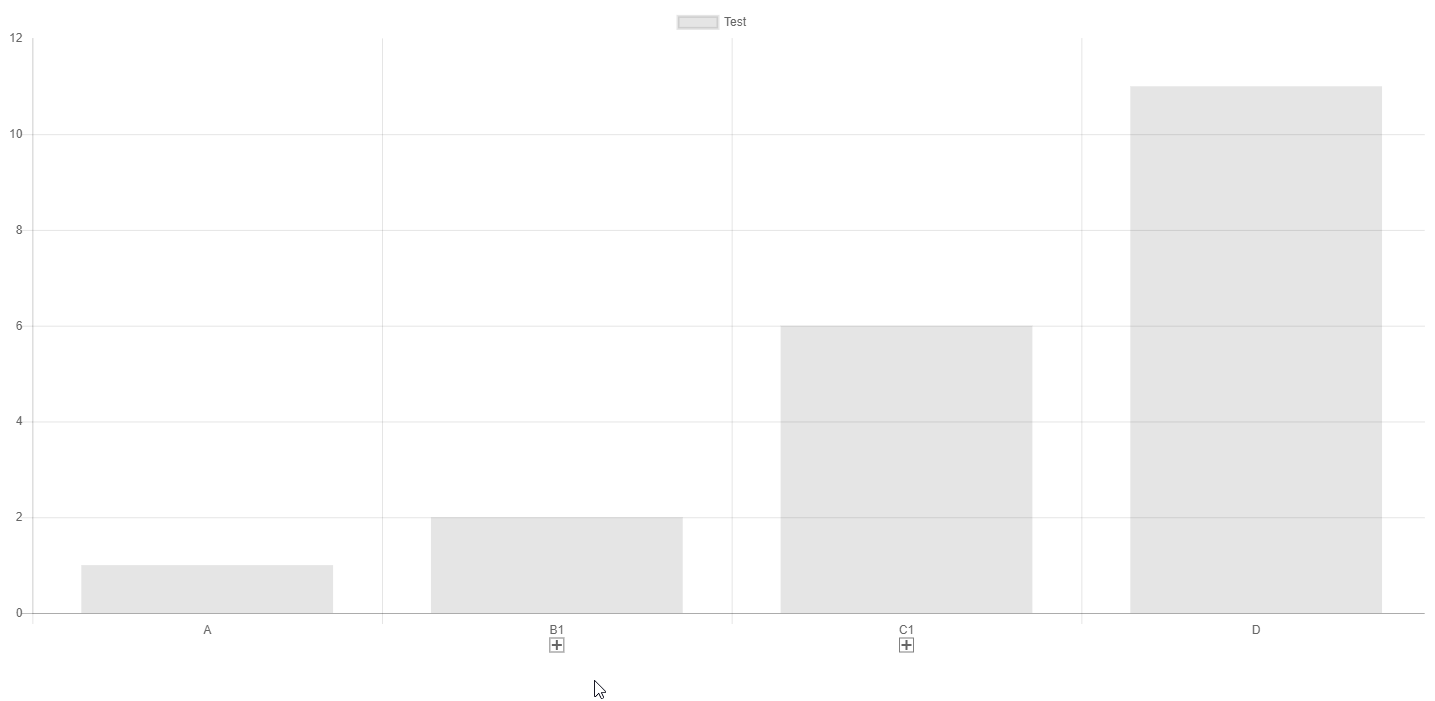
datavisyn NPM Package Github Actions

Chart.js module for adding a new categorical scale which mimics a hierarchical tree.

hierarchy

Related Plugins

Check out also my other chart.js plugins:

Install

npm install --save chart.js chartjs-plugin-hierarchical

Usage

see Samples on Github

or at this Open in CodePen

Scale

a new scale type hierarchical.

Styling

The hierarchical axis scale has the following styling options

interface IHierarchicalScaleOptions {
  /**
   * ratio by which the distance between two elements shrinks the higher the level of the tree is. i.e. two two level bars have a distance of 1. two nested one just 0.75
   * @default 0.75
   */
  levelPercentage: number;
  /**
   * padding of the first collapse to the start of the x-axis
   * @default 25
   */
  padding: number;
  /**
   * position of the hierarchy label in expanded levels, null to disable
   * @default 'below'
   */
  hierarchyLabelPosition: 'below' | 'above' | null;

  /**
   * position of the hierarchy group label relative to the its children
   * @default between-first-and-second
   */
  hierarchyGroupLabelPosition: 'center' | 'first' | 'last' | 'between-first-and-second';

  /**
   * whether interactive buttons should be shown or whether it should be static
   * @default false
   */
  static: boolean;

  /**
   * object of attributes that should be managed and extracted from the tree
   * data structures such as `backgroundColor` for coloring individual bars
   * the object contains the key and default value
   * @default {}
   */
  attributes: { [attribute: string]: any };
}

Data structure

interface ILabelNode {
  /**
   * label
   */
  label: string;
  /**
   * defines whether this node is collapsed (false) or expanded (true) or focussed ('focus')
   * @default false
   */
  expand?: boolean | 'focus';
  /**
   * list of children
   */
  children?: ISubLabelNode[];
}

/**
 * a label entry can be a single string or a complex ILabelNode
 */
declare type ISubLabelNode = ILabelNode | string;

interface IValueNode<T> {
  /**
   * the actual value of this node
   */
  value: T;
  /**
   * list of children
   */
  children?: ISubValueNode<T>[];
}

/**
 * a value entry can be a single value or a complex IValueNode
 */
declare type ISubValueNode<T> = IValueNode<T> | T;

ESM and Tree Shaking

The ESM build of the library supports tree shaking thus having no side effects. As a consequence the chart.js library won't be automatically manipulated nor new controllers automatically registered. One has to manually import and register them.

import { Chart } from 'chart.js';
import { HierarchicalScale } from 'chartjs-plugin-hierarchical';

// register scale in chart.js and ensure the defaults are set
Chart.register(HierarchicalScale);
...

Development Environment

npm i -g yarn
yarn install
yarn sdks vscode

Common commands

yarn compile
yarn test
yarn lint
yarn fix
yarn build
yarn docs

developed by datavisyn.

You might also like...

Chart.js plugin for Prometheus data loading

Chart.js plugin for Prometheus data loading

Welcome to chartjs-plugin-datasource-prometheus 👋 A Prometheus datasource for ChartJS. Dependencies: requires chart.js 2.7 or later. requires moment.

Dec 6, 2022

Chart.js plugin to display labels on data elements

Overview Highly customizable Chart.js plugin that displays labels on data for any type of charts. Requires Chart.js 3.x. Documentation Introduction Ge

Dec 24, 2022

Timeline/Graph2D is an interactive visualization chart to visualize data in time.

Timeline/Graph2D is an interactive visualization chart to visualize data in time.

vis-timeline The Timeline/Graph2D is an interactive visualization chart to visualize data in time. The data items can take place on a single date, or

Jan 3, 2023

A web app that shows visualizations of the most used graphs algorithms such as BFS, DFS, Dijsktra, Minimum spanning tree, etc. It allows you to draw your own graph.

Graph Visualizer Draw your own graphs and visualize the most common graph algorithms This web application allows you to draw a graph from zero, with p

Jul 29, 2022

Make Your Company Data Driven. Connect to any data source, easily visualize, dashboard and share your data.

Make Your Company Data Driven. Connect to any data source, easily visualize, dashboard and share your data.

Redash is designed to enable anyone, regardless of the level of technical sophistication, to harness the power of data big and small. SQL users levera

Dec 30, 2022

Redefined chart library built with React and D3

Recharts Introduction Recharts is a Redefined chart library built with React and D3. The main purpose of this library is to help you to write charts i

Jan 2, 2023

:bar_chart: A D3-based reusable chart library

c3 c3 is a D3-based reusable chart library that enables deeper integration of charts into web applications. Follow the link for more information: http

Jan 2, 2023

GPL version of Javascript Gantt Chart

GPL version of Javascript Gantt Chart

dhtmlxGantt Getting started | Features | Follow us | License | Useful links dhtmlxGantt is an open source JavaScript Gantt chart that helps you illust

Dec 29, 2022

:bar_chart: Re-usable, easy interface JavaScript chart library based on D3.js

:bar_chart: Re-usable, easy interface JavaScript chart library based on D3.js

billboard.js is a re-usable, easy interface JavaScript chart library, based on D3 v4+. The name "billboard" comes from the famous billboard chart whic

Jan 1, 2023
Comments
  • beforeDataSetsDraw() crashes if no scaleLabel option is defined

    beforeDataSetsDraw() crashes if no scaleLabel option is defined

    When I use the "hierarchical" scale type, the hierarchicalPlugin crashes with the following error:

    Uncaught TypeError: Cannot read property 'color' of undefined
        at Object.beforeDatasetsDraw (index.esm.js:551)
        at callback (helpers.segment.js:129)
        at PluginService._notify (chart.esm.js:6398)
        at PluginService.notify (chart.esm.js:6373)
        at Chart.notifyPlugins (chart.esm.js:7889)
        at Chart._drawDatasets (chart.esm.js:7555)
        at Chart.draw (chart.esm.js:7519)
        at chart.esm.js:100
        at Map.forEach (<anonymous>)
        at Animator._update (chart.esm.js:73)
        at chart.esm.js:57
    

    To Reproduce

    Given a valid ctx = <canvas />, use the following code:

    const chartInstance = new ChartJS(ctx, {
      // data,
      options: {
        scales: {
          x: {
            type: HierarchicalScale.id
          }
        }
      },
      type: 'bar',
    });
    

    Notice a data object is not required to reproduce the bug

    Expected behavior

    I expect the scale not to crash but rely on built in defaults for required items.

    Context

    • Version: 3.0.0-beta.9
    • Browser: Chrome Version 89.0.4389.90

    Additional context The problem line is here:

    // index.esm.js
    ...
    550     var scaleLabel = scale.options.scaleLabel;  // <-- this returns 'undefined'
    551     var scaleLabelFontColor = valueOrDefault(
                     scaleLabel.color, // <-- This expression causes the error
                     defaults.color
              );
    

    Specifying the scaleLabel as an option (which is not documented in Chart.js 3 or this repo) prevents the crash from happening

     options: {
        scales: {
          x: {
            type: HierarchicalScale.id,
            scaleLabel: {}
          }
        }
      },
    
    bug 
    opened by Sutherlandon 2
  • Typos in comment

    Typos in comment

    "to" and "whether" are misspelled

    https://github.com/sgratzl/chartjs-plugin-hierarchical/blob/b166d033f92a1c0a7cb49342bbec011a0c0760e0/src/plugin/hierarchical.js#L67

    bug 
    opened by benmccann 1
  • Rotate label

    Rotate label

    Is there a way to rotate the labels for the hierarchical axis?

    I have some charts where the labels are too long, then I think could be a good idea can be able to rotate the labels.

    question 
    opened by maurk851 1
Releases(v4.1.0)
Owner
Samuel Gratzl
Research Software Engineer with a focus on Data Visualization - author of @lineupjs and @upsetjs
Samuel Gratzl
A jsPlumb-based tree chart implementation for jQuery.

jsPlumbTree A jQuery plugin for generating a tree structure using jsPlumb. The tree is drawn from left to right, top to bottom. Please note that only

Daniele Ricci 4 Jul 27, 2022
A Simple Dashboard Chart in Laravel Nova using Chart JS

A Simple Dashboard Chart in Laravel Nova using Chart JS. Starting create your own dashboard with Chart JS Integration can save your time and help you maintain consistency across standard elements such as Bar, Stacked, Line, Area, Doughnut and Pie Chart.

Kuncoro Wicaksono 177 Jan 4, 2023
Chart.js plugin to defer initial chart updates

Chart.js plugin to defer initial chart updates until the user scrolls and the canvas appears inside the viewport, and thus trigger the initial chart a

Chart.js 97 Nov 9, 2022
Bar Funnel Chart extension for Chart.js

Chart.BarFunnel.js Provides a Bar Funnel Chart for use with Chart.js Documentation To create a Bar Funnel Chart, include Chart.BarFunnel.js after Char

Chart.js 58 Nov 24, 2022
TradeX-chart is a trade chart written in plain (vanilla) JavaScript with minimal dependencies

TradeX-chart is a trade chart written in plain (vanilla) JavaScript with minimal dependencies; use it with any framework or backend.

null 24 Dec 12, 2022
API to generate candlestick chart data for any time period based on transactions data

candel-maker API to generate candlestick chart data for any time period based on transactions data Installation clone repo git clone https://github.co

null 2 Aug 18, 2022
🍞📊 Beautiful chart for data visualization.

?? ?? Spread your data on TOAST UI Chart. TOAST UI Chart is Beautiful Statistical Data Visualization library. ?? Packages The functionality of TOAST U

NHN 5.2k Jan 2, 2023
🍞📊 Beautiful chart for data visualization.

?? ?? Spread your data on TOAST UI Chart. TOAST UI Chart is Beautiful Statistical Data Visualization library. ?? Packages The functionality of TOAST U

NHN 5.2k Jan 6, 2023
Chart.js plugin for live streaming data

chartjs-plugin-streaming Chart.js plugin for live streaming data chartjs-plugin-streaming 2.x requires Chart.js 3.0.0 or later. If you need Chart.js 2

Akihiko Kusanagi 401 Dec 27, 2022
Draggable data points plugin for Chart.js

chartjs-plugin-dragdata.js Now compatible with Chart.js v3 ?? Looking for a version compatible to Chart.js < 2.9.x? Then visit the v2 branch! A plugin

Christoph Pahmeyer 196 Dec 18, 2022