Chart.js Venn and Euler Diagrams

Overview

Chart.js Venn and Euler Diagram Chart

NPM Package Github Actions

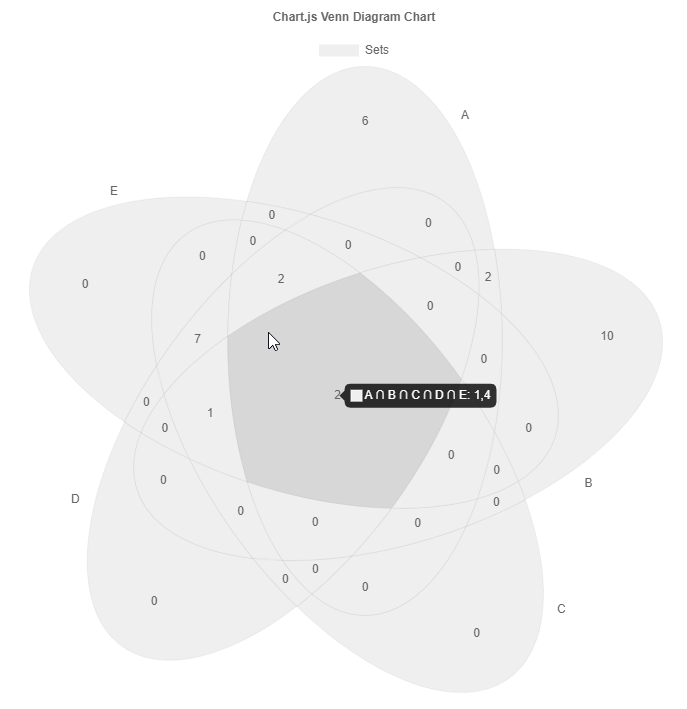
Chart.js module for charting venn diagrams with up to five sets. Adding new chart type: venn and euler.

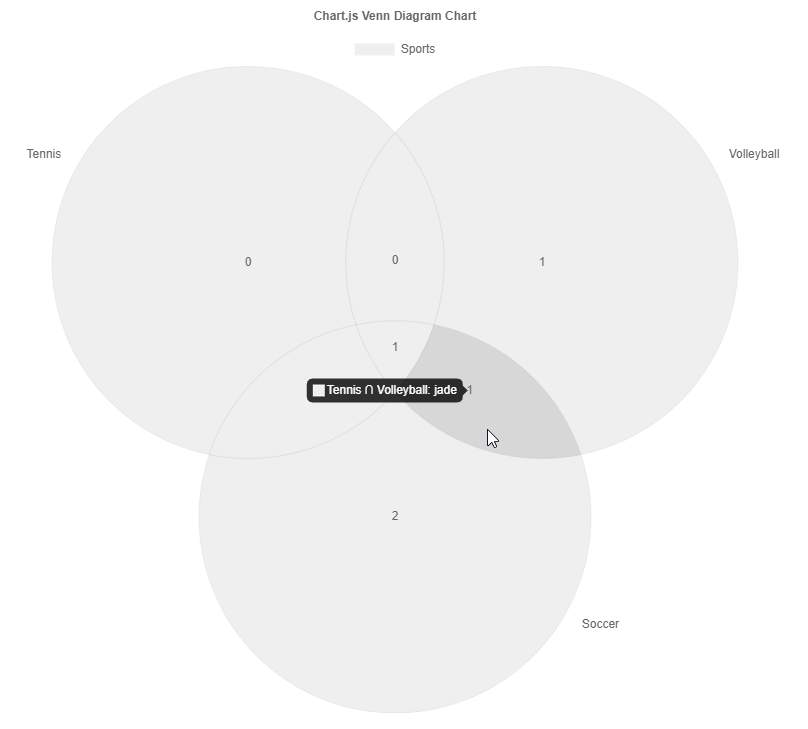
Sports Venn Diagram

five sets

Related Plugins

Check out also my other chart.js plugins:

Install

npm install --save chart.js chartjs-chart-venn

Usage

see Samples on Github

or at this Open in CodePen

Venn Diagram

Data Structure

const config = {
  type: 'venn',
  data: ChartVenn.extractSets(
    [
      { label: 'Soccer', values: ['alex', 'casey', 'drew', 'hunter'] },
      { label: 'Tennis', values: ['casey', 'drew', 'jade'] },
      { label: 'Volleyball', values: ['drew', 'glen', 'jade'] },
    ],
    {
      label: 'Sports',
    }
  ),
  options: {},
};

Alternative data structure

const config = {
  type: 'venn',
  data: {
    labels: [
      'Soccer',
      'Tennis',
      'Volleyball',
      'Soccer ∩ Tennis',
      'Soccer ∩ Volleyball',
      'Tennis ∩ Volleyball',
      'Soccer ∩ Tennis ∩ Volleyball',
    ],
    datasets: [
      {
        label: 'Sports',
        data: [
          { sets: ['Soccer'], value: 2 },
          { sets: ['Tennis'], value: 0 },
          { sets: ['Volleyball'], value: 1 },
          { sets: ['Soccer', 'Tennis'], value: 1 },
          { sets: ['Soccer', 'Volleyball'], value: 0 },
          { sets: ['Tennis', 'Volleyball'], value: 1 },
          { sets: ['Soccer', 'Tennis', 'Volleyball'], value: 1 },
        ],
      },
    ],
  },
  options: {},
};

Styling of elements

ArcSlice elements have the basic backgroundColor, borderColor, and borderWidth properties similar to a regular rectangle.

Euler Diagram

Euler diagrams are relaxed proportional venn diagrams such that the area of the circles and overlap try to fit the overlapping value. It is a relaxed in a way that is just approximates the proportions using a numerical optimization process. Moreover, only one and two set overlaps are used for the computation. The library uses venn.js in the background.

Data Structure

const config = {
  type: 'euler',
  data: ChartVenn.extractSets(
    [
      { label: 'A', values: [1, 2, 3, 4, 11, 12, 13, 14, 15, 16, 17, 18] },
      { label: 'B', values: [1, 2, 3, 4, 5, 6, 7, 8, 9, 10, 19, 20, 21, 22, 23] },
      { label: 'C', values: [1, 11, 12, 4, 5, 24, 25, 26, 27, 28, 29, 30] },
    ],
    {
      label: 'Sets',
    }
  ),
  options: {},
};

Styling of elements

see Venn Diagram

ESM and Tree Shaking

The ESM build of the library supports tree shaking thus having no side effects. As a consequence the chart.js library won't be automatically manipulated nor new controllers automatically registered. One has to manually import and register them.

Variant A:

import { Chart } from 'chart.js';
import { VennDiagramController, ArcSlice } from 'chartjs-chart-venn';

Chart.register(VennDiagramController, ArcSlice);
...

new Chart(ctx, {
  type: VennDiagramController.id,
  data: [...],
});

Variant B:

import { VennDiagramChart } from 'chartjs-chart-venn';

new VennDiagramChart(ctx, {
  data: [...],
});

Development Environment

npm i -g yarn
yarn install
yarn sdks vscode

Common commands

yarn compile
yarn test
yarn lint
yarn fix
yarn build
yarn docs
Comments
  • Abstract Layout

    Abstract Layout

    In the new D3, they have extracted the layout/math portions into separate libraries.

    I would love to use this library in https://reaviz.io but its so tightly coupled to ChartJS I'm not sure its possible w/o major mods.

    enhancement 
    opened by amcdnl 4
  • How can select one zone in your wenn implementation?

    How can select one zone in your wenn implementation?

    HI,

    I just study your venn implementation. It is great. I don't know how to select one zone just like your implementaion.

    In benfred implementation, it don't support this. And when mouse hover, related zone is highlighted. Is this implemented by chart.js, right?

    image

    benfred: https://github.com/benfred/venn.js

    Thanks.

    br

    wt

    question 
    opened by mmm2006 1
  • how to set different color for different zone?

    how to set different color for different zone?

    HI,

    This library is great because i can select one part by mouse when hover.

    If I want to select multi zone by mouse, How should I do?

    I also just want to know how to set different colors for different zone in three circles?

    Can you help me about it.

    Thanks.

    br

    wt

    question answered 
    opened by mmm2006 1
  • can not set data more than 5 rows

    can not set data more than 5 rows

    I'm trying to add data more than 5 rows ,but unfortunately It show only 5 rows.

    Example on CodePen : https://codepen.io/mengty/pen/LYzbJEJ

    Anyone, Can you give me some issue please?

    Thank you!

    question answered 
    opened by vongmengty 1
  • Only backgroundColor option seems to work

    Only backgroundColor option seems to work

    I'm trying to style a chart but none of the options except backgroundColor seem to work. In chart.js, normally the style options would go in the dataset, but without that, I'm not sure where they go. Can you point me in the right direction?

    I have anexample on CodePen that shows backgroundColor working, but nothing else. Any pointers would be helpful, Thank you!

    const chart = new Chart(ctx, {
      type: 'venn',
      data: data,
      options: {
        title: {
          display: true,
          text: 'Chart.js Venn Diagram Chart',
        },
        backgroundColor: ["#895b93", "#84cdec", 'orange', 'lime', 'fuchsia'], // These work!
        color: ['white', 'red', 'blue', 'rebeccapurple'], // These do nothing
        borderWidth: 10 // This affects only the legend
      }
    });
    
    bug 
    opened by freshyill 1
  • Is it possible to add in React a tag and display it?

    Is it possible to add in React a tag and display it?

    .I want to get the values of set from backend and create venn diagram on select of values from dropdown.Is it possible to add a tag and give config options there?I am using reactjs.just like other barcharts and so on,I want to add a tag .Is it possible?

    question esm import answered 
    opened by swarnas89 1
  • How to hide dataset labels/legends ?

    How to hide dataset labels/legends ?

    How to hide the dataset labels? i.e. I want to remove John Doe label from the chart, how can I achieve this?

    Screenshots / Sketches Screen Shot 2022-07-23 at 07 53 41

    Context

    • Version: 3.8.0
    • Browser: Chrome, Firefox, Safari
    • Angular 14

    Additional context

    I have tried the following:

    plugins: {
     legend: {
      display: false,
     }
    }
    
    scales: {
     x: {
      display: false,
     },
     y: {
      display: false,
      }
    }
    
    opened by selcuk-sahin 0
  • Unable to Render

    Unable to Render

    I'm unable to test out the library.

    I've setup a demo here - https://codesandbox.io/s/venn-test-s4ez7?file=/src/App.tsx where you can see the errors.

    I think there might be version misalignments.

    bug 
    opened by amcdnl 0
  • Tooltip doesn't work

    Tooltip doesn't work

    Hi Can you help me tooltip doesn't work when i try to use react structure

    export const CiChartVenn = () => {
      const canvasRef = useRef(null);
    
      const vennOptions = useMemo(() =>  {
        return {
          type: "venn",
          data: extractSets(
            [
              {
                label: "A",
                values: ["alex", "casey", "drew", "hunter", "jade"]
              },
              { label: "B", values: ["casey", "drew", "jade"] },
              { label: "C", values: ["drew", "glen", "jade", "hunter"] },
              { label: "D", values: ["drew", "glen", "jade", "hunter"] }
            ],
            {
              label: 'Sports',
            }
          ),
          options: {
            plugins: {
              tooltip: {
                enabled: true,
                position: 'nearest',
                bodyColor: 'red',
                backgroundColor: 'rgba(249, 231, 159, 1)'
              }
            },
            title: {
              display: true,
              text: 'Venn Diagram'
            },
            backgroundColor: [
              "rgba(255, 26, 104, 0.2)",
              "rgba(54, 162, 235, 0.2)",
              "rgba(255, 206, 86, 0.2)",
              "rgba(75, 192, 192, 0.2)",
              "rgba(153, 102, 255, 0.2)",
              "rgba(255, 159, 64, 0.2)"
            ],
            borderWidth: 1,
            // borderColor: [
            //   "rgba(255, 26, 104, 1)",
            //   "rgba(54, 162, 235, 1)",
            //   "rgba(255, 206, 86, 1)",
            //   "rgba(75, 192, 192, 1)",
            //   "rgba(153, 102, 255, 1)",
            //   "rgba(255, 159, 64, 1)"
            // ]
          }
        };
      }, []);
    
      // console.log(props.data,'config');
    
      useEffect(() => {
        const vennChart = new VennDiagramChart(canvasRef.current as any, vennOptions as any);
    
        return () => {
          vennChart.destroy();
        }
      },[vennOptions]);
    
      return (
        <div>
          <canvas ref={canvasRef} id="canvas"></canvas>
        </div>
      );
    };
    
    question 
    opened by KirillAleshkin 0
Releases(v4.1.0)
Owner
UpSet.js
😠 Set visualization libraries, including UpSet.js a JavaScript re-implementation of the UpSet visualization technique by Lex. et. al.
UpSet.js
Chart.js module for creating sankey diagrams

chartjs-chart-sankey Chart.js v3.3.x module for creating sankey diagrams Browser support All modern and up-to-date browsers are supported, including,

Jukka Kurkela 85 Jan 2, 2023
A Simple Dashboard Chart in Laravel Nova using Chart JS

A Simple Dashboard Chart in Laravel Nova using Chart JS. Starting create your own dashboard with Chart JS Integration can save your time and help you maintain consistency across standard elements such as Bar, Stacked, Line, Area, Doughnut and Pie Chart.

Kuncoro Wicaksono 177 Jan 4, 2023
Chart.js plugin to defer initial chart updates

Chart.js plugin to defer initial chart updates until the user scrolls and the canvas appears inside the viewport, and thus trigger the initial chart a

Chart.js 97 Nov 9, 2022
Bar Funnel Chart extension for Chart.js

Chart.BarFunnel.js Provides a Bar Funnel Chart for use with Chart.js Documentation To create a Bar Funnel Chart, include Chart.BarFunnel.js after Char

Chart.js 58 Nov 24, 2022
TradeX-chart is a trade chart written in plain (vanilla) JavaScript with minimal dependencies

TradeX-chart is a trade chart written in plain (vanilla) JavaScript with minimal dependencies; use it with any framework or backend.

null 24 Dec 12, 2022
TChart.js - simple and configurable Bar and Line Chart library in Javascript

TChart.js Simple and configurable Bar and Line Chart library in Javascript Description TChart.js is a canvas-based simple Javascript Bar and Line Char

null 4 Mar 3, 2021
Chart.js plugin to calculate and draw statistical linear, exponential, power, logarithmic, and polynomial regressions.

chartjs-plugin-regression Chart.js plugin to calculate and draw statistical linear, exponential, power, logarithmic, and polynomial regressions using

Wilfredo Pomier 14 Dec 18, 2022
Redefined chart library built with React and D3

Recharts Introduction Recharts is a Redefined chart library built with React and D3. The main purpose of this library is to help you to write charts i

recharts 19.4k Jan 2, 2023
Chart image and QR code web API

QuickChart QuickChart is a service that generates images of charts from a URL. Because these charts are simple images, they are very easy to embed in

Ian Webster 1.3k Dec 25, 2022
J2CL and GWT Charts library based on CHART.JS

Charba - J2CL and GWT Charts library based on CHART.JS What's Charba GWT Web toolkit doesn't have charting library available out of the box. There are

Pepstock.org 56 Dec 17, 2022
Zoom and pan plugin for Chart.js

chartjs-plugin-zoom A zoom and pan plugin for Chart.js >= 3.0.0 For Chart.js 2.6.0 to 2.9.x support, use version 0.7.7 of this plugin. Panning can be

Chart.js 510 Jan 2, 2023
Chart.js Choropleth and Bubble Maps

Chart.js Geo Chart.js module for charting maps with legends. Adding new chart types: choropleth and bubbleMap. works great with https://github.com/cha

Samuel Gratzl 224 Dec 28, 2022
Chart.js Box Plots and Violin Plot Charts

Chart.js Box and Violin Plot Chart.js module for charting box and violin plots. This is a maintained fork of @datavisyn/chartjs-chart-box-and-violin-p

Samuel Gratzl 61 Dec 14, 2022
:bar_chart: A D3-based reusable chart library

c3 c3 is a D3-based reusable chart library that enables deeper integration of charts into web applications. Follow the link for more information: http

C3.js 9.2k Jan 2, 2023
GPL version of Javascript Gantt Chart

dhtmlxGantt Getting started | Features | Follow us | License | Useful links dhtmlxGantt is an open source JavaScript Gantt chart that helps you illust

null 952 Dec 29, 2022
🍞📊 Beautiful chart for data visualization.

?? ?? Spread your data on TOAST UI Chart. TOAST UI Chart is Beautiful Statistical Data Visualization library. ?? Packages The functionality of TOAST U

NHN 5.2k Jan 2, 2023
:bar_chart: Re-usable, easy interface JavaScript chart library based on D3.js

billboard.js is a re-usable, easy interface JavaScript chart library, based on D3 v4+. The name "billboard" comes from the famous billboard chart whic

NAVER 5.4k Jan 1, 2023
:bar_chart: A library of modular chart components built on D3

Plottable Plottable is a library of chart components for creating flexible, custom charts for websites. It is built on top of D3.js and provides highe

Palantir Technologies 2.9k Dec 31, 2022
📈 A small, fast chart for time series, lines, areas, ohlc & bars

?? μPlot A small (~35 KB min), fast chart for time series, lines, areas, ohlc & bars (MIT Licensed) Introduction μPlot is a fast, memory-efficient Can

Leon Sorokin 7.5k Jan 7, 2023