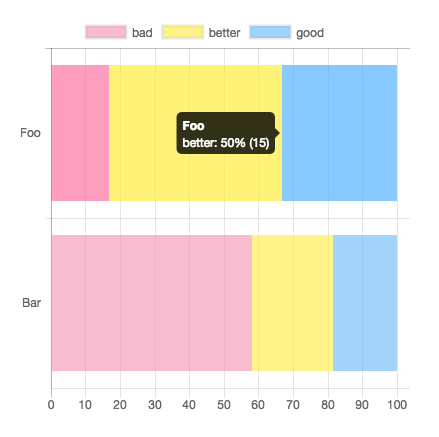
This plugin for Chart.js that makes your bar chart to 100% stacked bar chart.

Overview

chartjs-plugin-stacked100

This plugin for Chart.js that makes your bar chart to 100% stacked bar chart.

Requires Chart.js 3.x.

Demo: https://y-takey.github.io/chartjs-plugin-stacked100

Installation

npm

yarn add chartjs-plugin-stacked100

or

npm install chartjs-plugin-stacked100 --save
import { Chart } from "chart.js";
import ChartjsPluginStacked100 from "chartjs-plugin-stacked100";

Chart.register(ChartjsPluginStacked100);

CDN

<script src="https://cdn.jsdelivr.net/npm/[email protected]/dist/chart.min.js"></script>
<script src="https://cdn.jsdelivr.net/npm/[email protected]"></script>
Chart.register(ChartjsPluginStacked100.default);

Options

Name Type Default Description
enable boolean -
replaceTooltipLabel boolean true replace tooltip label automatically.
fixNegativeScale boolean true when datasets has negative value and fixNegativeScale is false, the nagative scale is variable. (the range is between -100 and -1)
individual boolean false scale the highest bar to 100%, and the rest would be proportional to the highest bar of a stack.
precision number 1 precision of percentage. the range is between 0 and 16

Usage

Basic

specify plugin options with { stacked100: { enable: true } }.

Use your tooltip label

specify plugin options with { stacked100: { enable: true, replaceTooltipLabel: false } }. and you can pass tooltip option.

new Chart(document.getElementById("my-chart"), {
  type: "bar",
  data: {},
  options: {
    tooltips: {
      callbacks: {
        label: (tooltipItem) => {
          const data = tooltipItem.chart.data;
          const datasetIndex = tooltipItem.datasetIndex;
          const index = tooltipItem.dataIndex;
          const datasetLabel = data.datasets[datasetIndex].label || "";
          // You can use two type values.
          // `data.originalData` is raw values,
          // `data.calculatedData` is percentage values, e.g. 20.5 (The total value is 100.0)
          const originalValue = data.originalData[datasetIndex][index];
          const rateValue = data.calculatedData[datasetIndex][index];

          return `${datasetLabel}: ${rateValue}% (raw ${originalValue})`;
        },
      },
    },
    plugins: {
      stacked100: { enable: true, replaceTooltipLabel: false },
    },
  },
});

Specify the precision of the percentage value

You can pass precision option. (default value is 1 ) For example, when you pass { stacked100: { enable: true, precision: 3 } }, the result is 0.123% .

Examples

new Chart(document.getElementById("my-chart"), {
  type: "bar",
  data: {
    labels: ["Foo", "Bar"],
    datasets: [
      { label: "bad", data: [5, 25], backgroundColor: "rgba(244, 143, 177, 0.6)" },
      { label: "better", data: [15, 10], backgroundColor: "rgba(255, 235, 59, 0.6)" },
      { label: "good", data: [10, 8], backgroundColor: "rgba(100, 181, 246, 0.6)" },
    ],
  },
  options: {
    indexAxis: "y",
    plugins: {
      stacked100: { enable: true },
    },
  },
});

Result image

Datapoints can be Objects

...
// line or bar charts
datasets: [
  { data: [{ y: 5 }, { y: 25 }] },
  { data: [{ y: 15 }, { y: 10 }] },
  { data: [{ y: 10 }, { y: 8 }] }
]

// horizontalBar charts
datasets: [
  { data: [{ x: 5 }, { x: 25 }] },
  { data: [{ x: 15 }, { x: 10 }] },
  { data: [{ x: 10 }, { x: 8 }] }
]
...
How to use datalabels plugin
new Chart(document.getElementById("my-chart"), {
  type: "bar",
  data: {},
  options: {
    plugins: {
      datalabels: {
        formatter: (_value, context) => {
          const data = context.chart.data;
          const { datasetIndex, dataIndex } = context;
          return `${data.calculatedData[datasetIndex][dataIndex]}% (${data.originalData[datasetIndex][dataIndex]})`;
        },
      },
      stacked100: { enable: true },
    },
  },
});

Use with React

npx create-react-app demo-react
cd demo-react
npm install react-chartjs-2 chartjs-plugin-stacked100 --save

Then use it:

import { Chart, Bar } from "react-chartjs-2";
import ChartjsPluginStacked100 from "chartjs-plugin-stacked100";

Chart.register(ChartjsPluginStacked100);

const ChartData = (props: any) => {
  return (
    <>
      {
        <div>
          <Bar
            data={{
              labels: ["Foo", "Bar"],
              datasets: [
                { label: "bad", data: [5, 25], backgroundColor: "rgba(244, 143, 177, 0.6)" },
                { label: "better", data: [15, 10], backgroundColor: "rgba(255, 235, 59, 0.6)" },
                { label: "good", data: [10, 8], backgroundColor: "rgba(100, 181, 246, 0.6)" },
              ],
            }}
            options={{
              //@ts-ignore
              indexAxis: "y",
              plugins: {
                stacked100: { enable: true },
              },
            }}
          />
        </div>
      }
    </>
  );
};
export default ChartData;

You can find a working example in the demo-react folder

Supported chart types

Contributing

Pull requests and issues are always welcome.

For bugs and feature requests, please create an issue.

  1. Fork it!
  2. Create your feature branch: git checkout -b my-new-feature
  3. Commit your changes: git commit -am 'Add some feature'
  4. Push to the branch: git push origin my-new-feature
  5. Submit a pull request!

Development

  • start dev server: yarn start
  • publish the plugin: npm version (major|minor|patch) && npm publish
  • check: yarn dev
  • deploy to github pages: yarn gh
Comments
  • [Feature] Stacked group bar + group scale

    [Feature] Stacked group bar + group scale

    I was thinking about a new feature: it would mix stacked bar and group bar, as well as the individual feature that was already implemented in you plugin (in the version 1.2.0). So in the end, we would have stack bars (each bar contains a set of data), and they are grouped. But in each group, the biggest bar is scaled to 100% (as it is already the case with the individual option, but it is relative to each group, not globally).

    Do you think that it would be easy to implement? does it makes sense to you ? For my personal interest it would be really helpful, but I'm sure some other people may be interested =D

    Here is a draft of this feature: WhatsApp Image 2022-01-10 at 11 41 22

    opened by TheTisiboth 8
  • Scale highest bar to 100%

    Scale highest bar to 100%

    I have an idea about a new feature (or if it is already existing, I would be really interested!) Image Pasted at 2021-11-29 16-15

    Beeing able to scale the highest bar to 100%, and the rest would be proportional to the highest bar of a stack. Does it make sense that I post this here, or should I post it elsewhere ?

    opened by TheTisiboth 8
  • Could not find a declaration file for module 'chartjs-plugin-stacked100'

    Could not find a declaration file for module 'chartjs-plugin-stacked100'

    I am trying to use chartjs-plugin-stacked100 in a React App:

    import React, { useEffect, useState } from 'react';
    import { Chart } from 'react-chartjs-2';
    import ChartjsPluginStacked100 from 'chartjs-plugin-stacked100';
    
    const ConnectedTime = () => {
      // https://designcode.io/react-hooks-handbook-usestate-hook
      // https://designcode.io/react-hooks-handbook-fetch-data-from-an-api
      useEffect(() => {   }, []);
      return <>
          {
    	<div>
    	    <ChartjsPluginStacked100
    	      type="bar"
    	      data={{
        		labels: ["Foo", "Bar"],
        		datasets: [
        		  { label: "bad", data: [5, 25], backgroundColor: "rgba(244, 143, 177, 0.6)" },
        		  { label: "better", data: [15, 10], backgroundColor: "rgba(255, 235, 59, 0.6)},
            	  { label: "good", data: [10, 8], backgroundColor: "rgba(100, 181, 246, 0.6)" }]	
              }}
    	      options={{ 
        		indexAxis: "y",
    	    	plugins: {
    		      stacked100: { enable: true }
    		    }
    	      }} />
    	</div>
          }
      </>
    }
    
    export default ConnectedTime
    

    When I yarn start this piece of code, I get the error:

    TypeScript error in /home/mihamina/.../src/Components/ConnectedTime/ConnectedTime.tsx(4,37):
    Could not find a declaration file for module 'chartjs-plugin-stacked100'. 
    '/home/mihamina/.../node_modules/chartjs-plugin-stacked100/build/index.js' implicitly has an 'any' type.
    Try `npm i --save-dev @types/chartjs-plugin-stacked100` if it exists 
    or add a new declaration (.d.ts) file containing 
    `declare module 'chartjs-plugin-stacked100';`
    

    Issuing npm i --save-dev @types/chartjs-plugin-stacked100 : The package does not exist.

    I dont quite understand about the .d.ts file:

    • Do I create it at the root of the project? (same folder as package.json?)
    • Is the required name really .d.ts or should I prepend the name with chartjs-plugin-stacked100?
    opened by ucorpintegration 8
  • Percentage calculation failed using stack option

    Percentage calculation failed using stack option

    Hi,

    very nice library. I have a use case where I want to show a grouped set of stacked bars. The system did not differ between the stacks, so that all items over all stackgroups will be used to calculation the 100%.

    BR

    Short example

    labels: ["C1", "C2"],
        datasets: [
            { label: "L1", stack: 'Stack 0', data: [3, 2] },
            { label: "L2", stack: 'Stack 0', data: [1, 1] },
            { label: "L1", stack: 'Stack 1', data: [0, 3] },
            { label: "L2", stack: 'Stack 1', data: [1, 4] }
    ]
    
    opened by datenwort 8
  • Add option for percentage precision

    Add option for percentage precision

    I added a precision option that I needed to add flexibility to the percentage values. These precentage values can be rounded with x fraction digits. It is initialized to 1 which is the default now, but you can have e.g. 99,984% (precision of 3) if you wish. The option is added as option plugins.stacked100.precision. What do you think?

    opened by ThomasBrodt 7
  • Tooltip callback not being called on chart update

    Tooltip callback not being called on chart update

    I'm running into a strange bug, where when the data changes for a chart I'm rendering with this plugin, the tooltip callback I'm using isn't being run. Unlike in https://github.com/y-takey/chartjs-plugin-stacked100/issues/10, the bars are redrawing, and the numbers in the tooltips are updating, they just aren't being formatted with the callback I've specified.

    I've narrowed it down to this plugin because I have a parallel non-stacked chart using the same options that's not having this issue.

    I'm using react-chartjs-2 version 2.7.0 with Typescript.

    Thanks!

    opened by akegan 5
  • stacked100 not working with undefined datasets

    stacked100 not working with undefined datasets

    Stacked100: stacked100

    stacked: stacked

    in stacked100Chart'descriptor "south Dakota" one of legends undefined, so the stacked100 didn't show anything but in stacked chart with same data is fine. Thanks for your attention. I'm looking forward to your reply.

    opened by soloraid 4
  • Min value is not well calculated

    Min value is not well calculated

    Hello everyone, and first of all, thanks for the work, this plugin is really useful.

    I am using it in a React project, and I managed to make it work with typescript as well (it took me some days haha) But now, I observe that the minimum value of my X axis is "wrong: Screenshot 2021-11-29 092349

    Actually, it's not totally wrong, because this min value is the overall min value for the whole datasets. I can verify this by hiding the dataset packaging: Screenshot 2021-11-29 092418

    So is there a way to recompute the min value, everytime we show/hide a dataset, not to display the overall min, but to have the min according to the showed dataset? So in my example, the effective min in the first example should be -20%, and if I hide the dataset packaging, it should be recomputed, to be -100% It would avoid to have the chart shown on just half of the screen, like on the first screenshot

    Thanks for your help!

    EDIT: I can see that this -100% is actually maybe not linked to the values itself, but simply because I have negative values, as this comments suggests: https://github.com/y-takey/chartjs-plugin-stacked100/pull/30 But anyway, I'm still interested for some hints about this !

    EDIT 2: I also observed that if I update my code, by just adding a blank line (for instance), then save, It will update my react website, and then it will have the wanted behavior (with dynamic min value computed each time a dataset is hidden/shown). So it is not a fix, but I imagine that having the wanted behavior by default should be easy

    Here is a reproducible example (it's maybe a bit messy since this is under development, but If you need me to comment something, let me know)

    opened by TheTisiboth 4
  • Only export the plugins module

    Only export the plugins module

    This changes make the plugin only exports itself for a better integration with modern workflows (webpack, etc.). Registering the plugins will be up to the user.

    Usage will look like:

    import Stacked100 from 'chartjs-plugin-stacked100'
    
    const chart = new Chart(ctx, {
            type: 'bar',
            plugins: [Stacked100],
            // ...
    }
    
    opened by Dragnucs 4
  • Proposal: Option to reduce height

    Proposal: Option to reduce height

    Add an option to modify the height. For example

    stacked100: {
        enable: true,
        height: 0.8,
    }
    

    I have an issue where I have a data label set to anchor at the end and align at the end, and it gets cut off at the top.

    opened by vantaboard 3
  • [1.1.2][bug] Added support for data points as object

    [1.1.2][bug] Added support for data points as object

    In fact, the problem is that I put || 0 in the wrong place. Math.abs returns NaN if input is an undefined value.

    Added an example with objects

    before: Screen Shot 2021-12-12 at 4 48 33 PM after: Screen Shot 2021-12-12 at 4 48 42 PM

    BTW: For some reason, negative values do not work, I will try to fix them too, if I have time. Thank you

    opened by xr0master 3
  • When enabling stacked100, no interaction with chart possible

    When enabling stacked100, no interaction with chart possible

    I have a simple chart, which works as expected when I do not enable stacked100.

    As soon as I set in Options stacked100: {enable: true}, the charts is correctly displayed as a stacked bar chart. But there is no interaction at all possible: If I hover over the bars, no tooltips are displayed, when I want to disable a dataset, the click does nothing at all.

    It seems "dead" somehow. No errors are displayed in the console.

    opened by christo-ph 13
  • Most right Tooltip is cut and conflict with datalabels

    Most right Tooltip is cut and conflict with datalabels

    Hi y-takey, Thanks for your awesome work of this plugin.

    I have some issues and maybe you can help me with them:

    1. I'm using datalabels plugin for showing the values over the bars. When i'm NOT using your plugin, the chart looking like this: image But when i'm using your plugin, it first replaces the data values with their relative percentage: image When we hover once over the chart, the label are changing to the right values

    2. The most right tooltip is cut: image

    Thanks in advance

    opened by am-benisha 6
  • Doesn't seem to work with ng2-charts

    Doesn't seem to work with ng2-charts

    I installed the plugin as specified in the docs, I am using ng2-charts with following options: public barChartOptions = { plugins: { stacked100: { enable: true }, }, legend: { display: true, position: 'bottom', }, scales: { xAxes: [{ display: true, stacked: true }], yAxes: [{ display: false, stacked: true }], }, };

    No percentages are shown for me. The chart still displays value options.

    opened by jyotidhiman0610 3
Owner
y-take
y-take
🎧 Get json type billboard hot 100 chart

Billboard json Get json type billboard hot 100 chart, Data update every day !! Url Hot 100 : https://raw.githubusercontent.com/KoreanThinker/billboard

Hyun 13 Dec 31, 2022
TChart.js - simple and configurable Bar and Line Chart library in Javascript

TChart.js Simple and configurable Bar and Line Chart library in Javascript Description TChart.js is a canvas-based simple Javascript Bar and Line Char

null 4 Mar 3, 2021
Chart.js plugin to defer initial chart updates

Chart.js plugin to defer initial chart updates until the user scrolls and the canvas appears inside the viewport, and thus trigger the initial chart a

Chart.js 97 Nov 9, 2022
A Simple Dashboard Chart in Laravel Nova using Chart JS

A Simple Dashboard Chart in Laravel Nova using Chart JS. Starting create your own dashboard with Chart JS Integration can save your time and help you maintain consistency across standard elements such as Bar, Stacked, Line, Area, Doughnut and Pie Chart.

Kuncoro Wicaksono 177 Jan 4, 2023
TradeX-chart is a trade chart written in plain (vanilla) JavaScript with minimal dependencies

TradeX-chart is a trade chart written in plain (vanilla) JavaScript with minimal dependencies; use it with any framework or backend.

null 24 Dec 12, 2022
Progressive pie, donut, bar and line charts

Peity Peity (sounds like deity) is a jQuery plugin that converts an element's content into a mini <svg> pie, donut, line or bar chart. Basic Usage HTM

Ben Pickles 4.2k Jan 1, 2023
Makes waterfall charts easy with chartjs-2

Installation npm install --save chartjs-plugin-waterfall Here's what it looks like: Usage Just import the plugin and add it to any chart that you want

Ziegert Group 10 Jul 16, 2022
Zoom and pan plugin for Chart.js

chartjs-plugin-zoom A zoom and pan plugin for Chart.js >= 3.0.0 For Chart.js 2.6.0 to 2.9.x support, use version 0.7.7 of this plugin. Panning can be

Chart.js 510 Jan 2, 2023
Chart.js plugin for more styling options

chartjs-plugin-style Chart.js plugin for more styling options This plugin requires Chart.js 2.6.0 or later. Installation You can download the latest v

Akihiko Kusanagi 57 Oct 27, 2022
Chart.js plugin for live streaming data

chartjs-plugin-streaming Chart.js plugin for live streaming data chartjs-plugin-streaming 2.x requires Chart.js 3.0.0 or later. If you need Chart.js 2

Akihiko Kusanagi 401 Dec 27, 2022
Chart.js plugin to create charts with a hand-drawn, sketchy, appearance

chartjs-plugin-rough Chart.js plugin to create charts with a hand-drawn, sketchy, appearance Version 0.2 requires Chart.js 2.7.0 or later, and Rough.j

Akihiko Kusanagi 73 Dec 1, 2022
Chart.js plugin to calculate and draw statistical linear, exponential, power, logarithmic, and polynomial regressions.

chartjs-plugin-regression Chart.js plugin to calculate and draw statistical linear, exponential, power, logarithmic, and polynomial regressions using

Wilfredo Pomier 14 Dec 18, 2022
Draggable data points plugin for Chart.js

chartjs-plugin-dragdata.js Now compatible with Chart.js v3 ?? Looking for a version compatible to Chart.js < 2.9.x? Then visit the v2 branch! A plugin

Christoph Pahmeyer 196 Dec 18, 2022
Chart.js plugin for Prometheus data loading

Welcome to chartjs-plugin-datasource-prometheus ?? A Prometheus datasource for ChartJS. Dependencies: requires chart.js 2.7 or later. requires moment.

Samuel Berthe 77 Dec 6, 2022
Chart.js plugin to display labels on data elements

Overview Highly customizable Chart.js plugin that displays labels on data for any type of charts. Requires Chart.js 3.x. Documentation Introduction Ge

Chart.js 753 Dec 24, 2022
Annotation plugin for Chart.js

chartjs-plugin-annotation.js An annotation plugin for Chart.js >= 3.0.0 This plugin needs to be registered. It does not function as inline plugin. For

Chart.js 515 Dec 30, 2022
Redefined chart library built with React and D3

Recharts Introduction Recharts is a Redefined chart library built with React and D3. The main purpose of this library is to help you to write charts i

recharts 19.4k Jan 2, 2023
:bar_chart: A D3-based reusable chart library

c3 c3 is a D3-based reusable chart library that enables deeper integration of charts into web applications. Follow the link for more information: http

C3.js 9.2k Jan 2, 2023
GPL version of Javascript Gantt Chart

dhtmlxGantt Getting started | Features | Follow us | License | Useful links dhtmlxGantt is an open source JavaScript Gantt chart that helps you illust

null 952 Dec 29, 2022