109 Repositories
JavaScript visualization-grammar Libraries
Beautiful Visualizations For Your App's Dependencies 🧭
Beautiful Visualizations For Your App's Dependencies 🪱 Outputs SVGs Powered by D3 Overlays security vulnerabilities Works with npm & yarn Made by the
GPU supercharged attraction-graph visualizations built on top of Three.js
Force Directed Graph GPU supercharged attraction-graph visualizations for the web built on top of Three.js. Importable as an ES6 module. Simulation co
Automatically construct, traverse and visualize graphs generated from your Node.js project

skott is a minimalist developer tool that can be used to efficiently generate directed graphs from your JavaScript/Node.js project. It can automatical
VaaS Visualization tool for OpenFaas
VaaS VaaS Visualization tool for OpenFaas Installation Clone this repository onto your local machine git clone https://github.com/oslabs-beta/VaaS.gi
🦕 Deno port of Microsoft/vscode-textmate: A library that helps tokenize text using TextMate grammars.
TextMate A library that helps tokenize text using TextMate grammars. Deno port of Microsoft/vscode-textmate. See original license here. An interpreter
Homework Assignments for Visualization for Data Science, Fall 2022, University of Utah
Homeworks for Utah's Vis for Data Science Course In subfolders in this directory you will find the homeworks for CS 6630 / CS 5630 / DS 4630 – Visuali
Open source CSS framework for data visualization.
Charts.css Charts.css is an open source CSS framework for data visualization. Visualization help end-users understand data. Charts.css help frontend d
Audio visualizer library for javascript. Create dynamic animations that react to an audio file or audio stream.
Wave.js Audio visualizer library for javascript. Installation Install With CDN script src="https://cdn.jsdelivr.net/gh/foobar404/wave.js/dist/bundle.
A Javascript library to export svg charts from the DOM and download them as an SVG file, PDF, or raster image (JPEG, PNG) format. Can be done all in client-side.
svg-exportJS An easy-to-use client-side Javascript library to export SVG graphics from web pages and download them as an SVG file, PDF, or raster imag
A regular table library, for async and virtual data models.
A Javascript library for the browser, regular-table exports a custom element named regular-table, which renders a regular HTML table to a sticky p
An open-source visualization tool for monitoring Kafka cluster metrics

GitHub Tutorial Hyperion An open-source Kafka monitoring tool built for developers hyperionapp.dev Table of Contents About the Project Built With Gett
Easy Pan and Zoom JS Library
EasyPZ Use this Javascript library to make your web visualization interactive via pan and zoom, for mobile and desktop! EasyPZ supports many interacti
A lightweight JavaScript library for creating interactive maps and pretty data visualization.

Jsvectormap A lightweight Javascript library for creating interactive maps and pretty data visualization. Explore docs . Report bug · View demo · Down
A JavaScript library for visualizing Sankey diagrams.
SanKEY.js v1.0.0 last updated: 20.07.2022 Getting started SanKEY.js is a JavaScript data visualization library that provides a simple object-oriented
A graphical web-based audio visualizer which reads music data using Pure JavaScript, and draws a graphical view in Canvas.

Audio Visualizer JS A graphical web-based audio visualizer which reads music data using Pure JavaScript, and draws a graphical view in Canvas. Demo: h
Compare James Webb Space Telescope images to older images.

How much more powerful is the James Webb Space Telescope when compared to Hubble? Find out! More info Want to help out? CONTRIBUTING.md Blog post with
📱📈An elegant, interactive and flexible charting library for mobile.

F2,一个专注于移动,开箱即用的可视化解决方案,完美支持 H5 环境同时兼容多种环境(node, 小程序,weex)。完备的图形语法理论,满足你的各种可视化需求。专业的移动设计指引为你带来最佳的移动端图表体验。英文 README 在此衷心感谢《The Grammar of Graphics》的作者
D3 (or D3.js) is a JavaScript library for visualizing data using web standards
D3 (or D3.js) is a JavaScript library for visualizing data using web standards. D3 helps you bring data to life using SVG, Canvas and HTML. D3 combines powerful visualization and interaction techniques with a data-driven approach to DOM manipulation, giving you the full capabilities of modern browsers and the freedom to design the right visual interface for your data.
A general purpose, real-time visualization library.
Epoch By Ryan Sandor Richards Epoch is a general purpose charting library for application developers and visualization designers. It focuses on two di
A web app demonstrating how the Fourier series can be used to approximate user-inputted line drawing
Fourier Series Animation An interactive React web app that demonstrates how an arbitrary user-inputted line drawing can be approximated using the Four
A web-based 3D visualization tool for 3D computer vision.

Wis3D: A web-based 3D visualization tool for 3D computer vision Online Demo | Installation | Tutorial | Documentation Wis3D is a web-based 3D visualiz
Bertin.js is a JavaScript library for visualizing geospatial data and make thematic maps for the web.

Bertin.js is a JavaScript library for visualizing geospatial data and make thematic maps for the web. The project is under active development. Some of
Render echarts in obsidian,Apache ECharts,An Open Source JavaScript Visualization Library

obsidian-echarts Render echarts in obsidian,Apache ECharts,An Open Source JavaScript Visualization Library
Python based web application to import, connect and analyze manufacturing data from multiple data sources.

Analysis Platform Analysis Platform is an open source web application to import, connect and visualize factory IoT data. It helps to collect, link and
A powerful data visualization 2D/3D large-screen editor tool with low-code.
tp-editor(2D/3D)中文说明 A topology 2D/3D editor with nodejs, express, socket.io es6, HT for Web and vite. It's a powerful large-screen data visualization
Analytics and insights for data aggregated from multiple bridges and chains.

Inter-Bridge-Visualizer Analytics and insights for data aggregated from multiple bridges and chains. Website at bridgeexplorer.xyz Background Bridges
An open-source visualization library specialized for authoring charts that facilitate data storytelling with a high-level action-driven grammar.

Narrative Chart Introduction Narrative Chart is an open-source visualization library specialized for authoring charts that facilitate data storytellin
A Multi-Agent Path Finding visualization website.

MAPF Visualizer A visualization tool for multi-agent path finding algorithms. About The Project This project provides a visualization tool for Multi-A
🧙 Mage is an open-source data management platform that helps you clean data and prepare it for training AI/ML models.

Intro Mage is an open-source data management platform that helps you clean data and prepare it for training AI/ML models. What does this do? The curre
Neo: Hierarchical Confusion Matrix Visualization
Neo: Hierarchical Confusion Matrix The confusion matrix, a ubiquitous visualization for helping people evaluate machine learning models, is a tabular
OSINT - Data Visualization - Blockchain - Awareness - Scam
poorSKeme OSINT - Data Visualization - Blockchain - Awareness - Scam Install Go to this site and click on the downdload button Or go to release sectio
Timeline/Graph2D is an interactive visualization chart to visualize data in time.

vis-timeline The Timeline/Graph2D is an interactive visualization chart to visualize data in time. The data items can take place on a single date, or
Globe.GL - A web component to represent data visualization layers on a 3-dimensional globe in a spherical projection
A web component to represent data visualization layers on a 3-dimensional globe in a spherical projection. This library is a convenience wrap
The mitosheet package, trymito.io, and other public Mito code.
Mito Monorepo Mito is a spreadsheet that lives inside your JupyterLab notebooks. It allows you to edit Pandas dataframes like an Excel file, and gener
neo4j graph visualization using d3.js

neo4jd3.js 基于d3.js的封装的图数据库的可视化界面,不依赖任何外部框架如: vue, react等;内部实现了节点的展示 Code structure ├── core # core 核心功能 │ └── neo4jToolsIcon
A tool to modify onnx models in a visualization fashion, based on Netron and flask.
English | 简体中文 Introduction To edit an ONNX model, One common way is to visualize the model graph, and edit it using ONNX Python API. This works fine.
JSON Visio is data visualization tool for your json data which seamlessly illustrates your data on graphs without having to restructure anything, paste directly or import file.
JSON Visio is data visualization tool for your json data which seamlessly illustrates your data on graphs without having to restructure anything, paste directly or import file.
3D visualization of music using Three.js and web audio API.

3D Music Visualization About 3D visualization of music using Three.js and web audio API Try it here Main screen Additional screen Technologies Languag
A Svelte template built with newsroom CMS's in mind
A Svelte starter template built with newsroom CMS's in mind. Dynamically create inline graphics based on the placement of figure elements with defined data-chart attributes.
A web application to 🔍inspect your GitHub Profile Stats📊 in a lucid way. Visualization made easy with Charts💡🚀

know-your-gitstats A web application to 🔍 inspect your GitHub Profile Stats 📊 in a lucid way. Visualization made easy with Charts 💡 🚀 . ✅ Features
Mercury: easily convert Python notebook to web app and share with others
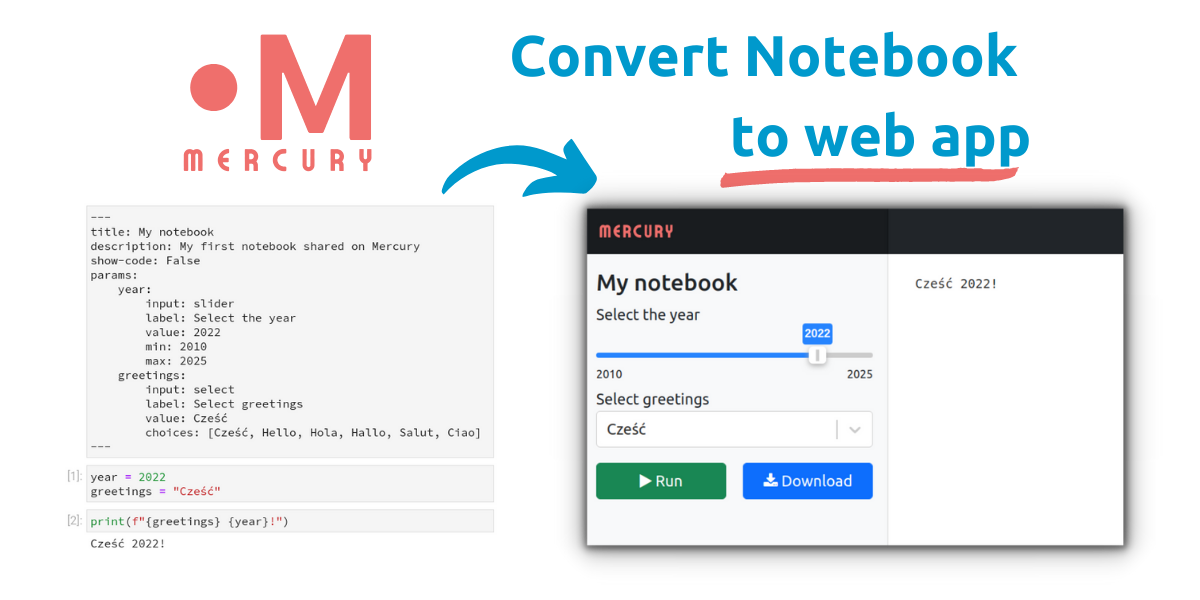
Mercury Share your Python notebooks with others Easily convert your Python notebooks into interactive web apps by adding parameters in YAML. Simply ad
An All-in-one Visualization Framework for TiddlyWiki5 based on ECharts
ECharts for TiddlyWiki5 When I first started using TiddlyWiki a long time ago, I wanted TiddlyWiki to be able to visualize data. I wanted to generate
Synchro Charts is a front-end component library that provides a collection of components to visualize time-series data.
Synchro Charts Synchro Charts is a front-end component library that provides a collection of components to visualize time-series data. You can learn m
React components for Chart.js, the most popular charting library
react-chartjs-2 React components for Chart.js, the most popular charting library. Supports Chart.js v3 and v2. Quickstart • Docs • Slack • Stack Overf
The power of Chart.js in Jupyter !

The power of Chart.js in Jupyter Notebooks Installation You can install ipychart from your terminal using pip or conda: # using pip $ pip install ipyc
🍞📊 Beautiful chart for data visualization.

🍞 📈 Spread your data on TOAST UI Chart. TOAST UI Chart is Beautiful Statistical Data Visualization library. 📦 Packages The functionality of TOAST U
Diagram-maker - A library to display an interactive editor for any graph-like data.

Diagram Maker Diagram Maker is a library to display an interactive editor for any graph-like data. Following is a screenshot from one of the consumers
All five assignments and the final group project is done in class CSCI5410 (Serverless Data Processing) Fall 2021 of MACS at Dalhousie University.
Dalhousie University | Fall 2021 | CSCI5410 | SDP (Serverless Data Processing) All five assignments and the final group project is done in class CSCI5
A monitoring and visualization tool for Apache Kafka.
An open source monitoring tool for Apache Kafka Table of Contents Features Demo Installation Engineering Team Features User-friendly GUI Insights into
Algorithm visualizer made with React, Material UI and P5JS.
Made with React, P5JS and Material UI. Link https://andresrodriguez55.github.io/algorithmsVisualizer/#/ Description The purpose of doing this was to l
This is 2D Black Hole Visualization
.png)
Blackhole Live demo Blackhole Calculations How to run in your machine? Clone or download ZIP file Then open HTML file in VS code and run with live ser
Open-source list of data visualization tools for software developers 📊📈

awesome.cube.dev — charts, data grids, maps, etc. Choose the best tool for your needs by type, framework, language, or license. Get started in an inst
Create, visualize and deploy AI solutions.
Welcome to the Hal9 community repo! This repo contains all the community-contributed scripts that power hal9.ai. We intend to share profits with creat
SandDance - Visually explore, understand, and present your data.
Visually explore, understand, and present your data.
📈 A small, fast chart for time series, lines, areas, ohlc & bars

📈 μPlot A small (~35 KB min), fast chart for time series, lines, areas, ohlc & bars (MIT Licensed) Introduction μPlot is a fast, memory-efficient Can
3D graph viewer powered by WebGL (three.js)
Graphosaurus A three-dimensional static graph viewer. (click the image to try it out) Demos EVE Online map Add nodes incrementally Documentation JSDoc
Create beautiful JavaScript charts with one line of Ruby
Chartkick Create beautiful JavaScript charts with one line of Ruby. No more fighting with charting libraries! See it in action Chartkick 4.0 was recen
📊 Interactive JavaScript Charts built on SVG
A modern JavaScript charting library to build interactive charts and visualizations with simple API. Our Partner ApexCharts is now a partner of Fusion
DataSphereStudio is a one stop data application development& management portal, covering scenarios including data exchange, desensitization/cleansing, analysis/mining, quality measurement, visualization, and task scheduling.
English | 中文 Introduction DataSphere Studio (DSS for short) is WeDataSphere, a big data platform of WeBank, a self-developed one-stop data application
Apache Superset is a Data Visualization and Data Exploration Platform
Superset A modern, enterprise-ready business intelligence web application. Why Superset? | Supported Databases | Installation and Configuration | Rele
Make Your Company Data Driven. Connect to any data source, easily visualize, dashboard and share your data.
Redash is designed to enable anyone, regardless of the level of technical sophistication, to harness the power of data big and small. SQL users levera
Open-source JavaScript charting library behind Plotly and Dash
Plotly.js is a standalone Javascript data visualization library, and it also powers the Python and R modules named plotly in those respective ecosyste
Gephi - The Open Graph Viz Platform
Gephi - The Open Graph Viz Platform Gephi is an award-winning open-source platform for visualizing and manipulating large graphs. It runs on Windows,
Apache ECharts is a powerful, interactive charting and data visualization library for browser
Apache ECharts Apache ECharts is a free, powerful charting and visualization library offering an easy way of adding intuitive, interactive, and highly
Analytical Web Apps for Python, R, Julia, and Jupyter. No JavaScript Required.

Dash Dash is the most downloaded, trusted Python framework for building ML & data science web apps. Built on top of Plotly.js, React and Flask, Dash t
Location Intelligence & Data Visualization tool
What is CARTO? CARTO is an open, powerful, and intuitive platform for discovering and predicting the key insights underlying the location data in our
Visualization of all roads within any city
city-roads Render every single road in any city at once: https://anvaka.github.io/city-roads/ How it is made? The data is fetched from OpenStreetMap u
geotiff.js is a small library to parse TIFF files for visualization or analysis. It is written in pure JavaScript, and is usable in both the browser and node.js applications.
geotiff.js Read (geospatial) metadata and raw array data from a wide variety of different (Geo)TIFF files types. Features Currently available function
React friendly API wrapper around MapboxGL JS
react-map-gl | Docs react-map-gl is a suite of React components designed to provide a React API for Mapbox GL JS-compatible libraries. More informatio
WebGL2 powered geospatial visualization layers
deck.gl | Website WebGL2-powered, highly performant large-scale data visualization deck.gl is designed to simplify high-performance, WebGL-based visua
A visualization grammar. Moved to: https://github.com/vega/vega
Vega: A Visualization Grammar Vega is a visualization grammar, a declarative format for creating and saving interactive visualization designs. With Ve
JavaScript library for HTML5 & CSS3 time sheets
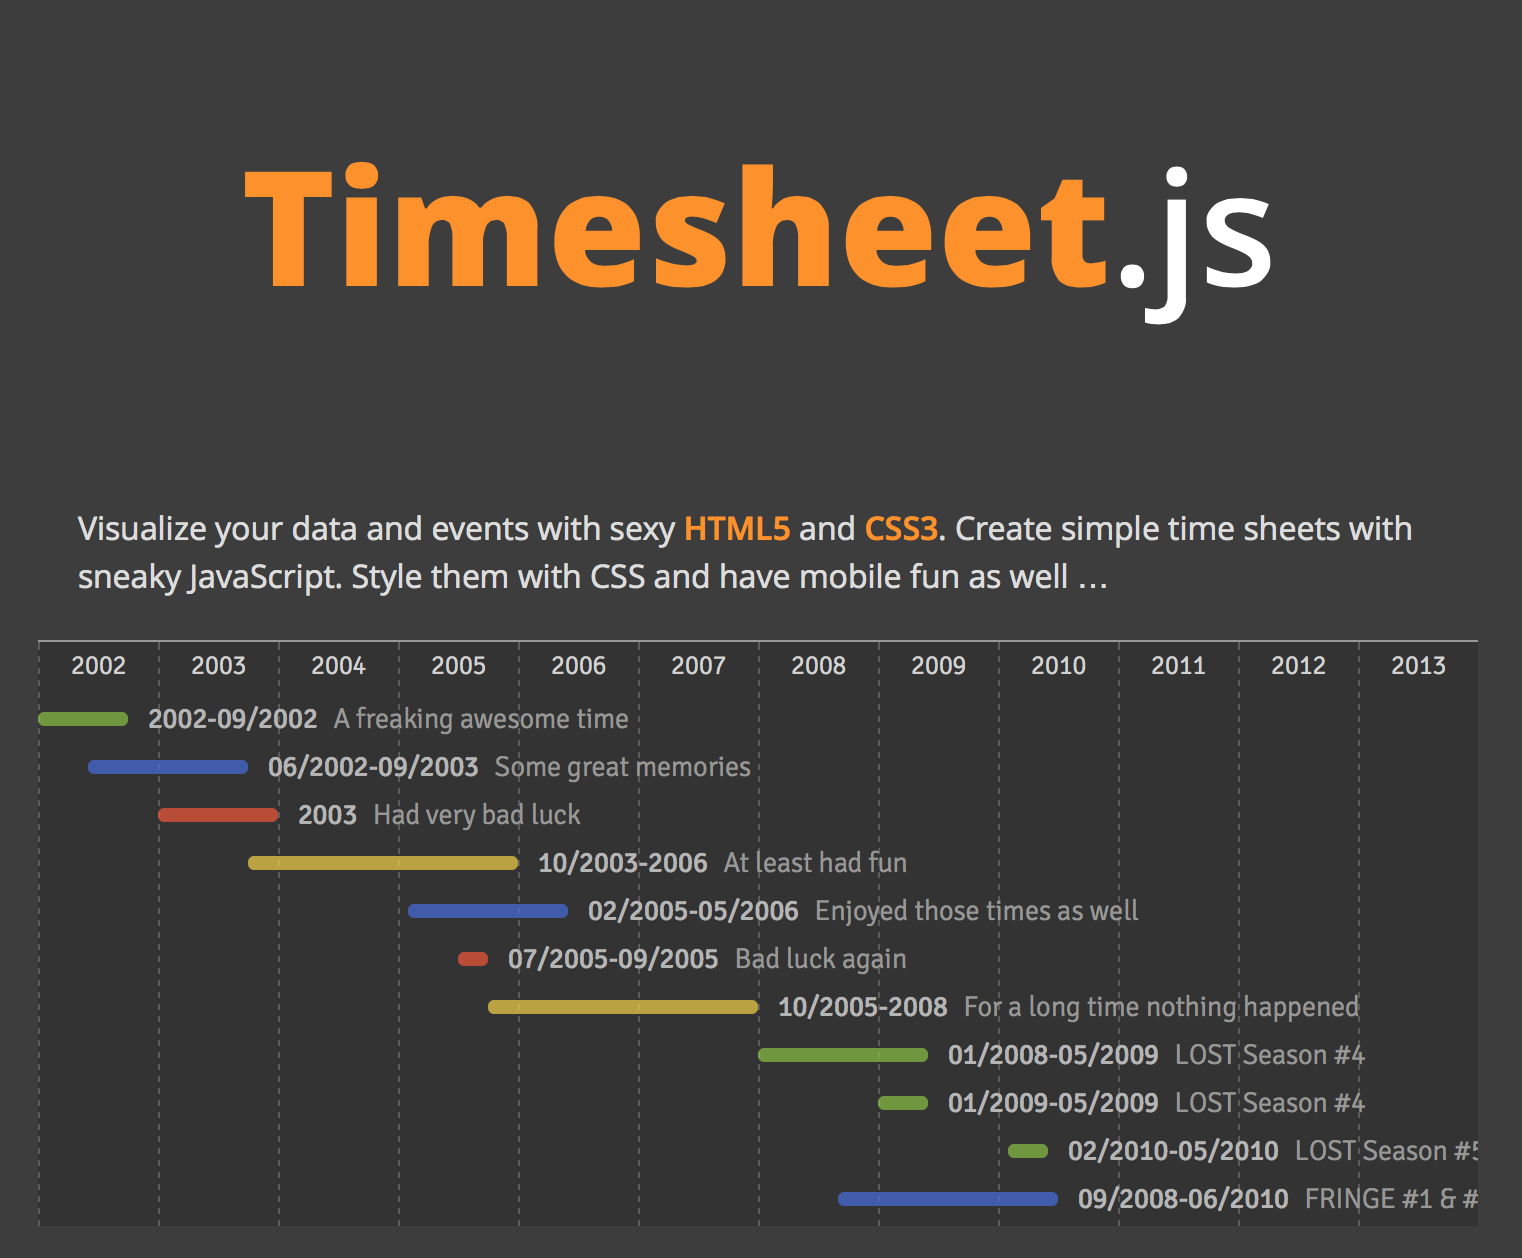
Timesheet.js Simple JavaScript library to create HTML time sheets. Wrapped in an example project using Middleman … You only have to include dist/times
React + Canvas = Love. JavaScript library for drawing complex canvas graphics using React.
React Konva React Konva is a JavaScript library for drawing complex canvas graphics using React. It provides declarative and reactive bindings to the
A library for visualization and creative-coding

Pts Pts is a typescript/javascript library for visualization and creative-coding. Get started at ptsjs.org. Please give it a try, file issues, and sen
📱📈An elegant, interactive and flexible charting library for mobile.

中文 README F2 is born for mobile, developed for developers as well as designers. It is Html5 Canvas-based, and is also compatible with Node.js, Weex an
React friendly API wrapper around MapboxGL JS
react-map-gl | Docs react-map-gl is a suite of React components designed to provide a React API for Mapbox GL JS-compatible libraries. More informatio
Data Visualization Components

react-vis | Demos | Docs A COMPOSABLE VISUALIZATION SYSTEM Overview A collection of react components to render common data visualization charts, such
A collection of composable React components for building interactive data visualizations

an ecosystem of composable React components for building interactive data visualizations. Victory Contents Getting Started Victory Native API Document
🐯 visx | visualization components

visx visx is a collection of reusable low-level visualization components. visx combines the power of d3 to generate your visualization with the benefi
An interactive git visualization and tutorial. Aspiring students of git can use this app to educate and challenge themselves towards mastery of git!

LearnGitBranching LearnGitBranching is a git repository visualizer, sandbox, and a series of educational tutorials and challenges. Its primary purpose
:fireworks:Interactive Online Platform that Visualizes Algorithms from Code
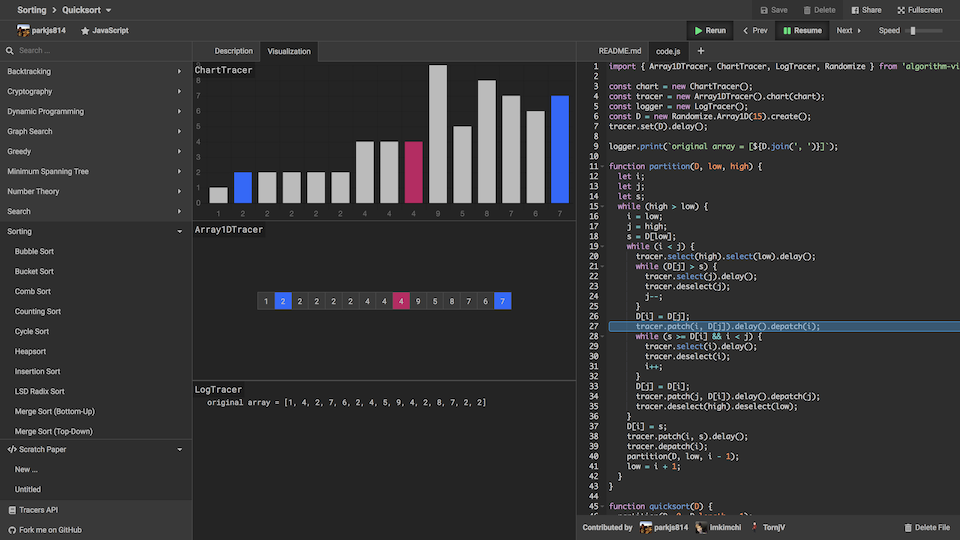
Algorithm Visualizer Algorithm Visualizer is an interactive online platform that visualizes algorithms from code. Learning an algorithm gets much easi
📊 Data visualization library for React based on D3
Data visualization library for React based on D3js REAVIZ is a modular chart component library that leverages React natively for rendering the compone
A React toolkit for graph visualization based on G6
Graphin A React toolkit for graph analysis based on G6 English | 简体中文 ✨ Features 🎨 Good-looking elements, standardized style configuration Graphin st
Composable data visualisation library for web with a data-first approach now powered by WebAssembly
What is Muze? Muze is a free data visualization library for creating exploratory data visualizations (like Tableau) in browser, using WebAssembly. It
🌏 A Declarative 3D Globe Data Visualization Library built with Three.js
Gio.js English | 中文 React Version: react-giojs Wechat minigame: wechat usage Gio.js is an open source library for web 3D globe data visualization buil
A data visualization framework combining React & D3
Semiotic is a data visualization framework combining React & D3 Interactive Documentation API Docs on the wiki Examples Installation npm i semiotic E
Interactive visualizations of time series using JavaScript and the HTML canvas tag

dygraphs JavaScript charting library The dygraphs JavaScript library produces interactive, zoomable charts of time series: Learn more about it at dygr
🍞📊 Beautiful chart for data visualization.
🍞 📈 Spread your data on TOAST UI Chart. TOAST UI Chart is Beautiful Statistical Data Visualization library. 📦 Packages The functionality of TOAST U
Powerful data visualization library based on G2 and React.

BizCharts New charting and visualization library has been released: http://bizcharts.net/products/bizCharts. More details about BizCharts Features Rea
Reusable JavaScript library for creating sketchy/hand-drawn styled charts in the browser.

roughViz.js is a reusable JavaScript library for creating sketchy/hand-drawn styled charts in the browser, based on D3v5, roughjs, and handy. Why? Use
a super simple, no-nonsense diagramming library written in react that just works
Introduction DEMO: http://projectstorm.cloud/react-diagrams DOCS (wip) https://projectstorm.gitbook.io/react-diagrams Docs are currently being worked
Data visualization library for depicting quantities as animated liquid blobs
liquidity.js A data visualization library for depicting quantities as animated liquid blobs. For a demonstration of what the final product can look li
vizflow is an ES6 interactive visualization engine

Vizflow vizflow.js - a render-loop library written using EcmaScript.6 (ES6) with no other external dependencies. Vizflow is a relatively small library
Dynamic HTML5 visualization
Envision.js Fast interactive HTML5 charts. http://groups.google.com/group/envisionjs/ Features Modern Browsers, IE 6+ Mobile / Touch Support Pre-built
:dango: An interactive and responsive charting library
English | 简体中文 G2Plot A charting library based on the Grammar of Graphics. G2Plot is an interactive and responsive charting library. Based on the gram
Beautiful React SVG maps with d3-geo and topojson using a declarative api.
react-simple-maps Create beautiful SVG maps in react with d3-geo and topojson using a declarative api. Read the docs, or check out the examples. Why R
a graph visualization library using web workers and jQuery
arbor.js -------- Arbor is a graph visualization library built with web workers and jQuery. Rather than trying to be an all-encompassing framework, a
A port of the Processing visualization language to JavaScript.
⚠️ This project has been archived ⚠️ With the development of p5js and the API advances in Processing itself, as well as Processing.js itself having be
A general purpose, real-time visualization library.
Epoch By Ryan Sandor Richards Epoch is a general purpose charting library for application developers and visualization designers. It focuses on two di
Cubism.js: A JavaScript library for time series visualization.
Cubism.js Cubism.js is a D3 plugin for visualizing time series. Use Cubism to construct better realtime dashboards, pulling data from Graphite, Cube a