Streamline Your Node.js Debugging Workflow with Chromium (Chrome, Edge, More) DevTools.

Overview


NiM Logo

Google Reviews

NiM (Node.js --inspector Manager)

Streamlines your development process
  • Google Chrome Web Store (works with any Chromium browsers: Google's Chrome, Microsoft's Edge, Opera, Vivaldi, Brave, Epic, and more... )

  • Microsoft Edge Addons (Works with the Microsoft's Edge browser https://www.microsoftedgeinsider.com/en-us/)

    PLEASE NOTE: Installing this does require the sharing of your email address with me (and only me). You are given other notice of this, but it's become and remains such an issue that I feel the need to make it OVER-abundantly clear. If you take issue with sharing your email address with me (mine is [email protected] by the way) please, I implore you to clone/fork a copy yourself and change what you don't like about the code and/or use alternate solutions (none of which are as good as NiM, but call me biased). Further feel free to contact me directly and have a chat. Unlike the behemoths like Facebook, Google, Amazon that you probably (and without hesitation) share your email address with, I actually care about the concerns of the actual people who choose to use the code I wrote (~99%) and am responsible for. Here is the privacy policy that goes along with NiM https://june07.com/privacypolicy. Thank you so much.

Blog Posts/Updates:

Now integrates with VSCode using NiMS VSCode Extension VSCode Integration

Easier than about::inspect (chrome://inspect/#devices)

NiM manages the Chrome DevTools window/tab lifecycle leaving you with more ability to focus on what matters... debugging your code. You no longer need to copy/paste DevTools URL's or continue opening/closing tabs/windows.

NiM automatically detects the URL that is generated when running node (locally or remotely) with --inspect option. NiM provides you with the option of automatically opening and closing Chrome DevTools in a tab or window. Just toggle the Manual/Auto setting and then start a debugging session. DevTools will open either on clicking the "Open DevTools" button or after the specified timeout period. If set to auto close, once you end your debugging session, The DevTools tab/window will close automatically.

  • Manage and monitor local and remote debugging sessions
  • Manual or automatic control of DevTools interface
  • Open DevTools in a new tab or window
  • Make DevTools focused or inactive on start
  • Customize duration between v8 Inspector probes
  • Autosave settings
  • Debug node processes launched by VSCode

Setup / Usage / How To

Simple and basic... just install the Chrome Extension in any of the following ways:

  1. Install via Chrome Web Store: https://bit.ly/2W8hQG9 (https://chrome.google.com/webstore/detail/gnhhdgbaldcilmgcpfddgdbkhjohddkj)
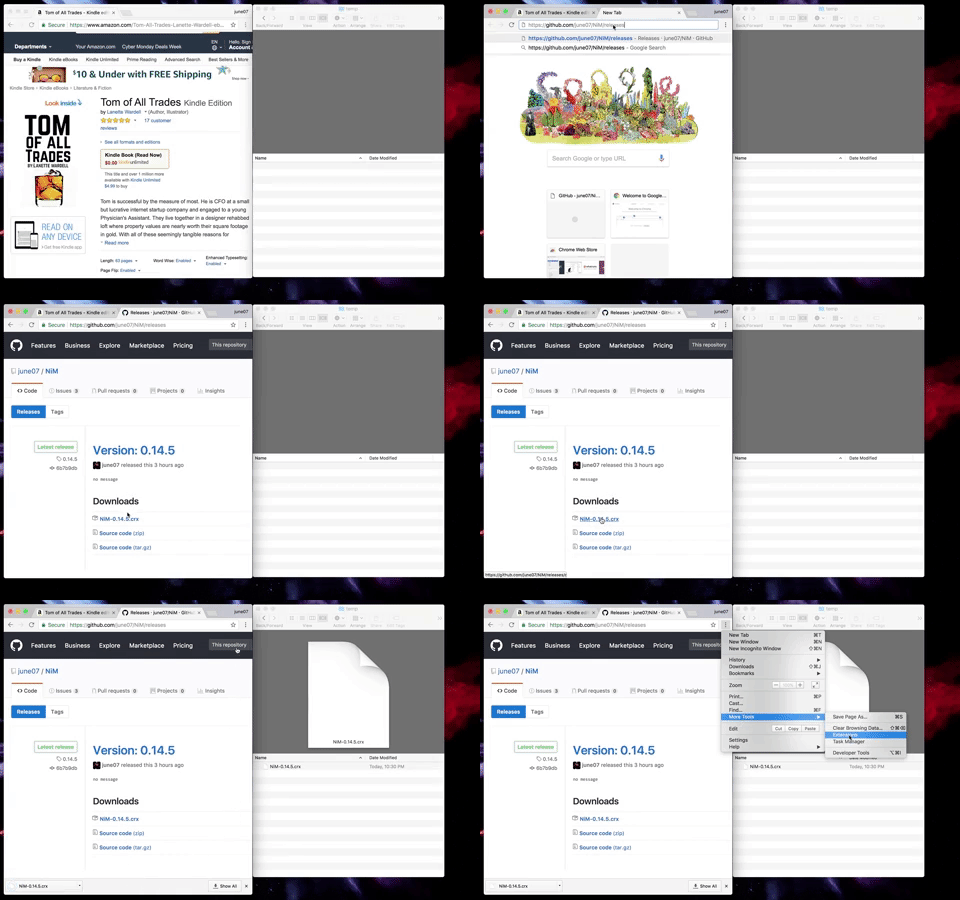
  2. Or, download .crx file directly from releases as shown here:

https://media.giphy.com/media/xT0xenBpYPF2F0j2fe/giphy.gif

Need Additional Information?

Note: At the time of writing, the v8 --inspect option is fairly new. See https://nodejs.org/api/debugger.html#debugger_v8_inspector_integration_for_node_js for additional details on the option.

If you enjoy using NIM please give us a 5 star rating and/or a G+1.

Any and all feedback is encouraged and welcome. Send us an email!

IPv4 Lease

Comments
  • Latest Chrome update V76 stopped extension opening up new tab / finding local host

    Latest Chrome update V76 stopped extension opening up new tab / finding local host

    I have noticed that since the latest update of Chrome V76 the extension is not opening up a new tab automatically for the devtools and looks like it's not picking up the WS as per the screenshot? image The work around I have had to do is start the debugger and then open up chrome://inspect then click on the inspect link to open the devtools for that WS. image

    opened by karlos125 23
  • FR: watch multiple ports

    FR: watch multiple ports

    Dude, I love this extension, many thanks!

    Small niggle, I have a couple of services running at the same time and I find that I often need to switch between them... would it be difficult to have NIM listen for multiple ports, and open devtools for each?

    The deluxe version of this feature would be to have a user configured list of ports, each with a toggle and a manual button...

    Food for thought... thanks again :)

    opened by ptim 14
  • Extension crashes on clicking on the extension icon

    Extension crashes on clicking on the extension icon

    Thanks a lot for such useful tool!

    Unfortunately at some point the extension started crashing on my machine when i click on it (Ubuntu 16.04, Chrome 59). Maybe you have any idea where is the source of this issue?

    opened by EdwardDiehl 12
  • Chrome tab not closing properly when using Nodemon

    Chrome tab not closing properly when using Nodemon

    I have an issue where restarting my server through Nodemon does not close the tab, but instead renders this error message:

    screenshot 2016-12-17 21 19 28

    After looking through the source code I think I've isolated the problem to here. The catch for the HTTP request does not consider a valid case where the debug server is not down, but the ID of the debugger websocket changes.

    A proposed solution would be to store the unique identifier for each devtools session, and check if that identifier is in the returned JSON from the localhost debug server. Requests coulda also be minimized by making the request only once and filtering $scope.devToolsSessions according to the returned identifiers.

    I'd be willing to PR this in the next couple days with your OK @june07

    Edit: Initial conversation about this issue can be found here.

    opened by ebramanti 10
  • extension not saves auto/handle tumbler and not saves inspector-settings

    extension not saves auto/handle tumbler and not saves inspector-settings

    NiM extension is beautiful, but after a year of rest, I launched it again on a new project and discovered two problems.

    • extension not saves auto/handler tubler (my tumbler even a little buggy and glitch, i can record gif, seem to be low-fps gpu)
    • chrome inspector not saves console options

    MacOs 10.14.6 Mojave, Chrome 80.0.3987.132

    Снимок экрана 2020-03-10 в 11 29 57 Снимок экрана 2020-03-10 в 11 25 43

    opened by ibyteyou 9
  • Sourcemaps aren't rectified

    Sourcemaps aren't rectified

    When using the plug-in, sourcemaps for babel aren't been mapped to the source. This is similar in symptom to NodeJS issue #8369 -- however, when I access the dev tools using chrome://inspect the issue is not seen.

    Love this plug-in and would be happy to help however is needed-- I can perform more info as needed and would be willing to take a crack at opening a PR if I could get some direction.

    Thanks.

    opened by anied 9
  • NiM keyboard shortcut issue

    NiM keyboard shortcut issue

    I am getting a weird macOS (11.3.1) system notification when I try to use the NiM keyboard shortcut, option-I — see the attached screenshot, it's just Chrome telling me that NiM owns the shortcut, but nothing happens. (In other words, I type the shortcut and get the notification telling me NiM owns it, but DevTools doesn't open.)

    Any thoughts?

    I'm running Chrome 90.0.4430.93 (Official Build) (x86_64), NiM 2.8.0, and macOS 11.3.1 (20E241).

    Screen Shot 2021-05-06 at 11 06 13 AM
    opened by delfuego 7
  • Problem to start the extension

    Problem to start the extension

    problem remains also after uninstall and reinstall of the extension Workaround: in chrome developer console goto Application, right click on local storage and clear.

    Uncaught (in promise) TypeError: Cannot assign to read only property 'length' of object '#' at SettingsStorage.setPreference [as _setCallback] (host.js:106) at SettingsStorage.set (common.js:330) at VersionController._migrateSettingsFromLocalStorage (common.js:429) at VersionController._updateVersionFrom11To12 (common.js:396) at VersionController.updateVersion (common.js:366) at MainImpl._createSettings (main.js:37) at MainImpl._gotPreferences (main.js:34) at InspectorFrontendHostStub.getPreferences (host.js:105) at MainImpl._loaded (main.js:32)

    opened by oweitman 7
  • Does NIM adaptable to other application than Node

    Does NIM adaptable to other application than Node

    Hello I'm currently integrating V8Inspector in my company application that already embeds V8. I'm currently facing the issue your plugin NIM has already solved for Node : how to simplify the start of a debug session ? Do you think it's possible to use NIM to automate the launching of CDT in my application? Thanks and regards Aligre

    opened by daduroy 7
  • NiM inappropriately intercepts `cmd+i`

    NiM inappropriately intercepts `cmd+i`

    Environment

    OS X 10.12.6 (16G29) Chrome 60.0.3112.90 (Official Build) (64-bit) NiM 0.13.8

    What happened?

    After installing NiM, I was working in Google Docs and attempted to use cmd+i to italicize some text but nothing happened. Disabling NiM, cmd+i worked again. Inspecting manifest.json, I noticed that cmd+i was registered as the open devtools keyboard shortcut when it should be cmd+option+i (View -> Developer -> Developer Tools ⌥⌘I).

    What did you expect to happen?

    I did not expect NiM to intercept keyboard shortcuts.


    Thank you for NiM, for the reasons you outline in your blog post it's a real time saver. 🍻

    opened by clayzermk1 7
  • Why does NiM need an active internet connection in order to operate?

    Why does NiM need an active internet connection in order to operate?

    It turns out NiM doesn't work without an active internet connection because it tries to connect to http://chrome-devtools-frontend.june07.com/.

    Why does NiM need that while chrome://inspect/#devices perfectly works without it?

    More importantly, how can we configure NiM to work without an internet connection?

    opened by ceremcem 6
  • Feature Request: Focus window only when debugger is paused

    Feature Request: Focus window only when debugger is paused

    The "Make Window Focused." option does not fit my workflow, so I disable it. However, it is useful to be notified when debugger pauses (at a breakpoint or when an exception is caught).

    It would be helpful to have a "Make Window Focused On Debugger Pause" option.

    opened by ceremcem 7
  • Getting error WebSocket disconnected

    Getting error WebSocket disconnected

    Hi,

    I'm getting an error on startup; this is what I'm doing.

    I configure the host to be "auto" in NiM: image

    I create a simple main.js file, and then I run it using node --inspect-brk main.js. NiM detects the URL and opens, but I get the following error: image

    OS & Versions: OS: Manjaro Linux Node: v14.4.0 NiM: 2.4.2 (as seen by the first screenshot)

    Thank you

    opened by farzadmf 8
Releases(2.8.0)
[OBSOLETE] runs Node.js programs through Chromium DevTools

devtool ⚠️ Update: This tool is mostly obsolete as much of the philosophy has been brought into Node/DevTool core, see here for details. If you wish t

Jam3 3.8k Dec 20, 2022
A tiny JavaScript debugging utility modelled after Node.js core's debugging technique. Works in Node.js and web browsers

debug A tiny JavaScript debugging utility modelled after Node.js core's debugging technique. Works in Node.js and web browsers. Installation $ npm ins

Sloth 10.5k Dec 30, 2022
📡 Encrypt and authenticate DevTools to use it securely remotely. Add HTTPS, and authentication to --remote-debugging-port to debug, inspect and automate from anywhere and collaborate securely on bugs.

?? Encrypt and authenticate DevTools to use it securely remotely. Add HTTPS, and authentication to --remote-debugging-port to debug, inspect and automate from anywhere and collaborate securely on bugs.

Cris 9 May 5, 2022
thetool is a CLI tool to capture different cpu, memory and other profiles for your node app in Chrome DevTools friendly format

thetool thetool is a CLI tool to capture different cpu, memory and other profiles for your node app in Chrome DevTools friendly format. Quick start np

null 200 Oct 28, 2022
A simple Chromium browser extension to every so often Rickroll yourself. Every link you click has a 1% chance of being a Rickroll.

Rick Rollette A simple Chromium browser extension to every so often Rickroll yourself. Every link you click has a 1% chance of being a Rickroll. How t

Davi Augusto Moreira da Silva 43 Jun 9, 2022
🚀 zx - Bring your Discord's devtools back to life

discord-enable-devtools Bring your Discord's devtools back to life TL;DR Discord devtools was disabled, see more. You can enable it again by adding th

Bruno Silva 5 Mar 10, 2022
Locus is a debugging module for node.js

ʆ Locus Locus is a debugging module which allows you to execute commands at runtime via a REPL. Installing npm install locus --save-dev Using require(

Ali Davut 300 Nov 13, 2022
🎸 A rsocket web devtools

rsocketMan ?? A devtool for rsocket protocol ?? Easy to help you to test your rsocket servers ?? Development Environment ?? Installation ?? In rsocket

Frozen FIsh 5 Jul 27, 2022
Debug Node.js code with Chrome Developer Tools.

Debug Node.js code with Chrome Developer Tools on Linux, Windows and OS X. This software aims to make things easier ?? . With ironNode you have the fu

Stephan Ahlf 2.3k Dec 30, 2022
Node is running but you don't know why? why-is-node-running is here to help you.

why-is-node-running Node is running but you don't know why? why-is-node-running is here to help you. Installation Node 8 and above: npm i why-is-node-

Mathias Buus 1.5k Dec 30, 2022
An lldb plugin for Node.js and V8, which enables inspection of JavaScript states for insights into Node.js processes and their core dumps.

Node.js v10.x+ C++ plugin for the LLDB debugger. The llnode plugin adds the ability to inspect JavaScript stack frames, objects, source code and more

Node.js 1k Dec 14, 2022
Node.js debugger based on Blink Developer Tools

Node Inspector Overview Node Inspector is a debugger interface for Node.js applications that uses the Blink Developer Tools (formerly WebKit Web Inspe

null 12.6k Dec 29, 2022
🐛 Memory leak testing for node.

Leakage - Memory Leak Testing for Node Write leakage tests using Mocha or another test runner of your choice. Does not only support spotting and fixin

Andy Wermke 1.6k Dec 28, 2022
Long stack traces for node.js inspired by https://github.com/tlrobinson/long-stack-traces

longjohn Long stack traces for node.js with configurable call trace length Inspiration I wrote this while trying to add long-stack-traces to my server

Matt Insler 815 Dec 23, 2022
API Observability. Trace API calls and Monitor API performance, health and usage statistics in Node.js Microservices.

swagger-stats | API Observability https://swaggerstats.io | Guide Trace API calls and Monitor API performance, health and usage statistics in Node.js

slana.tech 773 Jan 4, 2023
A Node.js tracing and instrumentation utility

njsTrace - Instrumentation and Tracing njstrace lets you easily instrument and trace you code, see all function calls, arguments, return values, as we

Yuval 354 Dec 29, 2022
He is like Batman, but for Node.js stack traces

Stackman Give Stackman an error and he will give an array of stack frames with extremely detailed information for each frame in the stack trace. With

Thomas Watson 242 Jan 1, 2023
ndb is an improved debugging experience for Node.js, enabled by Chrome DevTools

ndb ndb is an improved debugging experience for Node.js, enabled by Chrome DevTools Installation Compatibility: ndb requires Node >=8.0.0. It works be

null 10.8k Dec 28, 2022
[OBSOLETE] runs Node.js programs through Chromium DevTools

devtool ⚠️ Update: This tool is mostly obsolete as much of the philosophy has been brought into Node/DevTool core, see here for details. If you wish t

Jam3 3.8k Dec 20, 2022
A tiny JavaScript debugging utility modelled after Node.js core's debugging technique. Works in Node.js and web browsers

debug A tiny JavaScript debugging utility modelled after Node.js core's debugging technique. Works in Node.js and web browsers. Installation $ npm ins

Sloth 10.5k Dec 30, 2022