Filter By
280 Repositories
JavaScript Data Visualization
Automatic chart generator from user input using CharGPT.
Chart GPT A platorm for generate chart with ChatGPT 🛠️ ChatGPT Generator is under development. Features Light/dark mode toggle Live previews Fullscre
Simple yet flexible JavaScript charting for designers & developers
Simple yet flexible JavaScript charting for designers & developers Documentation All the links point to the new version 3 of the lib. Introduction Get
Apache ECharts is a powerful, interactive charting and data visualization library for browser

Apache ECharts Apache ECharts is a free, powerful charting and visualization library offering an easy way of adding intuitive, interactive, and highly
Highcharts JS, the JavaScript charting framework
Highcharts JS is a JavaScript charting library based on SVG, with fallbacks to VML and canvas for old browsers. Official website: www.highcharts.com D
A port of Phoenix LiveView to Typescript/Javascript
LiveViewJS Front-end framework for back-end developers Credit 🙌 This is a backend implementation of Phoenix LiveView in Typescript. What the Phoenix
ops - build and run nanos unikernels
OPS Ops is a tool for creating and running a Nanos unikernel. It is used to package, create and run your application as a nanos unikernel instance. Ch
Financial lightweight charts built with HTML5 canvas
Lightweight Charts Demos | Documentation | Discord community TradingView Lightweight Charts are one of the smallest and fastest financial HTML5 charts
A Cloudflare Worker that translates TeX to SVG
TeX SVG Worker A Cloudflare Worker that translates TeX to SVG.
React + Canvas = Love. JavaScript library for drawing complex canvas graphics using React.
React Konva React Konva is a JavaScript library for drawing complex canvas graphics using React. It provides declarative and reactive bindings to the
Create beautiful JavaScript charts with one line of Ruby
Chartkick Create beautiful JavaScript charts with one line of Ruby. No more fighting with charting libraries! See it in action Chartkick 4.0 was recen
Konva.js is an HTML5 Canvas JavaScript framework that extends the 2d context by enabling canvas interactivity for desktop and mobile applications.
Konva Konva is an HTML5 Canvas JavaScript framework that enables high performance animations, transitions, node nesting, layering, filtering, caching,
Simple HTML5 Charts using the canvas tag
Simple yet flexible JavaScript charting for designers & developers Documentation Currently, there are two versions of the library (2.9.4 and 3.x.x). V
📊 Vue.js wrapper for Chart.js

vue-chartjs vue-chartjs is a wrapper for Chart.js in vue. You can easily create reuseable chart components. Demo & Docs 📺 Demo 📖 Docs Compatibility
A React toolkit for graph visualization based on G6
Graphin A React toolkit for graph analysis based on G6 English | 简体中文 ✨ Features 🎨 Good-looking elements, standardized style configuration Graphin st
📈 A small, fast chart for time series, lines, areas, ohlc & bars

📈 μPlot A small (~35 KB min), fast chart for time series, lines, areas, ohlc & bars (MIT Licensed) Introduction μPlot is a fast, memory-efficient Can
🍞🎨 Full-featured photo image editor using canvas. It is really easy, and it comes with great filters.

Full featured image editor using HTML5 Canvas. It's easy to use and provides powerful filters. Packages toast-ui.image-editor - Plain JavaScript compo
🍞📊 Beautiful chart for data visualization.

🍞 📈 Spread your data on TOAST UI Chart. TOAST UI Chart is Beautiful Statistical Data Visualization library. 📦 Packages The functionality of TOAST U
Apache ECharts is a powerful, interactive charting and data visualization library for browser

Apache ECharts Apache ECharts is a free, powerful charting and visualization library offering an easy way of adding intuitive, interactive, and highly
Highly customizable, animated, responsive, and dependency-free Evolution Graph implementation

Highly customizable, animated, responsive, and dependency-free Evolution Graph implementation. The package is built with Vanilla JavaScript and is used to create flexible data visualizations and present evolution relationships between entities.
Web UI for PrestoDB.

Airpal Airpal is a web-based, query execution tool which leverages Facebook's PrestoDB to make authoring queries and retrieving results simple for use
基于react实现的滑动验证码组件
Hello react-slider-vertify! react-slider-vertify 是一款前端实现的滑动验证码组件, 我们可以通过它轻松的控制验证的整个生命周期(刷新时, 验证成功时, 验证失败时的回调), 并拥有一定的配置化能力. doc react-slider-vertify G
D3 (or D3.js) is a JavaScript library for visualizing data using web standards
D3 (or D3.js) is a JavaScript library for visualizing data using web standards. D3 helps you bring data to life using SVG, Canvas and HTML. D3 combines powerful visualization and interaction techniques with a data-driven approach to DOM manipulation, giving you the full capabilities of modern browsers and the freedom to design the right visual interface for your data.
Multi-Dimensional charting built to work natively with crossfilter rendered with d3.js
dc.js Dimensional charting built to work natively with crossfilter rendered using d3.js. In dc.js, each chart displays an aggregation of some attribut
tsParticles - Easily create highly customizable particles animations and use them as animated backgrounds for your website. Ready to use components available for React, Vue.js (2.x and 3.x), Angular, Svelte, jQuery, Preact, Inferno.
tsParticles - TypeScript Particles A lightweight TypeScript library for creating particles. Dependency free (*) and browser ready! Particles.js conver
Generate a TOC of any page anywhere to quickly access the page's content.

logseq-plugin-tocgen 在任何地方生成任一页面/块的目录,通过它你可以快速访问页面/块内容。同时提供了滚动回页面顶部的功能。 Generate a TOC of any page/block anywhere and quickly access the page/block's
Babylon.js is a powerful, beautiful, simple, and open game and rendering engine packed into a friendly JavaScript framework.
Babylon.js Getting started? Play directly with the Babylon.js API using our playground. It also contains a lot of samples to learn how to use it. Any
An open source project management tool with Kanban boards

An open source project management tool with Kanban boards
A platform for creating interactive data visualizations
owid-grapher This is the project we use at Our World in Data to create embeddable visualizations like this one (click for interactive): ⚠️ This projec
A port of the Processing visualization language to JavaScript.
⚠️ This project has been archived ⚠️ With the development of p5js and the API advances in Processing itself, as well as Processing.js itself having be
Analytical Web Apps for Python, R, Julia, and Jupyter. No JavaScript Required.

Dash Dash is the most downloaded, trusted Python framework for building ML & data science web apps. Built on top of Plotly.js, React and Flask, Dash t
Open source CSS framework for data visualization.
Charts.css Charts.css is an open source CSS framework for data visualization. Visualization help end-users understand data. Charts.css help frontend d
Reusable JavaScript library for creating sketchy/hand-drawn styled charts in the browser.

roughViz.js is a reusable JavaScript library for creating sketchy/hand-drawn styled charts in the browser, based on D3v5, roughjs, and handy. Why? Use
Beautiful charts for Angular based on Chart.js
ng2-charts slack Beautiful charts for Angular based on Chart.js Usage & Demo Samples using ng2-charts https://valor-software.com/ng2-charts/ Installat
qr code generator
node-qrcode QR code/2d barcode generator. Highlights Installation Usage Error correction level QR Code capacity Encoding Modes Binary data Multibyte c
matplotlib: plotting with Python
Matplotlib is a comprehensive library for creating static, animated, and interactive visualizations in Python. Check out our home page for more inform
Gephi - The Open Graph Viz Platform
Gephi - The Open Graph Viz Platform Gephi is an award-winning open-source platform for visualizing and manipulating large graphs. It runs on Windows,
a super simple, no-nonsense diagramming library written in react that just works

Introduction DEMO: http://projectstorm.cloud/react-diagrams DOCS (wip) https://projectstorm.gitbook.io/react-diagrams Docs are currently being worked
JavaScript SVG parser and renderer on Canvas
canvg JavaScript SVG parser and renderer on Canvas. It takes the URL to the SVG file or the text of the SVG file, parses it in JavaScript and renders
A plugin for the jQuery javascript library to generate small sparkline charts directly in the browser
jQuery Sparklines This jQuery plugin makes it easy to generate a number of different types of sparklines directly in the browser, using online a line
Open-source JavaScript charting library behind Plotly and Dash
Plotly.js is a standalone Javascript data visualization library, and it also powers the Python and R modules named plotly in those respective ecosyste
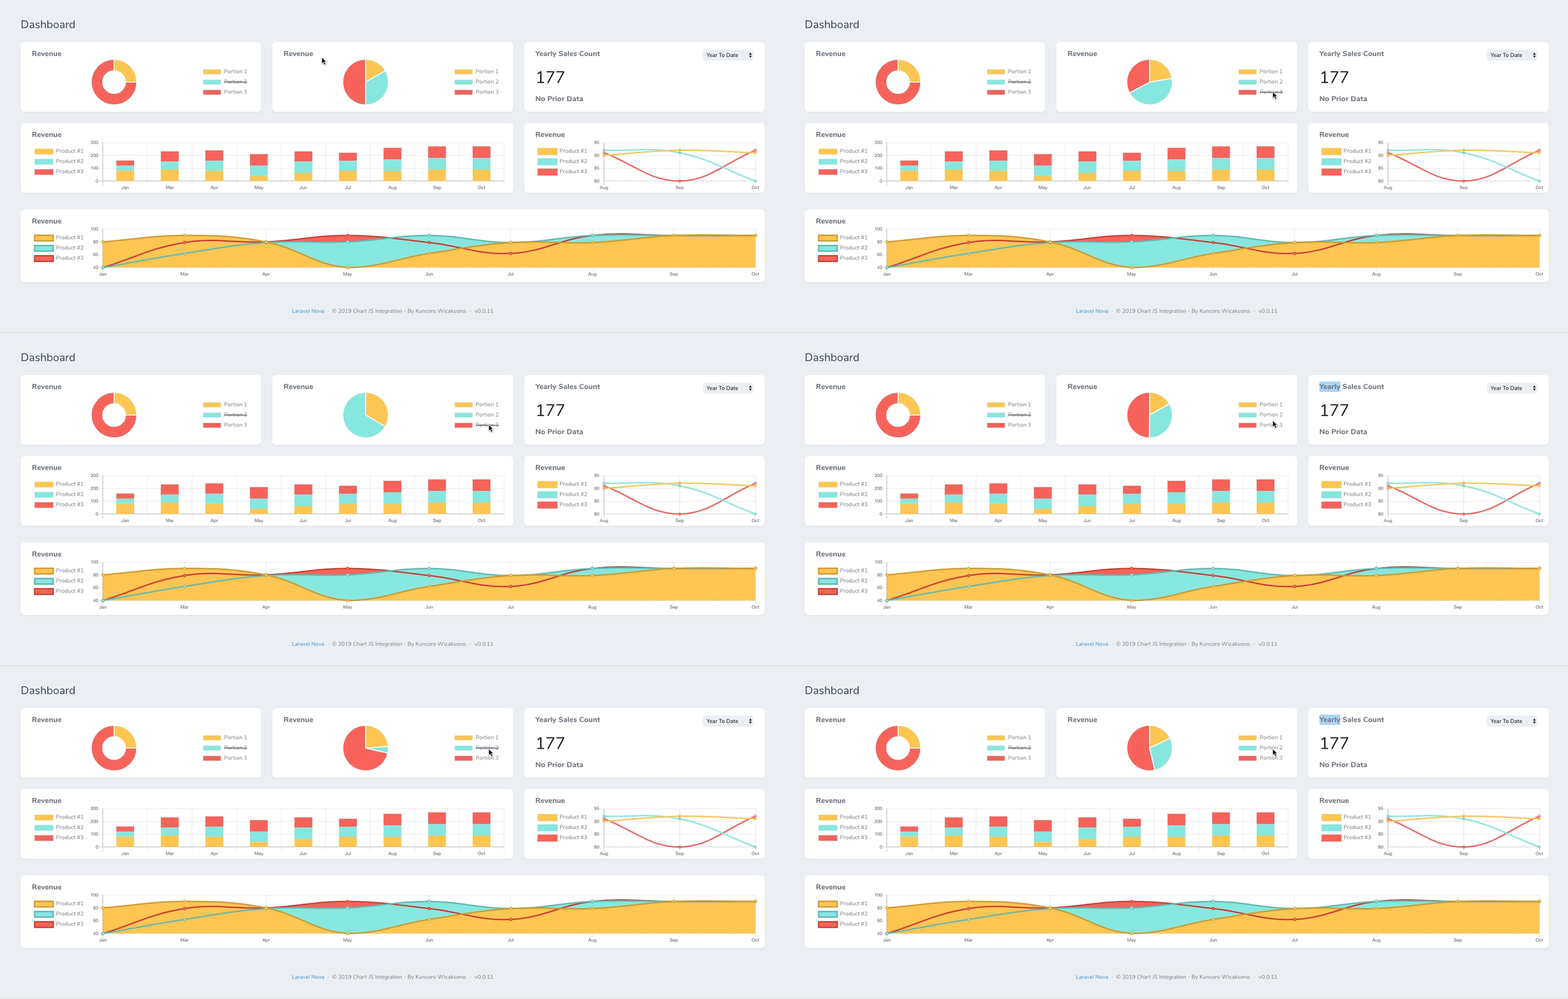
A Simple Dashboard Chart in Laravel Nova using Chart JS

A Simple Dashboard Chart in Laravel Nova using Chart JS. Starting create your own dashboard with Chart JS Integration can save your time and help you maintain consistency across standard elements such as Bar, Stacked, Line, Area, Doughnut and Pie Chart.
🦍• [Work in Progress] React Renderer to build UI interfaces using canvas/WebGL
![🦍• [Work in Progress] React Renderer to build UI interfaces using canvas/WebGL](https://github.com/raphamorim/react-ape/raw/master/assets/demo-ps-vita.jpg)
React Ape React Ape is a react renderer to build UI interfaces using canvas/WebGL. React Ape was built to be an optional React-TV renderer. It's mainl
Simple, responsive, modern SVG Charts with zero dependencies

Frappe Charts GitHub-inspired modern, intuitive and responsive charts with zero dependencies Explore Demos » Edit at CodePen » Contents Installation U
React components for Chart.js, the most popular charting library
react-chartjs-2 React components for Chart.js, the most popular charting library. Supports Chart.js v3 and v2. Quickstart • Docs • Slack • Stack Overf
The friendly, pragmatic and functional ID system
pika Combine Stripe IDs with Snowflake IDs and you get... pika! - the last ID system you'll ever need, combining pragmatism with functionality. Exampl
Timeline/Graph2D is an interactive visualization chart to visualize data in time.

vis-timeline The Timeline/Graph2D is an interactive visualization chart to visualize data in time. The data items can take place on a single date, or
A library for visualization and creative-coding

Pts Pts is a typescript/javascript library for visualization and creative-coding. Get started at ptsjs.org. Please give it a try, file issues, and sen
A JavaScript library dedicated to graph drawing
sigma.js - v1.2.1 Sigma is a JavaScript library dedicated to graph drawing, mainly developed by @jacomyal and @Yomguithereal. Resources The website pr
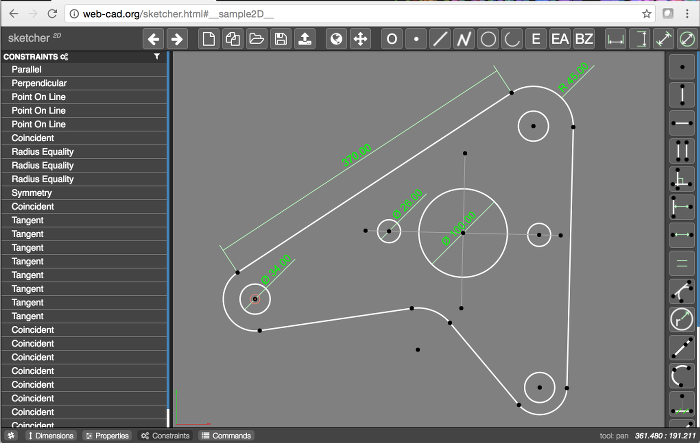
JS.Sketcher is a parametric 2D and 3D CAD modeler written in pure javascript

JS.Sketcher JS.Sketcher is a parametric 2D and 3D CAD modeler written in pure javascript YouTube Tutorial Video Live Sample Demo 2D Sketcher Help Docs
Interactive visualizations of time series using JavaScript and the HTML canvas tag

dygraphs JavaScript charting library The dygraphs JavaScript library produces interactive, zoomable charts of time series: Learn more about it at dygr
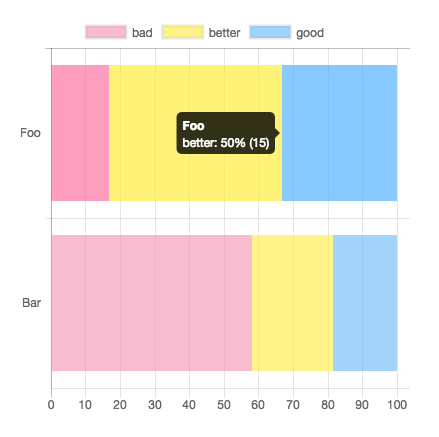
This plugin for Chart.js that makes your bar chart to 100% stacked bar chart.

chartjs-plugin-stacked100 This plugin for Chart.js that makes your bar chart to 100% stacked bar chart. Requires Chart.js 3.x. Demo: https://y-takey.g
Javascript Canvas Library, SVG-to-Canvas (& canvas-to-SVG) Parser

Fabric.js Fabric.js is a framework that makes it easy to work with HTML5 canvas element. It is an interactive object model on top of canvas element. I
Javascript Canvas Library, SVG-to-Canvas (& canvas-to-SVG) Parser

Fabric.js Fabric.js is a framework that makes it easy to work with HTML5 canvas element. It is an interactive object model on top of canvas element. I
JavaScript Vector Library
Raphaël: Cross-browser vector graphics the easy way Visit the library website for more information: http://raphaeljs.com https://dmitrybaranovskiy.git