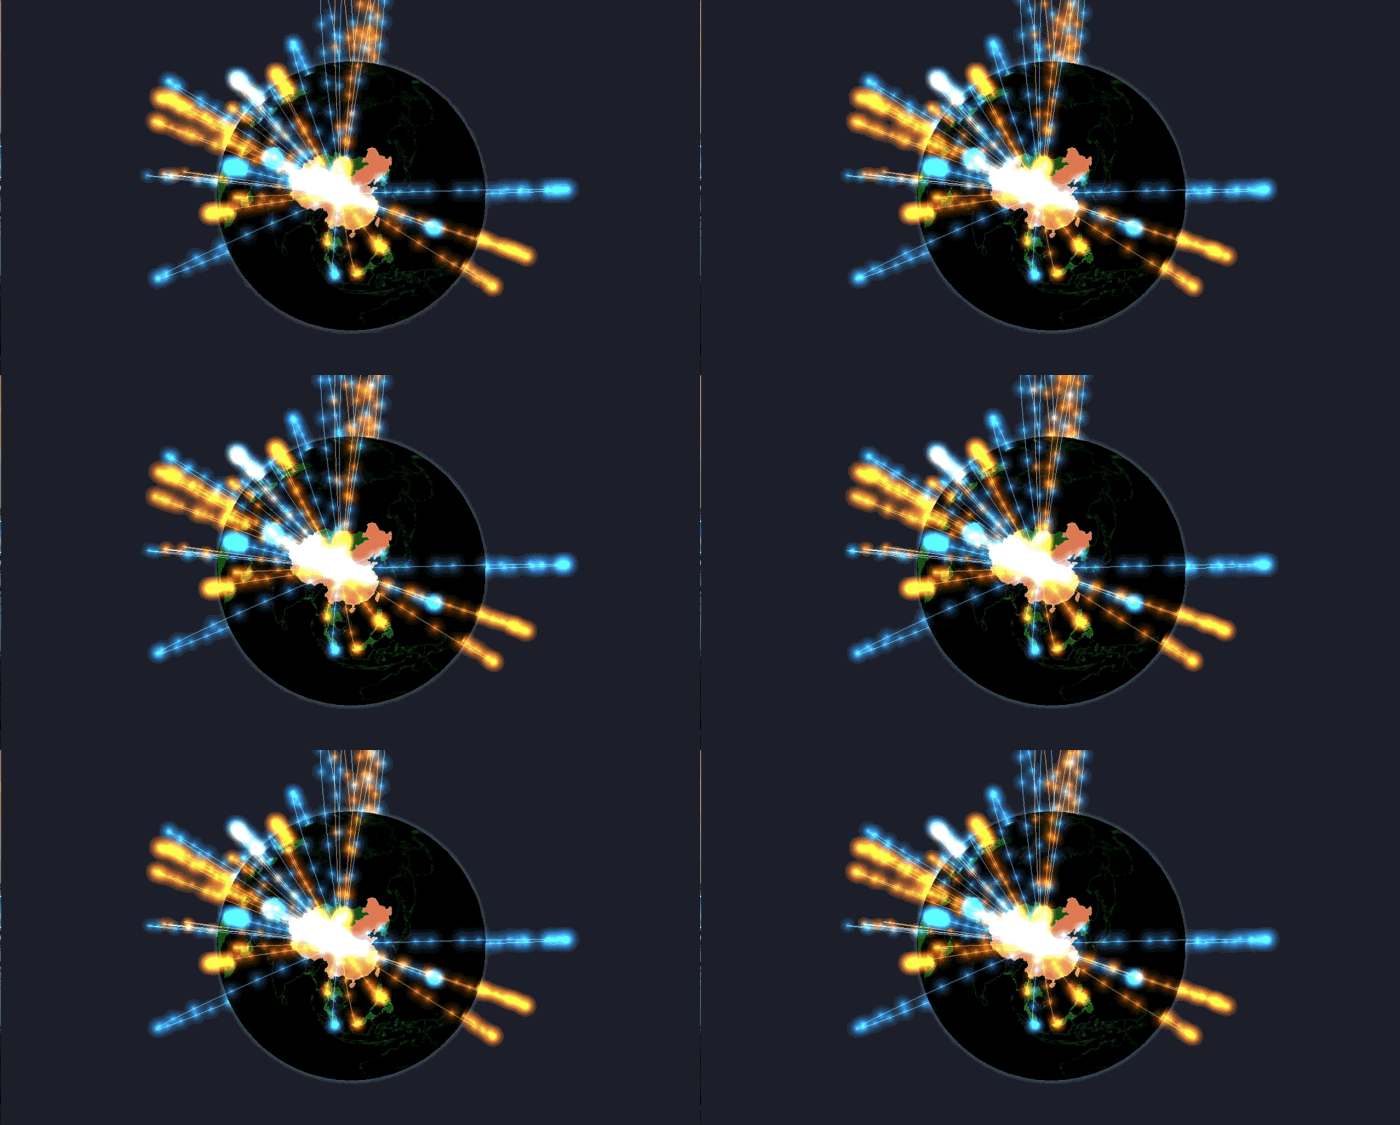
🌏 A Declarative 3D Globe Data Visualization Library built with Three.js

Overview

Gio logo

Gio.js

English | 中文

React Version: react-giojs

Wechat minigame: wechat usage

npm version license badge dependencies badge build coverage

Gio.js is an open source library for web 3D globe data visualization built with Three.js. What makes Gio.js different is that it is simple to use Gio.js to customize a 3D data visualization model in a declarative way, add your own data, and integrate it into your own modern web application.

Table of Content

Motivation

Gio.js is an open source library for web 3D globe data visualization built with Three.js. What makes Gio.js different is that it is simple to use Gio.js to customize a 3D data visualization model in a declarative way, add your own data, and integrate it into your own modern web application.

This library is inspired by the Arms Trade Visualization project developed by Michael Chang and presented during Google Ideas INFO 2012. See original post. With Gio.js, it is easy to reproduce this fantastic data visualization model, and integrate it into web application.

  • Simplicity -- Create a 3D global data visualization model with your own data in just four lines of javascript code
  • Customization -- Design your own globe style with easy to use APIs in Gio.js
  • Modernization -- Build a responsible, fully interactive, rich 3D frontend application using Gio.js

Getting Started

Installation

  • Option 1: <script> tag

Include Three.js dependency:

<script src="three.min.js"></script>

Include local Gio.js library

<script src="gio.min.js"></script>

or through CDN

<script src="https://threejs.org/build/three.min.js"></script>
<script src="https://cdn.jsdelivr.net/npm/[email protected]/build/gio.min.js"></script>
  • Option 2: npm
npm install giojs --save
  • Option 3: yarn
yarn add giojs

Usage

After including "three.min.js" and "gio.min.js" in your html, create a div to render the 3D Gio globe: (the usage of Gio.js is a little bit different in WeChat mini game, checkout this demo to know more about it)

<!DOCTYPE HTML>
<html>
<head>

  <!-- include three.min.js library-->
  <script src="three.min.js"></script>

  <!-- include gio.min.js library-->
  <script src="gio.min.js"></script>

</head>
<body>

  <!-- container to draw 3D Gio globe-->
  <div id="globalArea"></div>

</body>
</html>

To initialize and render the 3D Gio globe:

<script>

    // get the container to hold the IO globe
    var container = document.getElementById( "globalArea" );

    // create controller for the IO globe, input the container as the parameter
    var controller = new GIO.Controller( container );

    /**
    * use addData() API to add the the data to the controller
    * know more about data format, check out documentation about data: http://giojs.org/html/docs/dataIntro.html
    * we provide sample data for test, get sample data from: https://github.com/syt123450/giojs/blob/master/examples/data/sampleData.json
    */
    controller.addData( data );

    // call the init() API to show the IO globe in the browser
    controller.init();

</script>

If everything goes well, you shall see this. For more fancier usage of Gio.js, check out Gio.js API document

Click the codepen logo to try it in Codepen:   

Gio.js 2.0 Introduction

After Gio.js 1.0 released, developers propose many cool and constructive advise. Gio.js implements most of these features. Gio.js 2.0 comes with many big features such as:

Examples

Gio.js has many representative demos to show how to work with Gio.js, there are mainly three example resources:

  • Resource 1: Gio.js Playground

There is a Playground ( playground link ) for developers to play with Gio.js and export Gio.js parameter.

  • Resource 2: Github "examples" folder

Gio.js has many API demos, and these demos are gathered in examples folder. clone the Gio.js repo, try them in your own environment ~

  • Resource 3: Live demos on Codepen

Gio.js has a Codepen collection which contains many live demos about Gio.js, click the codepen logo and try to edit them!

API List

➡ configure(json)

Configure the controller.

➡ setInitCountry(ISOCode, default: 'CN')

Set the country initially selected.

➡ lightenMentioned(boolean, default: 'false')

Makes the mentioned country brighter than those not mentioned in the input dataset.

➡ disableUnmentioned(boolean, default: 'false')

Disables an unmentioned country and makes it unselectable.

➡ showInOnly(boolean, default: 'false')

Displays only the line with data flowing into the selected country.

➡ showOutOnly(boolean, default: 'false')

Displays only the line with data flowing out of the selected country.

➡ addHalo(string)

Enables the halo around the earth. When enabling halo, the color of halo also can be specified.

➡ removeHalo()

Disables the halo around the earth.

➡ enableStats()

Displays stats on the upper-left corner of the scene.

➡ disableStats()

Hides stats on the upper-left corner of the scene.

➡ setTransparentBackground()

Make default background transparent.

➡ setAutoRotation()

Make globe rotate automatically.

➡ setStyle(string)

Sets the color scheme of the 3D globe by name.

➡ setSurfaceColor(string, default: '#ffffff')

Sets the color of the surface the 3D globe.

➡ setSelectedColor(string, default: '#ffffff')

Sets color of the country in selected state.

➡ setExportColor(string, default: '#DD380C')

Sets the color of out line.

➡ setImportColor(string, default: '#154492')

Sets the color of in line.

➡ setHaloColor(string, default: '#ffffff')

Sets the color of the Halo.

➡ setBackgroundColor(string, default: '#000000')

Sets the color of the background.

➡ adjustOceanBrightness(float, default: 0.5)

Sets the brightness of the ocean.

➡ adjustRelatedBrightness(float, default: 0.5)

Sets the brightness of the related country.

➡ adjustMentionedBrightness(float, default: 0.5)

Sets the brightness of the mentioned country.

➡ addData(json)

Loads data to the controller of Gio and overrides previous data synchronously.

➡ clearData()

Clear data in the globe, and remove spline system and moving particle.

➡ switchDataSet()

switch data set when a data group is added.

➡ addDataAsync(url, callback)

Loads data to the controller of Gio and overrides previous data asynchronously.

➡ liveLoad(url, callback, duration)

Loads data to the controller periodically.

➡ closeLiveLoader()

Close live load function.

➡ getScene()

Get the reference of three.js scene object.

➡ getStatsObject()

Get the reference of Stats.js panel object.

➡ onCountryPicked(callback)

Fired when selected country changes.

➡ switchCountry(IsoCode)

Change currently selected country.

Documentation

  • For quick start, checkout Getting Started
  • To learn more about the Basic Elements
  • To see the full API document in Markdown format, checkout APIs
  • To contribute to Gio.js's code base, read Developer Guide
  • Checkout Gio's official website giojs.org for everything above and plus lots of live examples

Contributors

Thanks goes to these wonderful people (emoji key):


syt123450

đŸ’ģ 📖 💡 ⚠ī¸

Botime

đŸ’ģ 📖 ⚠ī¸ 🚇

Mutian Wang

đŸ’ģ đŸ“Ļ 🎨 👀

Chenhua Zhu

đŸ’ģ 🚇 🤔 👀

Qi(Nora)

đŸ’ģ 🎨 📖 ✅

bouyuc

📖 ✅

Xiaoran Lin

đŸ’ģ 🎨 💡 👀

Leon

đŸ’ģ 🎨 💡

Alexis

đŸ’ģ 🐛

This project follows the all-contributors specification. Contributions of any kind welcome!

License

Apache-2.0

Comments
  • Missing countries

    Missing countries

    Hi!

    When i tried to connect it with youtube stats, I had some issues with countrycode. I notice some missing countries from your singleton object :

    • RE : REUNION ( https://countrycode.org/reunion )
    • HK : HONG KONG ( https://countrycode.org/hongkong )
    • GP : GUADELOUPE ( https://laendercode.net/fr/country/gp )
    • ZZ : UNKNOWN ( https://stackoverflow.com/questions/20973960/i-am-getting-zz-as-country-code-when-using-pytz )

    I only found it for now but I will post update if there are more of them.

    Thanks for the lib anyway !

    enhancement 
    opened by AlexisAnzieu 10
  • Please Update the Source Code

    Please Update the Source Code

    As the title, I download the source code on the github and I try to use the api of auto rotation,but I find I cannot do that. So I compare the gio.min.js of the live demo on the https://giojs.org/examples/32_auto_rotation.html with the gio.min.js I download--of course they are different.

    opened by HovardHe 5
  • Improve website performance

    Improve website performance

    I noticed that the website is having a long latency on page loading (e.g. Document page), which is caused by some huge size images (e.g. A 1.5MB image just for 500 * 300 actual display size) and the arrangement of resource tags, etc.

    In general, now that the demo is done, performance is the next step.

    Cheers!

    enhancement refactoring 
    opened by manymeeting 4
  • Control the Continents on the Globe Surface

    Control the Continents on the Globe Surface

    As gio.js can switch between different countries, Gio.js 2.0 would support continents control, so the developers could configure the continent in Json format.

    new-features 
    opened by syt123450 3
  • Should be able to update surface brightness without calling update()

    Should be able to update surface brightness without calling update()

    Currently, brightness won't be updated immediately after calling controller.adjustOceanBrightness, controller.adjustMentionedBrightness, or controller.adjustRelatedBrightness

    bug enhancement 
    opened by manymeeting 3
  • Rotate globe on web

    Rotate globe on web

    Tried to use controller.setAutoRotation(...) but got an error in my console saying that the function doesn't exist. Are there any changes to the original rotation API when moving from v1.x to v2.x?

    I'd really like a rotation function to add to the globe. Any help appreciated :)

    Thank you!

    opened by rish-16 2
  • Utils.flattenCountryData() no need to sort and need to check for

    Utils.flattenCountryData() no need to sort and need to check for "undefined"

                var replica = JSON.parse( JSON.stringify( data ) );
    
                replica.sort( function ( a, b ) {
    
                    return a[ valueKey ] - b[ valueKey ];
    
                } );
    
                var min = replica[ 0 ][ valueKey ];
                var max = replica[ replica.length - 1 ][ valueKey ];
    

    In the code snippet above, sort() is used to get min/max, which lead to time complexity of O(N*log N). Instead, using a for loop for achieve the same goal for time of O(N):

                if (data === undefined || data.length === 0) 
                    return;
    
                var min = data[0][ valueKey ];
                var max = data[0][ valueKey ];
    
                data.forEach(function(country) {
                    if (country[ valueKey ] < min) 
                        min = country[ valueKey ];
                    else if (country[ valueKey ] > max) 
                        max = country[ valueKey ];
                });
    
    refactoring 
    opened by BoTime 2
  • Expose surface brightness ranges to GIO.Controller

    Expose surface brightness ranges to GIO.Controller

    Currently the ranges are defined as private variables in SurfaceHandler, it makes some user cases difficult since there's no way to get those ranges via GIO.Controller

    enhancement help wanted 
    opened by manymeeting 2
  • Error on Setup

    Error on Setup

    Hi! I did the basic setup that is instructed on the website, no added code, and I keep getting this error i'm unable to fix:

    error1 error2

    If anyone knows how I can fix this, I would really appreciate your help, or even if anyone knows excatly what this is (i never used three.js so I have no clue) and can explain please.

    Thank you

    opened by MadalenaSousa 1
  • Cannot use v2 functions (i.e. Transparent Background)

    Cannot use v2 functions (i.e. Transparent Background)

    Greentings,

    I am trying to render a globe on my page with the demo data, and trying to set the background to transparent and auto rotation to true. None of the functions described in v2 are working.

    Uncaught TypeError: globe_container.setTransparentBackground is not a function
        at (index):86:21
    

    I am using Gio v2.2.1:

    <script src="https://cdn.jsdelivr.net/npm/[email protected]/build/gio.min.js"></script>

    What am I doing wrong?

    opened by nertilzhuri 0
  • Cannot read property 'center' of undefined

    Cannot read property 'center' of undefined

    When I load in some data I constructed (gist), I get an error.

    gio.min.js:2 Uncaught TypeError: Cannot read property 'center' of undefined
        at C (gio.min.js:2)
        at gio.min.js:2
        at Object.v [as createGeometry] (gio.min.js:2)
        at P.processDetail (gio.min.js:4)
        at P.a.process (gio.min.js:4)
        at q.a.process (gio.min.js:4)
        at D.a.process (gio.min.js:4)
        at V.a.process (gio.min.js:4)
        at l.a.process (gio.min.js:4)
        at o (gio.min.js:2)
    

    My strong suspicion is that one or more of the Alpha2 codes I passed in is unrecognized. But this error message doesn't tell me which one.

    Does anyone happen to know what this error message tends to mean in giojs?

    opened by elsehow 1
  • Error on `npm start`

    Error on `npm start`

    After npm install, when I run npm start, I see

    > babel-node ./src/countryInfo/test.js
    
    internal/modules/cjs/loader.js:969
      throw err;
      ^
    
    Error: Cannot find module '[home]/giojs/src/countryInfo/test.js'
    

    It seems that ./src/countryInfo/test.js is not in the repository, but npm start's script points to it.

    opened by elsehow 0
  • Expose CountryData

    Expose CountryData

    It'd be great if the CountryData was exposed to the created objected. As currently there is functions as getConfig(), there should be a similar function e.g. "getCountries". This will help make the application less prone to issues related to unknown/unidentified countries.

    Either this: Or add handlers for unknown countries as currently the application will crash when providing an unknown country code.

    opened by Fabbok1x 0
Releases(v2.2.2)
Owner
syt123450
Interested in data visualization, happy hacking ~
syt123450
Apache Superset is a Data Visualization and Data Exploration Platform

Superset A modern, enterprise-ready business intelligence web application. Why Superset? | Supported Databases | Installation and Configuration | Rele

The Apache Software Foundation 49.9k Dec 31, 2022
DataSphereStudio is a one stop data application development& management portal, covering scenarios including data exchange, desensitization/cleansing, analysis/mining, quality measurement, visualization, and task scheduling.

English | 中文 Introduction DataSphere Studio (DSS for short) is WeDataSphere, a big data platform of WeBank, a self-developed one-stop data application

WeBankFinTech 2.4k Jan 2, 2023
Beautiful React SVG maps with d3-geo and topojson using a declarative api.

react-simple-maps Create beautiful SVG maps in react with d3-geo and topojson using a declarative api. Read the docs, or check out the examples. Why R

z creative labs 2.7k Dec 29, 2022
:bar_chart: Declarative Charting Framework for Angular

ngx-charts Declarative Charting Framework for Angular! ngx-charts is unique because we don't merely wrap d3, nor any other chart engine for that matte

Swimlane 4.2k Dec 27, 2022
Apache ECharts is a powerful, interactive charting and data visualization library for browser

Apache ECharts Apache ECharts is a free, powerful charting and visualization library offering an easy way of adding intuitive, interactive, and highly

The Apache Software Foundation 53.8k Jan 9, 2023
Data visualization library for depicting quantities as animated liquid blobs

liquidity.js A data visualization library for depicting quantities as animated liquid blobs. For a demonstration of what the final product can look li

N Halloran 91 Sep 20, 2022
Powerful data visualization library based on G2 and React.

BizCharts New charting and visualization library has been released: http://bizcharts.net/products/bizCharts. More details about BizCharts Features Rea

Alibaba 6k Jan 3, 2023
📊 Data visualization library for React based on D3

Data visualization library for React based on D3js REAVIZ is a modular chart component library that leverages React natively for rendering the compone

REAVIZ 740 Dec 31, 2022
Apache ECharts is a powerful, interactive charting and data visualization library for browser

Apache ECharts Apache ECharts is a free, powerful charting and visualization library offering an easy way of adding intuitive, interactive, and highly

The Apache Software Foundation 53.8k Jan 5, 2023
An open-source visualization library specialized for authoring charts that facilitate data storytelling with a high-level action-driven grammar.

Narrative Chart Introduction Narrative Chart is an open-source visualization library specialized for authoring charts that facilitate data storytellin

Narrative Chart 45 Nov 2, 2022
Data Visualization Components

react-vis | Demos | Docs A COMPOSABLE VISUALIZATION SYSTEM Overview A collection of react components to render common data visualization charts, such

Uber Open Source 8.4k Jan 2, 2023
📊 A highly interactive data-driven visualization grammar for statistical charts.

English | įŽ€äŊ“中文 G2 A highly interactive data-driven visualization grammar for statistical charts. Website â€ĸ Tutorial Docs â€ĸ Blog â€ĸ G2Plot G2 is a visua

AntV team 11.5k Dec 30, 2022
🍞📊 Beautiful chart for data visualization.

?? ?? Spread your data on TOAST UI Chart. TOAST UI Chart is Beautiful Statistical Data Visualization library. ?? Packages The functionality of TOAST U

NHN 5.2k Jan 2, 2023
A data visualization framework combining React & D3

Semiotic is a data visualization framework combining React & D3 Interactive Documentation API Docs on the wiki Examples Installation npm i semiotic E

nteract 2.3k Dec 29, 2022
Location Intelligence & Data Visualization tool

What is CARTO? CARTO is an open, powerful, and intuitive platform for discovering and predicting the key insights underlying the location data in our

CARTO 2.6k Dec 31, 2022
🍞📊 Beautiful chart for data visualization.

?? ?? Spread your data on TOAST UI Chart. TOAST UI Chart is Beautiful Statistical Data Visualization library. ?? Packages The functionality of TOAST U

NHN 5.2k Jan 6, 2023
Timeline/Graph2D is an interactive visualization chart to visualize data in time.

vis-timeline The Timeline/Graph2D is an interactive visualization chart to visualize data in time. The data items can take place on a single date, or

vis.js 1.2k Jan 3, 2023
Open source CSS framework for data visualization.

Charts.css Charts.css is an open source CSS framework for data visualization. Visualization help end-users understand data. Charts.css help frontend d

null 5.7k Jan 4, 2023
Cubism.js: A JavaScript library for time series visualization.

Cubism.js Cubism.js is a D3 plugin for visualizing time series. Use Cubism to construct better realtime dashboards, pulling data from Graphite, Cube a

Square 4.9k Jan 3, 2023