28 Repositories
JavaScript collaboration-diagram Libraries
A shared, encrypted cloud storage using Nostr.
nostr-storage A shared, encrypted cloud data store using Nostr. Installation This package is designed to work in both the browser and nodejs. !-- Bro
⚡️ 풀 리퀘스트를 쿠버네티스에 배포하여 머지하기 전에 테스트 해볼 수 있도록 만들어주는 GitHub Action

PR preview deploy k8s (GitHub Action) ⚡️ 풀 리퀘스트를 쿠버네티스에 배포하여 머지하기 전에 테스트 해볼 수 있도록 만들어주는 GitHub Action 입니다. 최대한 단순하게 구현을 하려고 노력하였습니다. 만약, 더 나은 방법을 알고 계
A transpiler from golang's type to typescript's type for collaboration between frontend & backend.

go2type go2type.vercel.app (backup site) A typescript transpiler that convert golang's type to typescript's type. Help front-end developer to work fas
nice-dag is a lightweight javascript library, which is used to present a DAG diagram.

Nice-DAG Overview Nice-DAG is a lightweight javascript library, which is used to present a DAG diagram. Essentially, it uses dagre to layout nodes and
Incredible drastically simplifies creation of developer video content. It offers a unified workflow to storyboard, record, collaborate and produce the video.
👋 Introduction Incredible drastically simplifies creation of developer video content. It offers a unified workflow to storyboard, record, collaborate
A JavaScript library for visualizing Sankey diagrams.
SanKEY.js v1.0.0 last updated: 20.07.2022 Getting started SanKEY.js is a JavaScript data visualization library that provides a simple object-oriented
A framework for building collaborative Microsoft Teams and M365 experiences.
Live Share SDK The Live Share SDK is in preview. You will need to be part of the Developer Preview Program for Microsoft Teams to use this feature. Th
A CLI tool to embed interactive PUML diagrams to your github markdown files.
puml-for-markdown Simple CLI Usage Just run puml-for-markdown in any directory where you have markdown files and it will render links to PlantUML file
Plugin that lets you create diagrams from textual representation (aka 'Diagrams as Code') within Logseq

Logseq - Diagrams as Code Plugin that lets you create diagrams (and other visualizations) from textual representation (aka 'Diagrams as Code') within
a/A MERN stack collaboration project

Welcome to Hoppers! Hoppers is an app where users can design their plan for the perfect night out with friends1. Users will be able to design and cust
How to build a multiplayer Wordle clone with Liveblocks, Vue, and Vite
Wordle Wars This repo shows how to build a multiplayer Wordle clone with Liveblocks, Vue, and Vite. Try it out It's forked from VVowrdle created by Ev
CryptPad - a collaboration suite that is end-to-end-encrypted and open-source

CryptPad CryptPad is a collaboration suite that is end-to-end-encrypted and open-source. It is built to enable collaboration, synchronizing changes to
Pintora is an extensible javascript text-to-diagrams library that works in both browser and Node.js.
Pintora Documentation | Live Editor Pintora is an extensible javascript text-to-diagrams library that works in both browser and Node.js. Expressing yo
Tsailun - open source online document and collaboration

Open source selfhosted web-based wiki/doc/knowledge management and collaboration
Crowdsource and crowdfund collaboration on maps of problems.
Getting Started with Create React App This project was bootstrapped with Create React App. Available Scripts In the project directory, you can run: np
A react component helps bring Figma's Cursor Chat to your web applications in less than 3 minutes, making real-time collaboration anywhere

@yomo/react-cursor-chat 🧬 Introduction A react component helps bring Figma's Cursor Chat to your web applications in less than 3 minutes, making real
The open source embeddable online markdown editor (component).
Editor.md Editor.md : The open source embeddable online markdown editor (component), based on CodeMirror & jQuery & Marked. Features Support Standard
Chart.js Venn and Euler Diagrams
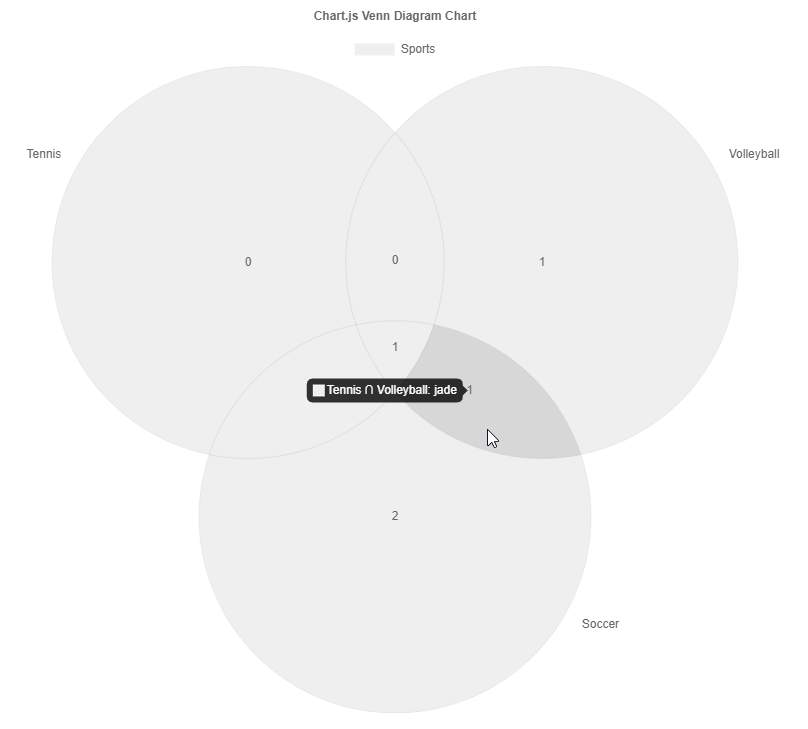
Chart.js Venn and Euler Diagram Chart Chart.js module for charting venn diagrams with up to five sets. Adding new chart type: venn and euler. Related
📊 Vue.js wrapper for Chart.js

vue-chartjs vue-chartjs is a wrapper for Chart.js in vue. You can easily create reuseable chart components. Demo & Docs 📺 Demo 📖 Docs Compatibility
Diagram-maker - A library to display an interactive editor for any graph-like data.

Diagram Maker Diagram Maker is a library to display an interactive editor for any graph-like data. Following is a screenshot from one of the consumers
The culmination of Encode Academy, the 8-week long Solidity course by Encode Club in collaboration with Extropy
Encode Academy | DAO: Real Estate & Renting What is this? This is the culmination of Encode Academy, the 8-week long Solidity course by Encode Club in
A map tool with real-time collaboration 🗺️
Mapus Maps with real-time collaboration 🗺️ Mapus is a tool to explore and annotate collaboratively on a map. You can draw, add markers, lines, areas,
Tutorial created in collaboration with Enyel Sequeira, taught by JavaScript Mastery.
Travel Advisor Live Site Introduction Build and Deploy an advanced Travel Companion Application using Google Maps. With Geolocation, Google Maps API,
meetapp Free Adobe Connect Alternatives

meetapp meetapp is free adobe connect alternatives for visual classrooms , online meetings, screen share, webinars , video and audio conferencing. Fea
Build modular projects with components in harmony.
Bit Bit is a tool for composing modern applications of independent components. It extends the benefits of micro-services to everything you build, fron
📊 Data visualization library for React based on D3
Data visualization library for React based on D3js REAVIZ is a modular chart component library that leverages React natively for rendering the compone
a super simple, no-nonsense diagramming library written in react that just works
Introduction DEMO: http://projectstorm.cloud/react-diagrams DOCS (wip) https://projectstorm.gitbook.io/react-diagrams Docs are currently being worked
JavaScript diagramming library for interactive flowcharts, org charts, design tools, planning tools, visual languages.
GoJS, a JavaScript Library for HTML Diagrams GoJS is a JavaScript and TypeScript library for creating and manipulating diagrams, charts, and graphs. S