JQuery plugin for creating charts

Overview

JQuery Linechart

NPM Version Download Month Download Total

alt text

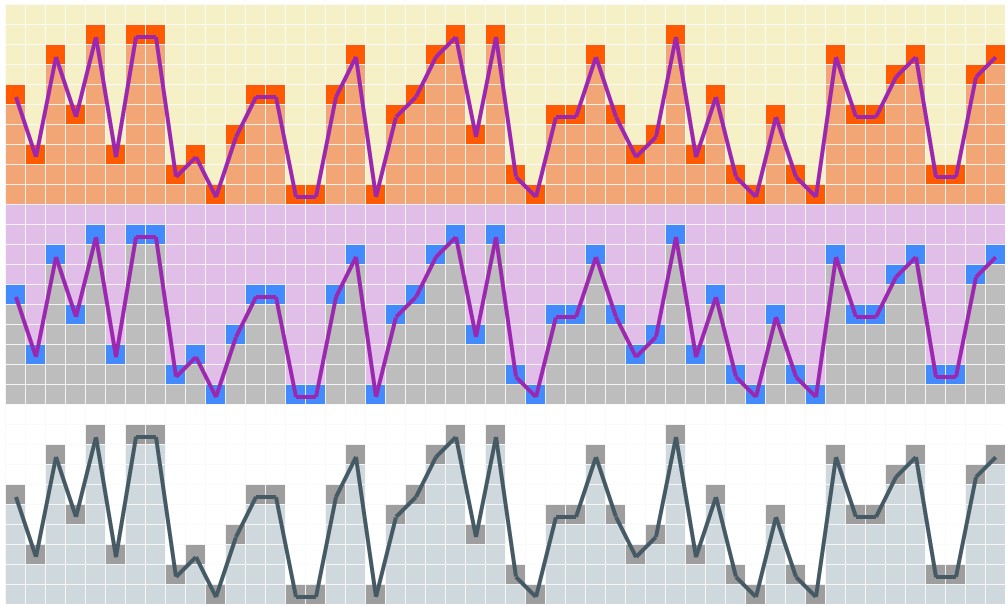
JQuery plugin for building a linechart. Chart ruler completely on HTML/CSS/JS. Bar chart, calendar view visualisation. Diagram, graph, pyramid visualisation of large datasets. Showreel. The source for this module is in the main repo. Please create issues and pull requests. Angular plugin for linechart also exists. Check angular-scale if you're using Angular.js.

alt text

Inspired by kinopoisk.ru chart written using Adobe Flash. But this chart is just on HTML/CSS without using libraries. Feel free for contribute.

alt text

Install

bower install jquery-linechart 
npm install jquery-linechart

Use

<!DOCTYPE html>
<html>
	<head>
		<meta charset="utf-8">
		<link rel="stylesheet" type="text/css" href="../scale.css">
	</head>
	<body>
		<div id="chart"></div>

		<script src="http://code.jquery.com/jquery-3.1.1.min.js" integrity="sha256-hVVnYaiADRTO2PzUGmuLJr8BLUSjGIZsDYGmIJLv2b8=" crossorigin="anonymous"></script>
		<script src="../scale.js"></script>
	</body>
</html>
$.getJSON('./votes.json', function(res) {
	var items = [];

	$.each(res, function(key, val){
		items.push({
			value: val["rank"],
			title: val["title"]
		});
	});

	$("#chart").linechart({
		data: items,
		width: 50, 
		height: 10,
		boxSize: 16,
		line: true,
		theme: "purple"
	});
});

Options

$("#chart").linechart({
	data: items,
	width: 50, 
	height: 10,
	boxSize: 16,
	line: true,
	theme: "purple"
});
  • data is an array of objects [{value: 0}, ... , {value: 10}]. This is the dataset of the chart.
  • width is the horizontal length of the data array. If width param is less than the length of the data array then user will see the last values of the data array.
  • height is the vertical length.
  • box-size is size of each box in pixels.

alt text

  • line is param that determines if this is a line-chart.

alt text

  • theme is color scheme of the chart.

alt text

Please check the example folder to see how it's going on practice.

Themes

  • default
  • purple
  • grey

alt text

License

Copyright (c) 2016 Kirill Stepkin

npm

You might also like...

JavaScript diagramming library for interactive flowcharts, org charts, design tools, planning tools, visual languages.

JavaScript diagramming library for interactive flowcharts, org charts, design tools, planning tools, visual languages.

GoJS, a JavaScript Library for HTML Diagrams GoJS is a JavaScript and TypeScript library for creating and manipulating diagrams, charts, and graphs. S

Dec 30, 2022

Progressive svg pie, donut, bar and line charts

Peity Peity (sounds like deity) is a jQuery plugin that converts an element's content into a mini svg pie, donut, line or bar chart. Basic Usage HTM

Jan 1, 2023

Charts for Raphaël

g.Raphaël - Official charting plugin for Raphaël For more information, see: http://g.raphaeljs.com/ Changelog v0.51 Fixed issues with piechart related

Dec 31, 2022

Awesome charts for AngularJS.

Awesome charts for AngularJS.

n3-line-chart v2 n3-line-chart is an easy-to-use JavaScript library for creating beautiful charts in AngularJS applications and it is built on top of

Dec 7, 2022

Create beautiful charts with one line of JavaScript

Chartkick.js Create beautiful charts with one line of JavaScript See it in action Supports Chart.js, Google Charts, and Highcharts Also available for

Jan 2, 2023

Ember Charts 3.5 2.3 L2 JavaScript A powerful and easy to use charting library for Ember.js

Ember Charts A charting library built with the Ember.js and d3.js frameworks. It includes time series, bar, pie, and scatter charts which are easy to

Dec 7, 2022

A friendly reusable charts DSL for D3

D4 D4 is a friendly charting DSL for D3. The goal of D4 is to allow developers to quickly build data-driven charts with little knowledge of the intern

Dec 5, 2022

Financial lightweight charts built with HTML5 canvas

Lightweight Charts Demos | Documentation | Discord community TradingView Lightweight Charts are one of the smallest and fastest financial HTML5 charts

Jan 9, 2023

Create beautiful JavaScript charts with one line of React

React Chartkick Create beautiful JavaScript charts with one line of React See it in action Supports Chart.js, Google Charts, and Highcharts Quick Star

Dec 28, 2022
Releases(1.0.2)
Smoothie Charts: smooooooth JavaScript charts for realtime streaming data

Smoothie Charts is a really small charting library designed for live streaming data. I built it to reduce the headaches I was getting from watching ch

Joe Walnes 2.2k Dec 13, 2022
Reusable JavaScript library for creating sketchy/hand-drawn styled charts in the browser.

roughViz.js is a reusable JavaScript library for creating sketchy/hand-drawn styled charts in the browser, based on D3v5, roughjs, and handy. Why? Use

Jared Wilber 6.4k Jan 4, 2023
Chart.js module for creating treemap charts

chartjs-chart-treemap Chart.js v3.6.0 module for creating treemap charts. Implementation for Chart.js v2 is in 2.x branch Documentation You can find d

Jukka Kurkela 99 Dec 18, 2022
A plugin for the jQuery javascript library to generate small sparkline charts directly in the browser

jQuery Sparklines This jQuery plugin makes it easy to generate a number of different types of sparklines directly in the browser, using online a line

Gareth Watts 1.2k Jan 4, 2023
Attractive JavaScript charts for jQuery

flot About flot is a JavaScript plotting library for engineering and scientific applications derived from Flot: http://www.flotcharts.org/ Take a look

Flot 5.9k Dec 22, 2022
Chart.js plugin to create charts with a hand-drawn, sketchy, appearance

chartjs-plugin-rough Chart.js plugin to create charts with a hand-drawn, sketchy, appearance Version 0.2 requires Chart.js 2.7.0 or later, and Rough.j

Akihiko Kusanagi 73 Dec 1, 2022
Simple HTML5 Charts using the tag

Simple yet flexible JavaScript charting for designers & developers Documentation Currently, there are two versions of the library (2.9.4 and 3.x.x). V

Chart.js 59.4k Jan 7, 2023
Simple responsive charts

Big welcome by the Chartist Guy Checkout the documentation site at http://gionkunz.github.io/chartist-js/ Checkout this lightning talk that gives you

Gion Kunz 26 Dec 30, 2022
Simple, responsive, modern SVG Charts with zero dependencies

Frappe Charts GitHub-inspired modern, intuitive and responsive charts with zero dependencies Explore Demos » Edit at CodePen » Contents Installation U

Frappe 14.6k Jan 4, 2023
📊 A highly interactive data-driven visualization grammar for statistical charts.

English | 简体中文 G2 A highly interactive data-driven visualization grammar for statistical charts. Website • Tutorial Docs • Blog • G2Plot G2 is a visua

AntV team 11.5k Dec 30, 2022