Financial lightweight charts built with HTML5 canvas

Overview

Lightweight Charts

CircleCI npm version npm bundle size Dependencies count Downloads

Demos | Documentation | Discord community

TradingView Lightweight Charts are one of the smallest and fastest financial HTML5 charts.

The Lightweight Charting Library is the best choice for you if you want to display financial data as an interactive chart on your web page without affecting your web page loading speed and performance.

It is the best choice for you if you want to replace static image charts with interactive ones. The size of the library is close to static images but if you have dozens of image charts on a web page then using this library can make the size of your web page smaller.

Installing

es6 via npm

npm install lightweight-charts
import { createChart } from 'lightweight-charts';

const chart = createChart(document.body, { width: 400, height: 300 });
const lineSeries = chart.addLineSeries();
lineSeries.setData([
    { time: '2019-04-11', value: 80.01 },
    { time: '2019-04-12', value: 96.63 },
    { time: '2019-04-13', value: 76.64 },
    { time: '2019-04-14', value: 81.89 },
    { time: '2019-04-15', value: 74.43 },
    { time: '2019-04-16', value: 80.01 },
    { time: '2019-04-17', value: 96.63 },
    { time: '2019-04-18', value: 76.64 },
    { time: '2019-04-19', value: 81.89 },
    { time: '2019-04-20', value: 74.43 },
]);

CDN

You can use unpkg:

https://unpkg.com/lightweight-charts/dist/lightweight-charts.standalone.production.js

The standalone version creates window.LightweightCharts object with all exports from esm version:

const chart = LightweightCharts.createChart(document.body, { width: 400, height: 300 });
const lineSeries = chart.addLineSeries();
lineSeries.setData([
    { time: '2019-04-11', value: 80.01 },
    { time: '2019-04-12', value: 96.63 },
    { time: '2019-04-13', value: 76.64 },
    { time: '2019-04-14', value: 81.89 },
    { time: '2019-04-15', value: 74.43 },
    { time: '2019-04-16', value: 80.01 },
    { time: '2019-04-17', value: 96.63 },
    { time: '2019-04-18', value: 76.64 },
    { time: '2019-04-19', value: 81.89 },
    { time: '2019-04-20', value: 74.43 },
]);

Development

See BUILDING.md for instructions on how to build lightweight-charts from source.

License

Licensed under the Apache License, Version 2.0 (the "License"); you may not use this software except in compliance with the License. You may obtain a copy of the License at LICENSE file. Unless required by applicable law or agreed to in writing, software distributed under the License is distributed on an "AS IS" BASIS, WITHOUT WARRANTIES OR CONDITIONS OF ANY KIND, either express or implied. See the License for the specific language governing permissions and limitations under the License.

This software incorporates several parts of tslib (https://github.com/Microsoft/tslib, (c) Microsoft Corporation) that are covered by the Apache License, Version 2.0.

This license requires specifying TradingView as the product creator. You shall add the "attribution notice" from the NOTICE file and a link to https://www.tradingview.com/ to the page of your website or mobile application that is available to your users. As thanks for creating this product, we'd be grateful if you add it in a prominent place.

Comments
  • Series-based markers

    Series-based markers

    Hi! Thanks for the great work on this library. I couldn't find in the docs any info on whether it's possible to plot a series of potentially sparse points that would be shown with some icon for each point on the chart, or maybe something like the possibility to add annotations. The use case I'm after is being able to show on the chart specific points in time/price where something happened, such as real world events that might have affected the price, etc. I'm not yet very familiar with the codebase of the library, but it seems to me that the simplest way to implement something like this would be to support a kind of "scatter series" that would allow you to specify an icon (image or char?) to plot each point with, which could coexist with a normal candlestick series for example, and could show a popover with details about that specific point (potentially arbitrary text) when hovered by the user. Any way to do something like this now? If not, would it eventually be added? Thanks again!

    enhancement 
    opened by andresberrios 34
  • Added title option to create price line

    Added title option to create price line

    Type of PR: enhancement

    PR checklist:

    • [x] Addresses an existing issue: fixes #357
    • [x] Includes tests
    • [x] Documentation update

    Overview of change:

    Is there anything you'd like reviewers to focus on?

    opened by christose 31
  • have the time scale automatically scaled to 100% width

    have the time scale automatically scaled to 100% width

    regardless if i have only 10 datapoints or 150, there should be an option that renders all datapoints into the visible chart area.

    currently we need to hope that we have correct amount of data points for the last 24 hours and then play with timeScale.barSpacing to make it fit to the whole width image image

    it's the same data for both graphs, just different bar spacing. would be awesome to simply ignore whatever settings and just render all datapoints into the full width.

    bug 
    opened by krtschmr 24
  • Custom color for items of candlestick and line series

    Custom color for items of candlestick and line series

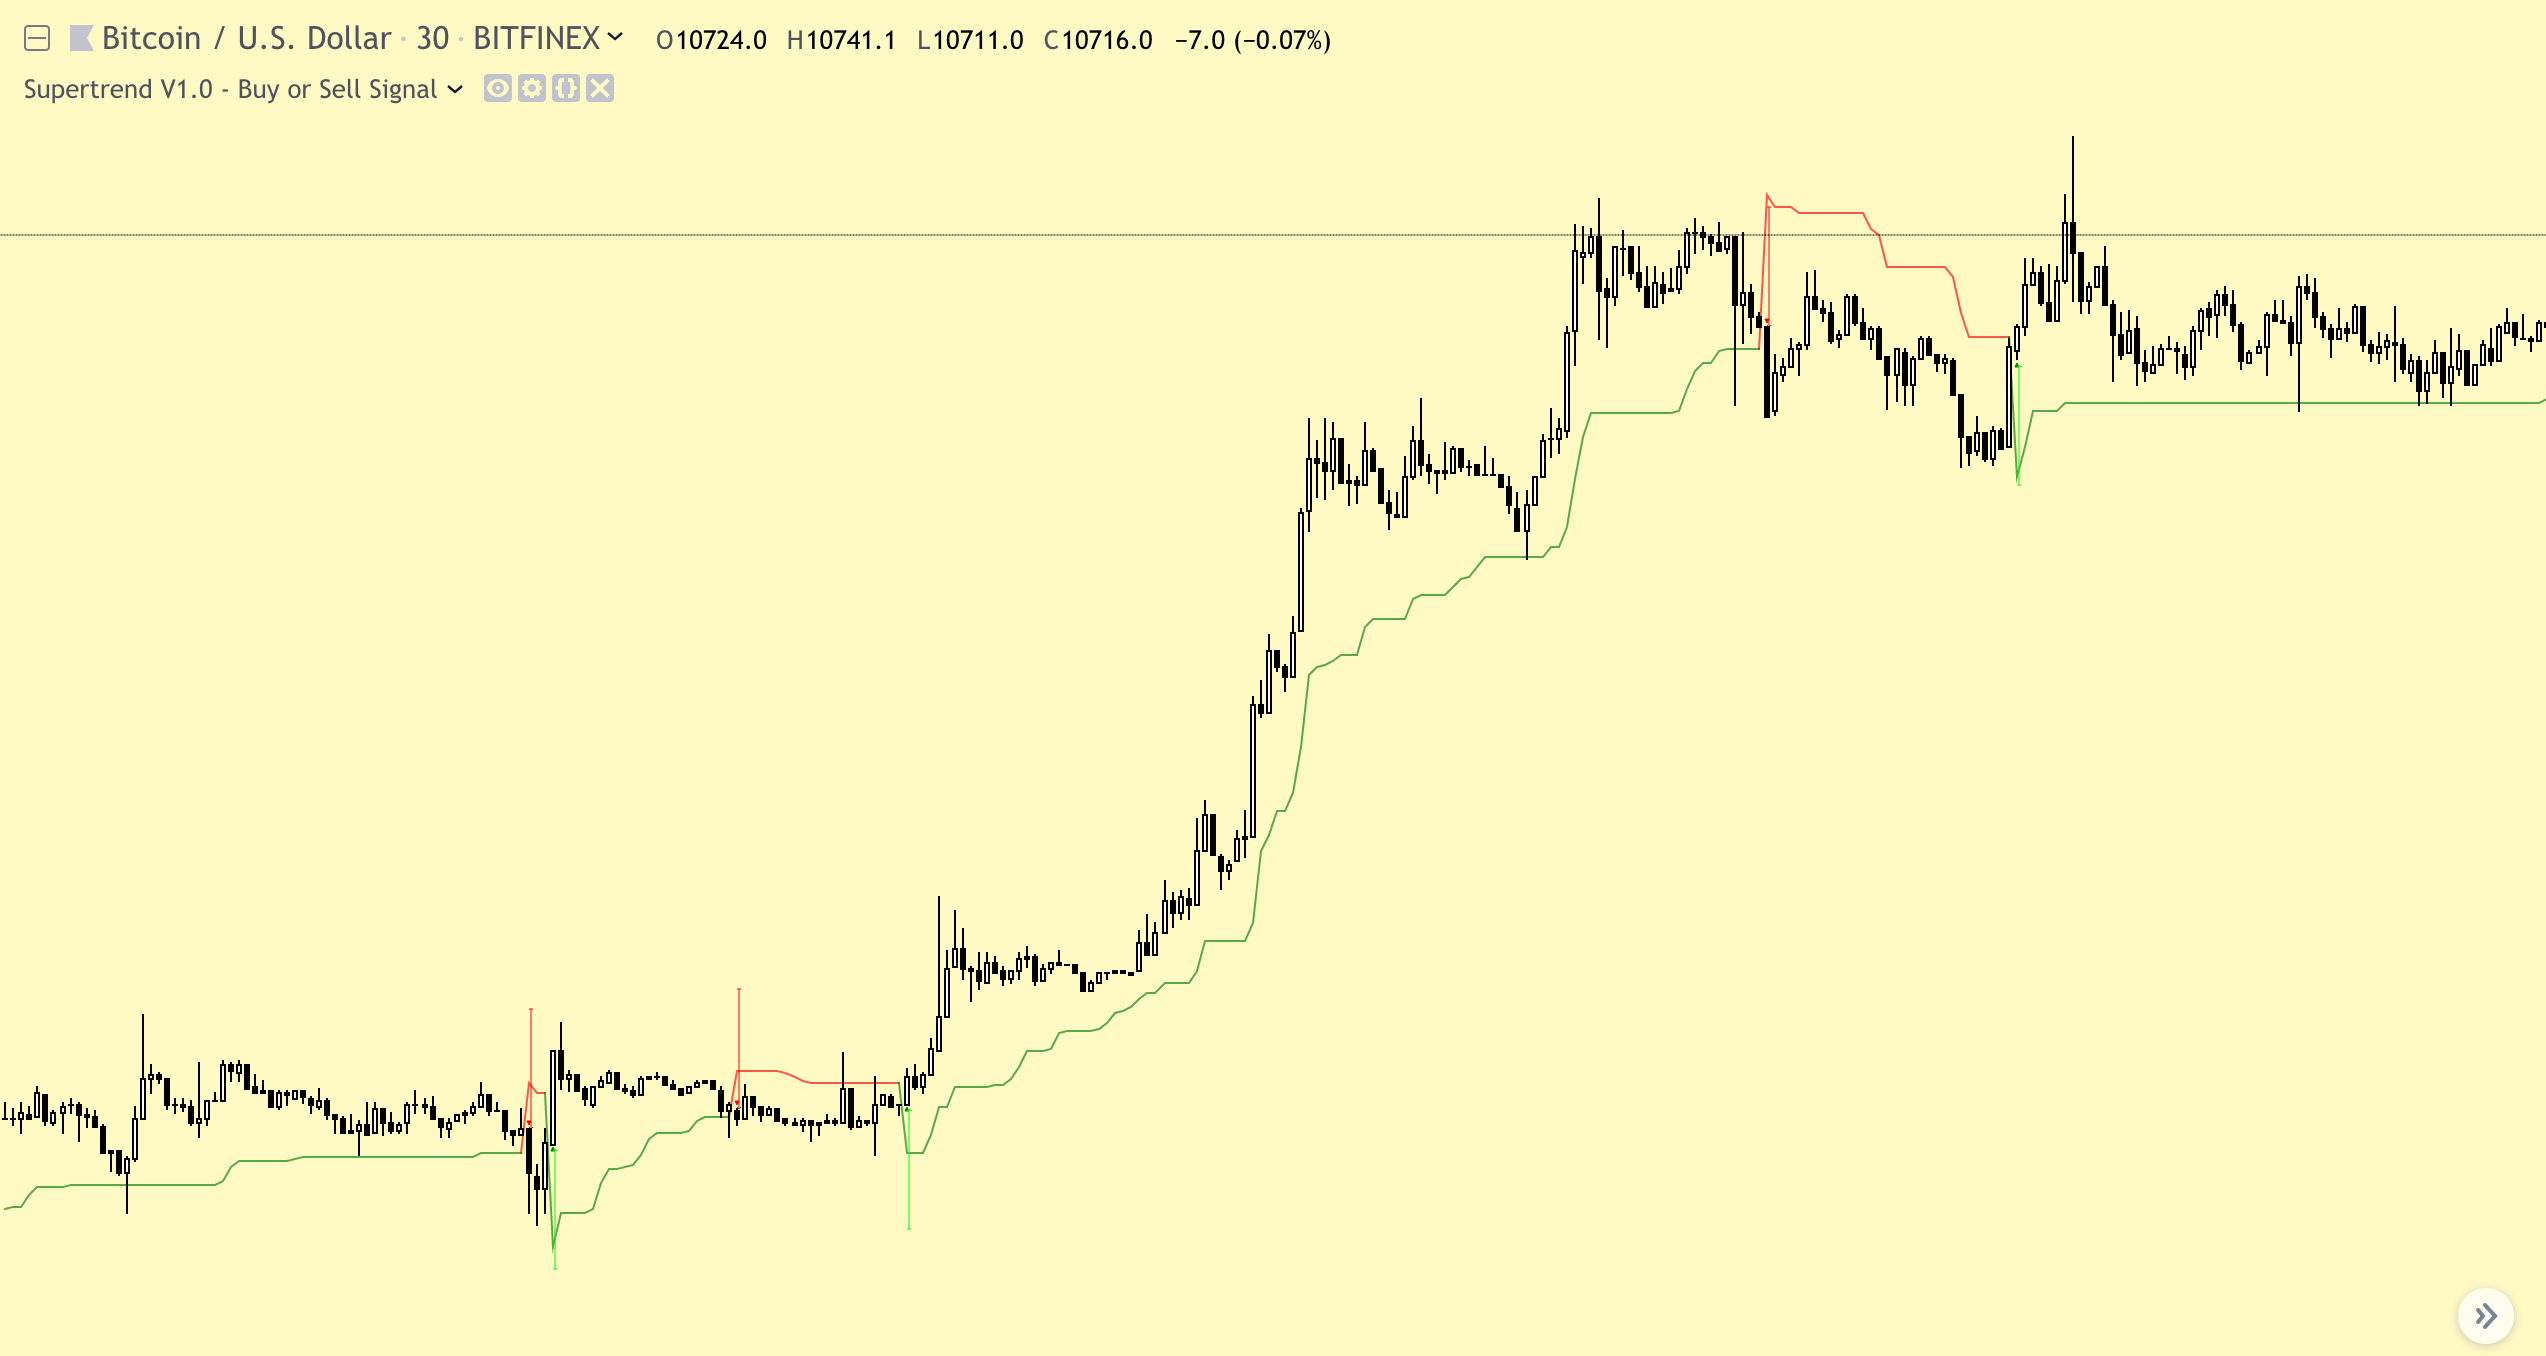
    Hello, a feature to be able change the color of candlesticks and lineSeries based on a condition think of it like the VolumeSeries that are already implemented that accepts a color as a variable but this time for lines and candlesticks. the image below can be a good example of this , the line is the same but in some times the color is red or green based on the condition. Screenshot_2019-09-06 BTCUSD 10716 0 ▲ +1 26% SEP

    enhancement 
    opened by 0x48415a484952 24
  • Time scale marks customization

    Time scale marks customization

    Currently there is no support to customise the time scale with even at least formatting.

    I have two problems:

    • My trade data is now showing random intervals of 12:32 and 13:34 rather than just 12:30 and 13:30
    • There doesn't seem to be a way to localise the timescale and convert unix timestamp to local times

    Any chance we can get this soon?

    enhancement 
    opened by deantheiceman 20
  • How to set the time zone of the X axis

    How to set the time zone of the X axis

    https://jsfiddle.net/TradingView/bmL0vont/

    image

    How can I set the time zone of the X axis? My local is the +8 time zone, but it shows the time in the 0 time zone.

    time: 1556877600 Should show 2019/05/03 18:00:00

    opened by liubin595338764 20
  • Run

    Run "sh -c npm run install-hooks" error, exit code 1

    Lightweight Charts Version:

    Steps/code to reproduce:

    Execute npm install after download

    Actual behavior:

    npm ERR! A complete log of this run can be found in: npm ERR! /Users/zk/.npminstall_tarball/_logs/2020-09-02T07_06_19_652Z-debug.log ✖ Install fail! Error: post install error, please remove node_modules before retry! Run "sh -c npm run install-hooks" error, exit code 1 Error: post install error, please remove node_modules before retry! Run "sh -c npm run install-hooks" error, exit code 1 at ChildProcess.proc.on.code (/usr/local/lib/node_modules/cnpm/node_modules/runscript/index.js:74:21) at ChildProcess.emit (events.js:198:13) at maybeClose (internal/child_process.js:982:16) at Process.ChildProcess._handle.onexit (internal/child_process.js:259:5)

    Expected behavior:

    Successfully executed and run the project

    opened by zhaokui525 18
  • Displaying annotation with text above lines or candlestick in specific places on button click

    Displaying annotation with text above lines or candlestick in specific places on button click

    Hello please i have tried so hard to come up with annotation in a point using time and value to position it Example when a button is clicked i want eg: $2000 to be fixed at the exact point where the graph is before the button click in a graph

    Let me explain better using Screenshot

    i have tried this with my realtime data and it shows on first initiation and disappear after first load

    i was thinking of using this magic

    $('.play').click(function(){ lineSeries.setMarkers([ { time: CurrentTime(), position: 'aboveBar', color: 'yellow', shape: 'arrowDown', } ]); });

    all my plans failed, i don't know how i could explain this please

    check here for my code example i just need help i have zero knowledge about this whole Library https://codepen.io/highbreedtech/pen/xxGRrYx

    WhatsApp Image 2020-02-18 at 3 22 47 PM WhatsApp Image 2020-02-18 at 3 26 27 PM

    opened by HighBreedTech 18
  • Replaced TimeRange with TimeRangeWithBars in getVisibleRange

    Replaced TimeRange with TimeRangeWithBars in getVisibleRange

    TimeRangeWithBars extends the TimeRange interface to include the amount of bars missing before and after the data set in order to fill the entire chart viewport.

    The idea is to use these fields to determine the amount of data to load dynamically, as the user scrolls and zooms in the chart.

    Type of PR: enhancement

    PR checklist:

    • [x] Addresses an existing issue: adresses #335
    • [ ] Includes tests
    • [x] Documentation update

    Overview of change:

    The pull request addresses the addition of barsBefore/barsAfter fields to getVisibleRange() in time-scale.ts (and also in the handler of visible time range change events) by extending the TimeRange interface to TimeRangeWithBars. This way, an API client can determine how much additional data to load dynamically when the users zoom and pans through the chart.

    The discussion for this functionality (as well as my extended rationale) is in #335

    opened by gkaindl 17
  • Set markers disappear

    Set markers disappear

    Hello! I display the candles for the day. I also display markers in certain candles. But When I move the graph to the left or right the set markers disappear. In addition, markers disappear when you approach the graph.

    Help, please.

    out of scope 
    opened by Altyair 16
  • Histogram (volume) does not honor color setting (sometimes)

    Histogram (volume) does not honor color setting (sometimes)

    Lightweight Charts Version: "lightweight-charts": "1.1.0"

    Steps/code to reproduce: I can't reproduce it easily, please bear with me until I can find a way to consistently reproduce this.

    Context: typical volume histogram at the bottom of chart. There is a button in the UI that allows to switch timeframe. On click of a button, the volume serie (and candles) are changed.

    The code is as follow:

    // this is how the data is formatted for the chart
    // snapshot is an OHLC array from an exchange
    formatDataForChart (snapshot) {
      return snapshot.reduce((acc, _candle) => {
        const candle = Object.assign({}, _candle)
        candle.time = candle.time / 1000
        acc.candles.push(candle)
        acc.volume.push({
          time: candle.time,
          value: candle.volumeQuote,
          color: candle.open > candle.close ? volumeChartCfg.downColor : volumeChartCfg.upColor
        })
        return acc
      }, {volume: [], candles: []})
    }
    
    // method called when user click to change timeframe
    changeInterval (interval) {
      this.chartInterval = interval
      const snapshot = await ... 
      const chartData = this.formatDataForChart(snapshot)
      this.candlestickSeries.setData(chartData.candles)
      this.volumeSeries.setData(chartData.volume)
      this.resetChartTimeScale(chartData)
    }
    

    Actual behavior: This works perfectly most of the time but sometimes, the chart does not use the color provided for the volume. (candles are fine). All bars are colored with one of the two colors provided. It is weird because it works most of the time and the bug(?) seems random.

    Expected behavior: Bars should use the color provided.

    Screenshots

    Chart vs data provided.

    volume_problem

    You can see that the volume colors (array on the right) would match the candles color (which are automatically colored by the chart) but the chart draws them all with the same color.

    bug 
    opened by AoDev 16
  • switch to memlab for memory leak e2e testing

    switch to memlab for memory leak e2e testing

    Type of PR: enhancement

    PR checklist:

    • [ ] Addresses an existing issue: fixes #
    • [x] Includes tests
    • [ ] Documentation update

    Overview of change: Switches the memory leak e2e testing to use memlab.

    Adds additional installation steps to the memleak test on the CI for the required libraries to launch memlab's version of Chrome.

    PR 1234 🎉

    opened by SlicedSilver 1
  • Having issue removing multiple series

    Having issue removing multiple series

    Hello, I'm using a lightweight chart to display several data points in various series. When I want to delete the series for the same time period, however, the system encounters the problem indicated in the below image. nonetheless, it worked flawlessly when I tried to delete the series over a different time period, so could you perhaps assist me to identify the problem I'm having?

    1. First Image of multiple series at the same time Multiple series

    2. Error occurring during removing at same time Error image

    How my code works:-- First, when I simultaneously add a new series to the chart, I'll construct an object with the timestamp value and push it to the array. After my process is finished, I'll eliminate many lines by comparing the amount of time I have left with some of my fundamental reasoning using the chart.removeSeries(chart>) function. Here is the code: —

    socket.on(socketName, (socketData1) => { if (arrSome.length > 0 && typeof arrSome != "undefined") { for (let j = 0; j < arrSome.length; j++) { const element = arrSome[j].chart; const timeToRemove = arrSome[j].time; const unixTime = Math.floor(Date.now() / 1000) + 19080; if (unixTime == timeToRemove) { chart.removeSeries(element); socket.emit("removeInterval"); } } if (arrSome.length > 0) { let newData = arrSome.shift(); console.log("newData", newData, arrSome); } } })

    I am using javascript for my base langauge

    Thanks in advance

    opened by LovePareek 1
  • Passing a freezed dataset causes error

    Passing a freezed dataset causes error "cannot add property w_, object is not extensible"

    Lightweight Charts Version:

    Steps/code to reproduce:

    interface Data {
      time: Time;
      value: number;
    }
    
    const data: Data = [...]
    
    const freezedData = deepFreeze(data);
    
    areaSeries.setDate(freezedData); // Error: cannot add property w_, object is not extensible
    

    Actual behavior:

    areaSeries.setData relies on passing an array of mutable objects.

    Expected behavior:

    If using redux or needing to use a dataset that is immutable I would expect the library to do a deep copy or make it more explicit that the data is mutated.

    Screenshots:

    image

    CodeSandbox/JSFiddle/etc link:

    opened by juansalvatore 0
  • Market time Timezone

    Market time Timezone

    I am trying to get U.S. market times to show on a chart. I have tried both of these solutions: date-solution date-fns-tz-solution

    My chart keeps rendering with a +7 hour time difference. Has anyone experienced this issue?

    image question 
    opened by chrispeterson3 1
  • Ability to adjust default zoom level as used by resetTimeScale()

    Ability to adjust default zoom level as used by resetTimeScale()

    Is your feature request related to a problem? Please describe.

    We are customizing the visible range on page load to the viewport size and device type (desktop/touch). Currently, we are unable to customize the default zoom used by resetTimeScale (when double clicking time scale).

    Describe the solution you'd like

    A new property for TimeScaleOptions: defaultZoom

    question 
    opened by tasteitslight 1
Releases(v3.8.0)
  • v3.8.0(Feb 17, 2022)

    We're happy to announce the next release of Lightweight Charts library. This release includes many improvements and bug fixes (as usual), but we are thrilled to say that from this version the library has its own documentation website that replaces the documentation in the repository. Check it out and share your feedback in this discussion thread.

    Enhancement

    • Documentation website (see #875, #918, #411, #919, #922, #983, #980, #1006)
    • Quick tracking mode (see #830)
    • Improved mouse behaviour on touch devices (like mouse connected to mobile phone/tablet) (see #106)
    • Custom color for items of candlestick and line series (see #195)
    • Labels might be cut off when disabling scale and scroll (#947)
    • Add ability to disable visibility of price line line (see #969)

    Fixed

    • timeScale.fitContent is not working correctly (see #966)
    • Delegate.unsubscribeAll method works in opposite way (see #995)
    • Last price animation is active when no data added to the right (but to the left) (see #886)
    • subscribeClick on mobile always get the last index of all the items (see #657)
    • Incorrect crosshair position on scrolling by dragging by mouse (see #987)
    • A painting slows down after a while with tons of updates (see #946)
    • Bars disappear with devicePixelRatio less than 1 (see #982)
    • There are no tick marks on the price axis (see #939)
    • Disabling scrolling by disabled horzTouchDrag and vertTouchDrag options disables moving crosshair in tracking mode (see #434)
    • Reducing precision doesn't update price scale width (see #550)
    • Chart width is jumping on series change from area to candles (see #943)
    • Log axis is not scaling on small number (see #874)
    • Overlay series title is not rendered when no series use right price scale (see #926)
    • scrollToPosition with big negative value and when no data breaks the chart (see #889)
    • When rendering multiple charts with baseline series, baseValue of the last element is used on all charts series. (see #898)

    Thanks to our contributors:

    • @zaleGZL zale

    See issues assigned to this version's milestone or changes since the last published version.

    Source code(tar.gz)
    Source code(zip)
  • v3.7.0(Nov 8, 2021)

    Enhancement

    • The new baseline series chart (see #151)
    • Documentation about time zones support (see #781)
    • Added methods to get time axis size and subscribe on size change (see #853)
    • Improved performance of setting/updating series data (see #418 and #838)
    • Use lowerbound in TimeScale timeToIndex search (see #767)
    • Add JSDoc comments for existing API docs (see #870)

    Fixed

    • Increased min price tick mark step up to 1e-14 (from 1e-9) (see #841)
    • Fix typo in customization docs (see #844)
    • Do not paint time axis if it not visible (see #865)
    • Remove color customisation from settings.json (see #869)

    Thanks to our contributors:

    • @thanhlmm Thanh Le

    See issues assigned to this version's milestone or changes since the last published version.

    Source code(tar.gz)
    Source code(zip)
  • v3.6.1(Sep 13, 2021)

  • v3.6.0(Sep 10, 2021)

    On this day 10 years ago, 10th September 2011, the very first version of the TradingView website was deployed. To celebrate 10th anniversary we're happy to announce the new version of lightweight-charts library v3.6.0 🎉🎉🎉

    Enhancement

    • Gradient chart background color (see #831)
    • How to add buffer animation to price jump (see #567)
    • Kinetic scroll (see #832)

    Fixed

    • Incorrect initial barSpacing when both fixRightEdge and fixLeftEdge are enabled (see #823)
    • Time axis label get cut on the edge if a fix edge option is enabled (see #835)
    • Price axis doesn't respect the width of crosshair label (see #834)
    • Fixed both timescale edges make lockVisibleTimeRangeOnResize turn wrong (see #814)
    • Error: Value is null error while set the data is container has 0x0 size (see #821)

    Thanks to our contributors:

    • @thanhlmm Thanh Le

    See issues assigned to this version's milestone or changes since the last published version.

    Source code(tar.gz)
    Source code(zip)
  • v3.5.0(Aug 4, 2021)

    A note about rendering order of series, which might be interpret as a bug or breaking change since this release

    This is not really a breaking change, but might be interpret like that. In #794 we've fixed the wrong order of series, thus now all series will be displayed in opposite order (they will be displayed in order of creating now; previously they were displayed in reversed order).

    To fix that, just change the order of creating the series (thus instead of create series A, then series B create series B first and then series A) - see #812.

    Fixed

    • Screenshot output missing piece on bottom right (see #798)
    • Overlapped line chart show wrong color order when hover (see #794)
    • Price line label show on both axis (see #795)

    Thanks to our contributors:

    • @thanhlmm Thanh Le

    See issues assigned to this version's milestone or changes since the last published version.

    Source code(tar.gz)
    Source code(zip)
  • v3.4.0(Jul 20, 2021)

    Enhancement

    • Add option to fix right edge (see #218)
    • Drop restriction for min bar spacing value (see #558)
    • Round corners of the line-style plots (see #731)

    Fixed

    • AutoscaleProvider documentation error (see #773)
    • Candlestick upColor and downColor is not changed on applyOptions (see #750)
    • Cleared and reset data appears at visually different location (see #757)
    • Remove unused internal method from SeriesApi (see #768)
    • Removing data for the last series doesn't actually remove the data (see #752)
    • to date of getVisibleRange contains partially visible data item and it's impossible to hover it (see #624)
    • series.priceFormatter().format(price) does not work (see #790)

    See issues assigned to this version's milestone or changes since the last published version.

    Source code(tar.gz)
    Source code(zip)
  • v3.3.0(Jul 20, 2021)

    Enhancement

    • Add type predicates for series type (see #670)
    • Create Grid instance for every pane (see #382)
    • Add possibility to chose crosshairMarker color, so it will be independent from line-series color (see #310)
    • Implement option not to shift the time scale at all when data is added with setData (see #584)

    Fixed

    • Incorrect bar height when its value is more than chart's height (see #673)
    • Disabling autoScale for non-visible series (see #687)

    Thanks to our contributors:

    • @dubroff
    • @SuperPenguin Andree Yosua
    • @mecm1993 Manuel Cepeda

    See issues assigned to this version's milestone or changes since the last published version.

    Source code(tar.gz)
    Source code(zip)
  • v3.2.0(Nov 13, 2020)

    Enhancement

    • Feat/gzip friendly colors (see #598)
    • Add coordinateToLogical and logicalToCoordinate (see #587)
    • Add API to show/hide series without removing it (see #471)
    • Add run-time validation of inputs in debug mode (see #315)
    • Pixel perfect renderers fixes (see #535)
    • Add title option to createPriceLine (see #357)

    Fixed

    • Set rightOffset and scrollToPosition async as well as setVisibleRange (see #406)
    • timeScale() changes visible range on setData() (see #549)
    • Remove chart's size restriction or make it smaller (see #366)
    • LineStyle.Dotted make no effect (see #572)
    • If priceScaleId is empty string, invalid price scale api is returned (see #537)
    • Incorrect Selection seen on long press in ios webview on chart (see #609)
    • One-point line series is invisible (see #597)
    • Empty price scale after creating series with the same price range (see #615)

    Infra and dev env

    • Compress artifacts in graphics tests in CI (see #145)
    • Run tests against production build (see #503)
    • Add test to check code usage coverage (see #495)
    • Migrate from codechecks (see #356)
    • Updated dev deps

    Thanks to our contributors:

    • Andree Yosua @SuperPenguin
    • Christos @christose
    • Shergin Rodion @beholderrk
    • wenhoujx @wenhoujx

    See issues assigned to this version's milestone or changes since the last published version.

    Source code(tar.gz)
    Source code(zip)
  • v3.1.5(Jul 29, 2020)

  • v3.1.3(Jul 20, 2020)

  • v3.1.2(Jul 6, 2020)

  • v3.1.1(Jun 30, 2020)

  • v3.1.0(Jun 29, 2020)

    Enhancement

    • Whitespaces support (see #209)
    • Custom font families for watermarks (see #437)

    Fixed

    • Added support for 'transparent' color (see #491)
    • Refactor DataLayer/ChartApi (see #270)
    • Remove series then scroll to right after not working (see #355)
    • Scaling via mouse click and drag doesn't work if chart is inside shadow root (see #427)
    • Applying watermark in setTimeout doesn't make an effect (see #485)
    • Importing the library in server-side context caused ReferenceError (see #446)

    Undocumented breaking changes

    We know that some of users probably used some hacky-workarounds calling internal methods to achieve multi-pane support. In this release, to reduce size of the bundle we dropped out a code for pane's separator (which allows to resize panes).

    As soon this workaround is undocumented and we don't support this feature yet - we don't bump a major version. But we think it's better to let you know that it has been changed.

    Development

    • Dropped support NodeJS < 12.18
    • Migrated from TSLint to ESLint (see #314)
    • Migrated from clean-publish to in-house script to clear package.json (see #474)

    Thanks to our contributors:

    • Meet Mangukiya @meetmangukiya
    • NekitCorp @NekitCorp

    See issues assigned to this version's milestone or changes since the last published version.

    Source code(tar.gz)
    Source code(zip)
  • v3.0.1(Jun 15, 2020)

  • v3.0.0(Jun 11, 2020)

    Breaking changes

    We have some breaking changes since the latest version due some features and API improvements:

    • Methods subscribeVisibleTimeRangeChange and unsubscribeVisibleTimeRangeChange has been moved from ChartApi to TimeScaleApi
    • Since 3.0 you can specify price axis you'd like to place the series on. The same for moving the series between price scales (see migration guide below)

    See breaking changes doc with migration guide to migrate smoothly.

    Enhancement

    • Added ability to customize time scale tick marks formatter (see #226)
    • Added ability to put text for series markers (see #207)
    • Added ability to specify your own date formatter (see #368)
    • Improved tick marks generation algorithm for the first point (see #387)
    • Made inbound types weakly (outbound ones should be strict) (see #374)
    • Removed non-exported const enum's JS code (see #432)
    • Introduced ts-transformer-properties-rename instead of ts-transformer-minify-privates (see #436)

    Added

    • Add ability to override series' autoscale range (see #392)
    • Add API to get price scale's width (see #452)
    • Disabling/enabling scaling axis for both price and time (see #440)
    • Get screen coordinate by a time point (see #435)
    • Remove tick mark from price label (see #378)
    • Support the second price axis (see #129)
    • Visible time range should have bars count of the space from left/right (see #335)

    Fixed

    • series.setMarkers requires at least one data point (see #372)
    • Impossible to override the only width or height in constructor (see #353)
    • Incorrect alignment of markers if series has gaps (see #464)
    • Multiple series: error while trying to scroll the chart (see #373)
    • Replace const enums with enums to let use them in projects with enabled isolatedModules option (see #375)

    Thanks to our contributors:

    • Ben Guidarelli @barnjamin
    • gkaindl @gkaindl
    • scrwdrv @scrwdrv
    • Yusuf Sahin HAMZA @yusufsahinhamza

    See issues assigned to this version's milestone or changes since the last published version.

    Source code(tar.gz)
    Source code(zip)
  • v2.0.0(Feb 25, 2020)

    Breaking changes

    • Removed unused lineWidth property from HistogramStyleOptions interface (it affects nothing, but could break your compilation)
    • Changed order of width and height args in resize method (#157)
    • Pattern for all non-solid (dotted, dashed, large dashed and sparse dotted) line styles was a bit changed (#274)

    Enhancement

    • Pixel-perfect rendering (#274)
    • Time scale enhancements (#352)

    Added

    • Disable all kinds of scrolls and touch with one option (#230)
    • Added to the acceptable date formats (#296)
    • Add option to show the "global" last value of the series instead of the last visible (#203)

    Fixed

    • Price line didn`t hightlight price (#273)
    • CreatePriceLine not removed (#285)
    • Crosshair line not visible when priceScale position set to none (#302)
    • chart.resize parameter is inverted (#157)
    • Removed unnecessary spacing from left/right (1 bar from each side) in fitContent (#345)

    Thanks to our contributors:

    • Andree Yosua @SuperPenguin
    • kpaape @kpaape
    • Matt Conway @RetWolf

    See issues assigned to this version’s milestone or changes since the last published version.

    Source code(tar.gz)
    Source code(zip)
  • v1.2.2(Feb 21, 2020)

  • v1.2.1(Nov 27, 2019)

    Added

    • Add custom price lines (#183)
    • Migrate canvas-related logic to fancy-canvas library (#141)
    • Add coordinateToPrice method to ISeriesApi (#171)

    Fixed

    • Scrolling by price is incorrect (#213)
    • Histogram (volume) does not honor color setting (sometimes) (#233)
    • Logarithmic scaling is applied to volume (#227)
    • hoveredSeries in mouse events params is always undefined (#190)
    • lineType option does not work for area/line series (#220)
    • Double clicking on time scale will reset fix left edge (#224)
    • Series' marker does not aligned after autoscale (#212)
    • Error on setData empty array for overlay histogram series (#267)
    • Added some missing docs (#211 #193 #245)

    See issues assigned to this version’s milestone or changes since the last published version.

    Source code(tar.gz)
    Source code(zip)
  • v1.1.0(Aug 30, 2019)

    Added

    • Apply localization to specific series (#62)
    • Series-based markers (#24)
    • Reduced size of the library by using ts-transformer-minify-privates transformer (#98)

    Fixed

    • The chart can't start from the left (#144)
    • OHLC charts render incorrect when value is provided (#165)
    • Price axis is not shown if series is created inside promise chain (#164)
    • The line chart can't move to the left (#143)
    • Lots of non-passive event listener warnings (#139)
    • applyOptions of histogram series with color doesn't affect the data (#112)
    • Price Axis Scaling Bug (#122)
    • LineSeries is not displayed if starting x value is out of viewport (#116)
    • Crosshair isn't updated when timescale is changed (#120)
    • Pinch isn't prevented by long tap (#95)

    Thanks to our contributors:

    • zach @n8tb1t
    • Chris Kaczor @krzkaczor

    See issues assigned to this version’s milestone or changes since the last published version.

    Source code(tar.gz)
    Source code(zip)
  • v1.0.2(Jul 19, 2019)

  • v1.0.1(Jul 10, 2019)

  • v1.0.0(Jul 8, 2019)

Simple HTML5 Charts using the tag

Simple yet flexible JavaScript charting for designers & developers Documentation Currently, there are two versions of the library (2.9.4 and 3.x.x). V

Chart.js 59.4k Jan 7, 2023
Javascript Canvas Library, SVG-to-Canvas (& canvas-to-SVG) Parser

Fabric.js Fabric.js is a framework that makes it easy to work with HTML5 canvas element. It is an interactive object model on top of canvas element. I

Fabric.js 23.6k Jan 3, 2023
Javascript Canvas Library, SVG-to-Canvas (& canvas-to-SVG) Parser

Fabric.js Fabric.js is a framework that makes it easy to work with HTML5 canvas element. It is an interactive object model on top of canvas element. I

Fabric.js 23.6k Jan 3, 2023
Konva.js is an HTML5 Canvas JavaScript framework that extends the 2d context by enabling canvas interactivity for desktop and mobile applications.

Konva Konva is an HTML5 Canvas JavaScript framework that enables high performance animations, transitions, node nesting, layering, filtering, caching,

konva 8.7k Jan 8, 2023
Smoothie Charts: smooooooth JavaScript charts for realtime streaming data

Smoothie Charts is a really small charting library designed for live streaming data. I built it to reduce the headaches I was getting from watching ch

Joe Walnes 2.2k Dec 13, 2022
Chart.js module for charting financial securities

Chart.js Financial Charting Chart.js module for Candlestick and OHLC charts Roadmap Chart.js 2.7.0 added our timeseries scale as new option called dis

Chart.js 630 Dec 29, 2022
React + Canvas = Love. JavaScript library for drawing complex canvas graphics using React.

React Konva React Konva is a JavaScript library for drawing complex canvas graphics using React. It provides declarative and reactive bindings to the

konva 4.9k Jan 9, 2023
Canvas rendering library, Sprite manipulation of canvas

el-canvas Canvas rendering library, Sprite manipulation of canvas hello world <div id="app"><div></div></div> yarn add elem-canvas or npm i

null 15 Apr 13, 2022
The Swiss Army Knife of Vector Graphics Scripting – Scriptographer ported to JavaScript and the browser, using HTML5 Canvas. Created by @lehni & @puckey

Paper.js - The Swiss Army Knife of Vector Graphics Scripting If you want to work with Paper.js, simply download the latest "stable" version from http:

Paper.js 13.5k Dec 30, 2022
🔥 JavaScript Library for HTML5 canvas based heatmaps

heatmap.js Dynamic Heatmaps for the Web. How to get started The fastest way to get started is to install heatmap.js with bower. Just run the following

Patrick Wied 5.9k Jan 2, 2023
An HTML5/Canvas implementation of 8-bit color cycling

Overview Here is the JavaScript and C++ source code to my color cycling engine, written in 2010. I am releasing it under the LGPL v3.0. The package co

Joseph Huckaby 8 Dec 1, 2022
An implementation of Bézier curve rendering and manipulation, using the HTML5 Canvas API.

Bézier Curves An implementation of Bézier curve rendering and manipulation, using the HTML5 Canvas API. How does it work? Bézier curves can be simply

nethe550 1 Apr 13, 2022
📸 Generate image using HTML5 canvas and SVG

egami → image README | 中文文档 Generate image using HTML5 canvas and SVG Fork from html-to-image Installation pnpm pnpm add egami npm npm i egami Usage i

weng 12 Jan 3, 2023
Lightweight, interactive planning tool that visualizes a series of tasks using an HTML canvas

Planner Lightweight, interactive planning tool that visualizes a series of tasks using an HTML canvas. Try it yourself at plannerjs.dev Plans created

Brian Vaughn 512 Jan 2, 2023
📊 Interactive JavaScript Charts built on SVG

A modern JavaScript charting library to build interactive charts and visualizations with simple API. Our Partner ApexCharts is now a partner of Fusion

ApexCharts 12.1k Jan 3, 2023
Simple responsive charts

Big welcome by the Chartist Guy Checkout the documentation site at http://gionkunz.github.io/chartist-js/ Checkout this lightning talk that gives you

Gion Kunz 26 Dec 30, 2022
Simple, responsive, modern SVG Charts with zero dependencies

Frappe Charts GitHub-inspired modern, intuitive and responsive charts with zero dependencies Explore Demos » Edit at CodePen » Contents Installation U

Frappe 14.6k Jan 4, 2023
📊 A highly interactive data-driven visualization grammar for statistical charts.

English | 简体中文 G2 A highly interactive data-driven visualization grammar for statistical charts. Website • Tutorial Docs • Blog • G2Plot G2 is a visua

AntV team 11.5k Dec 30, 2022
JavaScript diagramming library for interactive flowcharts, org charts, design tools, planning tools, visual languages.

GoJS, a JavaScript Library for HTML Diagrams GoJS is a JavaScript and TypeScript library for creating and manipulating diagrams, charts, and graphs. S

Northwoods Software Corporation 6.6k Dec 30, 2022