SandDance - Visually explore, understand, and present your data.

Overview

SandDance

Visually explore, understand, and present your data.

sanddance-animation

By using easy-to-understand views, SandDance helps you find insights about your data, which in turn help you tell stories supported by data, build cases based on evidence, test hypotheses, dig deeper into surface explanations, support decisions for purchases, or relate data into a wider, real world context.

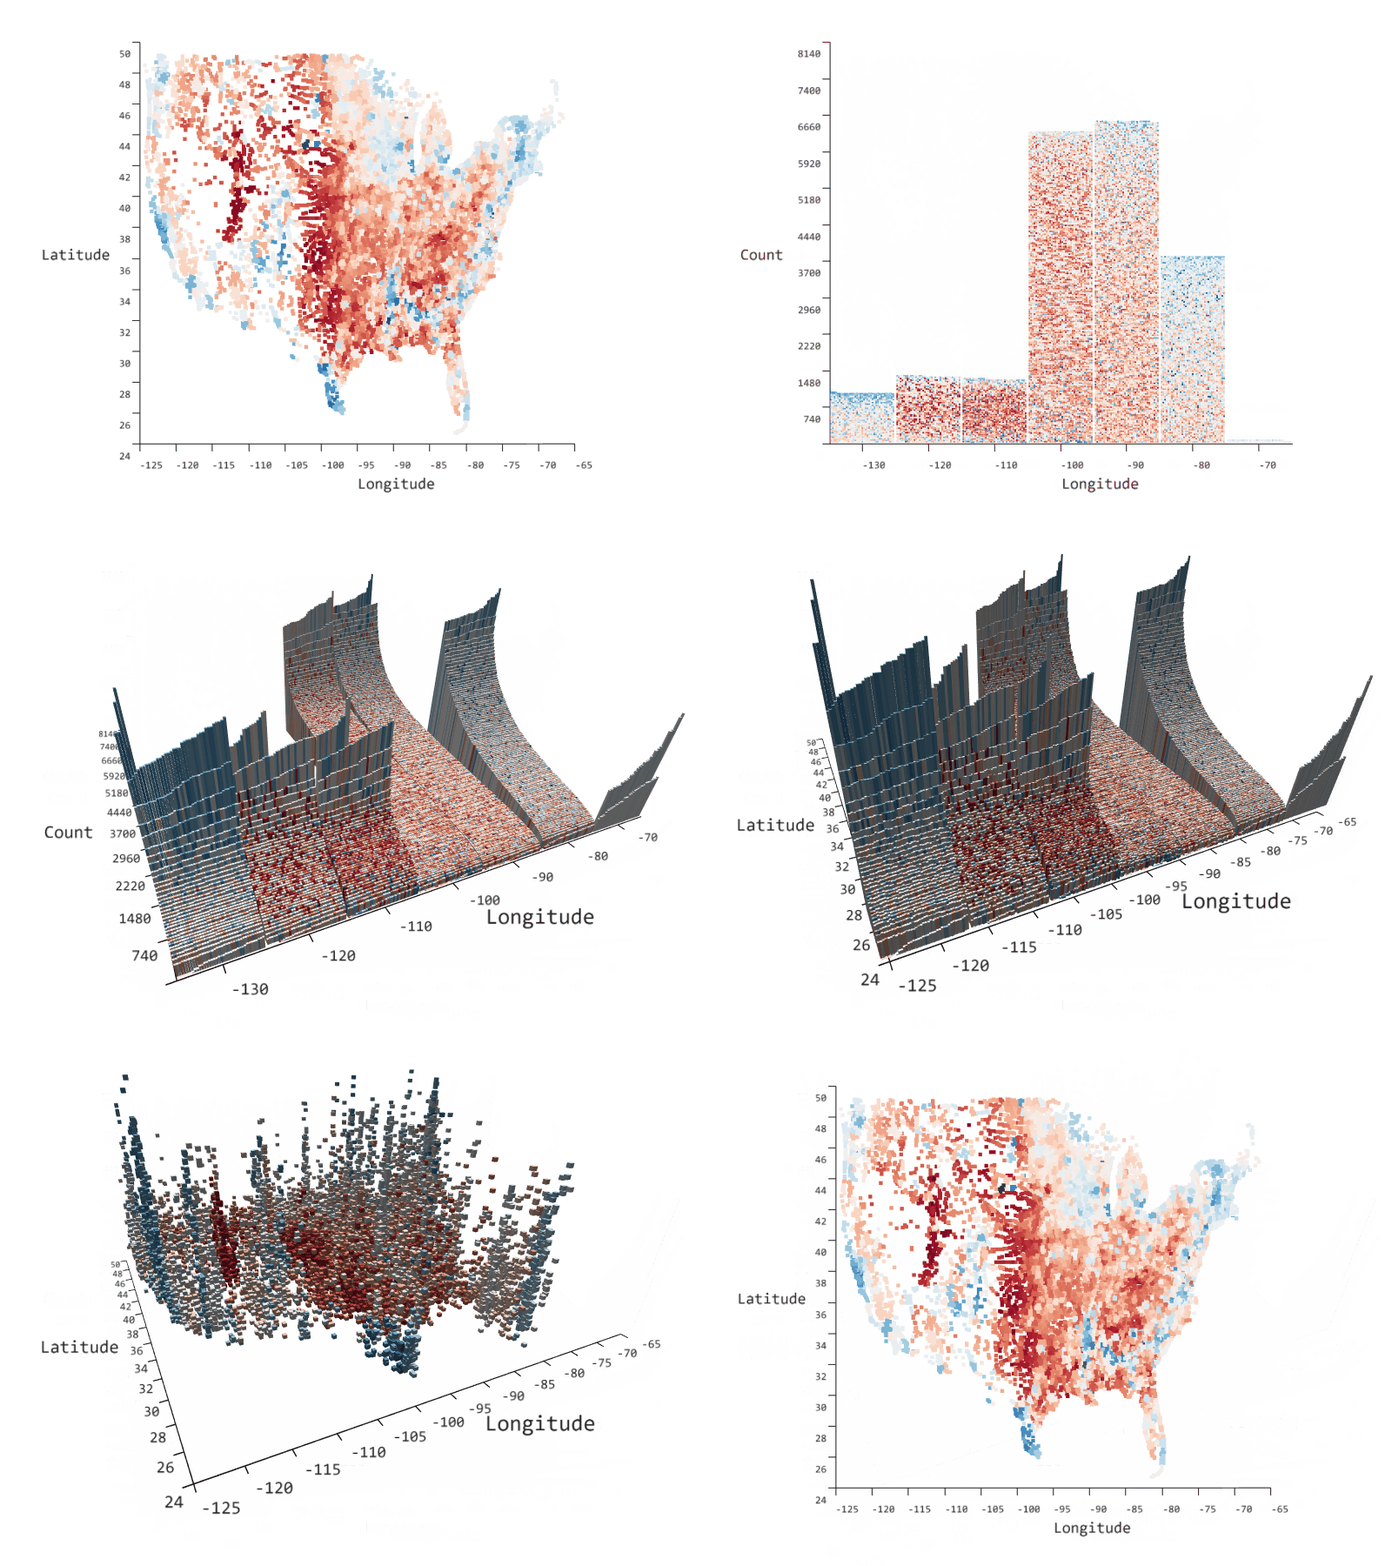
SandDance uses unit visualizations, which apply a one-to-one mapping between rows in your database and marks on the screen. Smooth animated transitions between views help you to maintain context as you interact with your data.

This new version of SandDance has been rebuilt from scratch with the goal of being modular, extensible, and embeddable into your custom applications. We are now on GitHub so that we are open and driven by the community through contributions, feature requests, and discussion.

SandDance was created by the Microsoft Research VIDA Group which explores novel technologies for visualization and immersive data analytics.

Where can I use SandDance?

Component architecture

SandDance is an offering of several JavaScript components:

  • sanddance - the core SandDance visualization canvas.
  • sanddance-react - the core SandDance visualization canvas for use in React based applications.
  • sanddance-vue - the core SandDance visualization canvas for use in Vue based applications.
  • sanddance-explorer - the core SandDance visualization canvas with UI to enable data exploration, for use in React based applications.

Publications

Articles & videos

Changelog

  • June 2020 - Major version bump to v3: Now using Deck.gl@8.
  • December 2019 - Major version bump to v2: Now using Vega@5.
  • August 2019 - Initial release to AppSource (Power BI marketplace).
  • April 2019 - Initial release to GitHub.

Known issues

  • Animations require a WebGL2 enabled browser.

Roadmap

  • PowerBI custom visual based on this new architecture. done!
  • Additional views, such as stacks. done!
  • Code examples and tutorials.
  • Faceting for all chart types. done!
  • Better date handling.

Dependencies

SandDance is created with open source libraries, using Vega for chart layout and Deck.gl for WebGL rendering.

Development

See dev.md

Contributing

This project welcomes contributions and suggestions. Most contributions require you to agree to a Contributor License Agreement (CLA) declaring that you have the right to, and actually do, grant us the rights to use your contribution. For details, visit https://cla.microsoft.com.

When you submit a pull request, a CLA-bot will automatically determine whether you need to provide a CLA and decorate the PR appropriately (e.g., label, comment). Simply follow the instructions provided by the bot. You will only need to do this once across all repos using our CLA.

This project has adopted the Microsoft Open Source Code of Conduct. For more information see the Code of Conduct FAQ or contact [email protected] with any additional questions or comments.
Comments
  • Facet label not showing for Japanese text

    Facet label not showing for Japanese text

    Hi! I am currently trying to recreate the SandDance app example on https://sanddance.js.org/app/ within a Nuxt.js project.

    When I try to facet by the chart and some data is in Japanese, the labels are not showing on top of each chart. Does this only work for the english alphabet?

    image

    opened by nami-cagla 14
  • Using Sanddance Explorer in a React application

    Using Sanddance Explorer in a React application

    First, I want to say thank you for this library; it looks like it has amazing potential, and could give many people the ability to explore their data.

    That said, the documentation and examples seem to be non-existent; as a result, I'm finding it very difficult to get a simple example off the ground.

    Here's the scenario I have; I have a set of data that I've downloaded/obtained from the server. It's a set of Javascript objects, but if necessary, I can get it from the server in JSON, CSV, whatever.

    The desire is to take that data and make it available in an instance of the Sanddance explorer.

    My thought is that it is as easy as creating an instance of Explorer and then passing the data along with column descriptors to it, but I can't seem to find a way to do that. The DataContent type implies there's some type to help provide and describe data, but I see no way of passing it to the Explorer instance.

    Is there an example out there that shows how to do this?

    opened by casperOne 10
  • PowerBI: Allow Visual Level Cross filtering

    PowerBI: Allow Visual Level Cross filtering

    Using the current version of SandDance for Power BI I cannot select a point/bar/mark in the sand dance visual and filter another chart on the same tab. I can select a bar on a non SandDance chart and it will filter the SandDance visual...but would like it to work the other way as well.

    opened by snapper911T 10
  • Page error if chart type is stacks

    Page error if chart type is stacks

    image Hi ! I wonder why when I switch chart type to stacks, the chart does not show, the page has an error, as shown in the picture above. The installation package is installed through npm. version is as follows.

    "@deck.gl/core": "^8.7.8", "@deck.gl/layers": "^8.7.8", "@fluentui/react": "^8.67.2", "@luma.gl/core": "^8.5.10", "@msrvida/sanddance": "^3.2.1", "@msrvida/sanddance-explorer": "^3.2.0", "vega": "^5.22.1", "react": "^16.12.0",

    opened by Wigithub1201 9
  • Building sanddance-explorer package

    Building sanddance-explorer package

    Hi Team,

    I am trying to build sanddance-explorer package. Since this is a monorepo. I ran following commands:

    npm install and npm run build

    I am getting following error during build command: image

    1. Can I build only sanddance-explorer package rather than all other packages.?
    2. How to run the sanddance-explore package?
    opened by praveen5959 9
  • Tooltip Customization

    Tooltip Customization

    Issue

    Currently the tooltip is limited to only show key value pairs of the values you are hovering.

    The component exposes a displayValue ( https://microsoft.github.io/SandDance/docs/sanddance/v3/interfaces/types.tooltipoptions.html ) option for the tooltip, however, that only gives you the ability to change the display value.

    Furthermore, it does not support React components. If you pass a react component as the display value, it will render [object Object].

    It would be ideal, if there was the ability to pass a custom component to the component. For instance:

    <SandDanceReact
      data={data}
      viewerOptions={{
        tooltipOptions: {
          tooltip: (values) => {
            return <MyFancyTooltip {...values} />;
          }
        }
      }
    />
    

    I realize the React component is only an abstraction over the vega and deck libraries which are not react specific either so this would need a little bit of magic to make it work.

    enhancement help wanted good first issue 
    opened by amcdnl 8
  • Keeping selection highlight when changing chart type

    Keeping selection highlight when changing chart type

    I am currently trying to recreate the SandDance app example on https://sanddance.js.org/app/ within a Nuxt.js project.

    I was able to figure out most of the functionalities, but I can't seem to find a solution for keeping the selection highlight (coloring of the cubes), when changing the chart type. At the moment, I use viewer.render to change the displayed graph, when updating the insight. So, after I select some data inside the graph, it highlights the selected data correctly. Then I click to change the chart type (using viewer.render with an updated insight), and the highlight disappears, but the selection still exists and is the same as before, because onSelectionChange isn't called

    How does it work in the SandDance app example on https://sanddance.js.org/app/ to keep the selection highlight, when changing to a different chart type? Maybe I can find a solution, if I understand that.

    opened by CAGLADJ 8
  • Describing data loaded into SandDance Explorer

    Describing data loaded into SandDance Explorer

    Currently we are loading data through the mounted callback, calling load on the Explorer component and passing an array of objects.

    It's clear that SandDance has some default logic for how to describe data; string values are categorical, numbers are quantifiable, etc. Additionally, I imagine that SandDance does things like encoding the string values into numbers in order to speed operations.

    However, in loading the data ourselves, we probably have (or can store/extend) metadata about our data to assist SandDance in this (as well as correct any false assumptions).

    As an example, if we have rows of data, like so:

    {
        id: 1,
        description: 'some thing',
        otherId: 4,
        category: 'car'
    }
    

    In this case, we know the following:

    • id is unique, it's self categorizing
    • description is unique (let's assume) and a numeric representation is already encoded in id
    • otherId is categorical, not quantitative, and we shouldn't allow aggregates on it
    • category is categorical, and needs an encoding for it

    That said, I see that there is a Column type in the TypeScript declarations which has some of that data (as well as min/max values, etc.). I also see that there is a DataContent interface which has the data and Column types exposed, and this looks promising.

    The question is, are there options for us to actually help SandDance explorer with this decision, or are these default assumptions the only choice we have?

    opened by casperOne 8
  • Chart Type Stacks not working.

    Chart Type Stacks not working.

    Hi Team,

    When I upload the csv with less than 3 rows then chart type Stacks doesn't load in 3D mode, but with rows more than 3 rows is working fine.

    This can be observed even on the demo site.

    Any reason why this is not working for files less than 3 rows?

    bug 
    opened by praveen5959 7
  • sanddance react can't show tooltips

    sanddance react can't show tooltips

    class SandDanceView extends React.Component {

    render() {
    
        var insight = {
            columns: {
                color: 'price',
                sort: 'createTime',
                uid: 'buyOrderVolume',
                x: 'createTime',
                y: 'price',
                z: 'volume'
            },
            scheme: 'redblue',
            size: {
                height: 2500,
                width: 2000
            },
            chart: 'scatterplot',
            view: '3d'
        };
        
    
        return (
                <SandDanceReact insight={insight} data={data} />
        )
    
    }
    

    }

    opened by wmydz1 7
  • Passing in Vega spec and hiding sidebar in SanddanceReact

    Passing in Vega spec and hiding sidebar in SanddanceReact

    Hi all,

    I'm trying out SandDanceReact for a project I'm working on, and am running into some difficulty figuring out how to use the component. Is it possible to pass in a Vega spec to the component, or am I limited to the predefined charts? If so, in what prop do I pass it in? I know that one of the examples did this, but it's unclear if the SandDanceReact component exposes vega-deck.gl.

    Also, what props can modify or disable the default legend/sidebar?

    Thanks for open sourcing this btw, it's a really cool project.

    opened by and-pulc 7
  • Bump json5 from 2.2.1 to 2.2.3

    Bump json5 from 2.2.1 to 2.2.3

    Bumps json5 from 2.2.1 to 2.2.3.

    Release notes

    Sourced from json5's releases.

    v2.2.3

    v2.2.2

    • Fix: Properties with the name __proto__ are added to objects and arrays. (#199) This also fixes a prototype pollution vulnerability reported by Jonathan Gregson! (#295).
    Changelog

    Sourced from json5's changelog.

    v2.2.3 [code, diff]

    v2.2.2 [code, diff]

    • Fix: Properties with the name __proto__ are added to objects and arrays. (#199) This also fixes a prototype pollution vulnerability reported by Jonathan Gregson! (#295).
    Commits
    • c3a7524 2.2.3
    • 94fd06d docs: update CHANGELOG for v2.2.3
    • 3b8cebf docs(security): use GitHub security advisories
    • f0fd9e1 docs: publish a security policy
    • 6a91a05 docs(template): bug -> bug report
    • 14f8cb1 2.2.2
    • 10cc7ca docs: update CHANGELOG for v2.2.2
    • 7774c10 fix: add proto to objects and arrays
    • edde30a Readme: slight tweak to intro
    • 97286f8 Improve example in readme
    • Additional commits viewable in compare view

    Dependabot compatibility score

    Dependabot will resolve any conflicts with this PR as long as you don't alter it yourself. You can also trigger a rebase manually by commenting @dependabot rebase.


    Dependabot commands and options

    You can trigger Dependabot actions by commenting on this PR:

    • @dependabot rebase will rebase this PR
    • @dependabot recreate will recreate this PR, overwriting any edits that have been made to it
    • @dependabot merge will merge this PR after your CI passes on it
    • @dependabot squash and merge will squash and merge this PR after your CI passes on it
    • @dependabot cancel merge will cancel a previously requested merge and block automerging
    • @dependabot reopen will reopen this PR if it is closed
    • @dependabot close will close this PR and stop Dependabot recreating it. You can achieve the same result by closing it manually
    • @dependabot ignore this major version will close this PR and stop Dependabot creating any more for this major version (unless you reopen the PR or upgrade to it yourself)
    • @dependabot ignore this minor version will close this PR and stop Dependabot creating any more for this minor version (unless you reopen the PR or upgrade to it yourself)
    • @dependabot ignore this dependency will close this PR and stop Dependabot creating any more for this dependency (unless you reopen the PR or upgrade to it yourself)
    • @dependabot use these labels will set the current labels as the default for future PRs for this repo and language
    • @dependabot use these reviewers will set the current reviewers as the default for future PRs for this repo and language
    • @dependabot use these assignees will set the current assignees as the default for future PRs for this repo and language
    • @dependabot use this milestone will set the current milestone as the default for future PRs for this repo and language

    You can disable automated security fix PRs for this repo from the Security Alerts page.

    dependencies javascript 
    opened by dependabot[bot] 0
  • 3D Scatter Chart Decimal Labels for Whole Numbers

    3D Scatter Chart Decimal Labels for Whole Numbers

    I am charting whole number values along the X, Y and Z axes. It look like if there are less than about nine values the labels show spaces for decimal values. As an example if the data for the X axis contains values of 1, 2, 3, 4 and 5, the labels will be 1, 1.5, 2, 2.5, 3, 3.5, 4, 4.5 and 5. This would be understandable if the data were real numbers, but they are integers. It would be nice if the chart did not add the extra spaces and labels when whole numbers are defined.

    opened by chrisheltzel 3
  • Problem with the initial loading of backgroundImage using insights variable also load snapshots json

    Problem with the initial loading of backgroundImage using insights variable also load snapshots json

    When is defined backgroundImage inside insights variable, doesn't load this image.

    Example SandDance-app.html:

        <script>
            var themeColors = {
                "dark": {
                    defaultCube: [128, 225, 255, 255]
                },
                "light": {
                    defaultCube: [128, 225, 255, 255]
                }
            };
            var insights = {
                "secured": {
                    "backgroundImage": {
                        "url": "data:image/png;base64,.....",
                        "size": {
                            "height": 1075,
                            "width": 643
                        },
                        "extents": {
                            "bottom": 48.8,
                            "left": -10.57,
                            "right": 2.1,
                            "top": 61.3
                        }
                    },
    

    It also happens when loading snapshots with backgroundImages defined in the json.

    bug good first issue 
    opened by calope 0
Releases(v3)
Owner
Microsoft
Open source projects and samples from Microsoft
Microsoft
danfo.js is an open source, JavaScript library providing high performance, intuitive, and easy to use data structures for manipulating and processing structured data.

Danfojs: powerful javascript data analysis toolkit What is it? Danfo.js is a javascript package that provides fast, flexible, and expressive data stru

JSdata 4k Dec 29, 2022
Apache Superset is a Data Visualization and Data Exploration Platform

Superset A modern, enterprise-ready business intelligence web application. Why Superset? | Supported Databases | Installation and Configuration | Rele

The Apache Software Foundation 49.9k Dec 31, 2022
DataSphereStudio is a one stop data application development& management portal, covering scenarios including data exchange, desensitization/cleansing, analysis/mining, quality measurement, visualization, and task scheduling.

English | 中文 Introduction DataSphere Studio (DSS for short) is WeDataSphere, a big data platform of WeBank, a self-developed one-stop data application

WeBankFinTech 2.4k Jan 2, 2023
Composable data visualisation library for web with a data-first approach now powered by WebAssembly

What is Muze? Muze is a free data visualization library for creating exploratory data visualizations (like Tableau) in browser, using WebAssembly. It

Charts.com 1.2k Dec 29, 2022
API to generate candlestick chart data for any time period based on transactions data

candel-maker API to generate candlestick chart data for any time period based on transactions data Installation clone repo git clone https://github.co

null 2 Aug 18, 2022
🌀 The Javacript framework for creating a portal to your data. Perfect for a single dataset or a full catalog.

?? Portal.JS The javascript framework for data portals ?? portal is a framework for rapidly building rich data portal frontends using a modern fronten

Datopian 2k Dec 30, 2022
A library optimized for concise and principled data graphics and layouts.

MetricsGraphics is a library built for visualizing and laying out time-series data. At around 15kB (gzipped), it provides a simple way to produce comm

Metrics Graphics 7.5k Dec 22, 2022
A library optimized for concise and principled data graphics and layouts.

MetricsGraphics is a library built for visualizing and laying out time-series data. At around 15kB (gzipped), it provides a simple way to produce comm

Metrics Graphics 7.5k Dec 22, 2022
Bring data to life with SVG, Canvas and HTML. :bar_chart::chart_with_upwards_trend::tada:

D3: Data-Driven Documents D3 (or D3.js) is a JavaScript library for visualizing data using web standards. D3 helps you bring data to life using SVG, C

D3 103.8k Jan 3, 2023
Apache ECharts is a powerful, interactive charting and data visualization library for browser

Apache ECharts Apache ECharts is a free, powerful charting and visualization library offering an easy way of adding intuitive, interactive, and highly

The Apache Software Foundation 53.8k Jan 9, 2023
Powerful data visualization library based on G2 and React.

BizCharts New charting and visualization library has been released: http://bizcharts.net/products/bizCharts. More details about BizCharts Features Rea

Alibaba 6k Jan 3, 2023
Compose complex, data-driven visualizations from reusable charts and components with d3

d3.compose Compose rich, data-bound charts from charts (like Lines and Bars) and components (like Axis, Title, and Legend) with d3 and d3.chart. Advan

Cornerstone Systems 702 Jan 3, 2023
Apache ECharts is a powerful, interactive charting and data visualization library for browser

Apache ECharts Apache ECharts is a free, powerful charting and visualization library offering an easy way of adding intuitive, interactive, and highly

The Apache Software Foundation 53.8k Jan 5, 2023
Data Visualization Components

react-vis | Demos | Docs A COMPOSABLE VISUALIZATION SYSTEM Overview A collection of react components to render common data visualization charts, such

Uber Open Source 8.4k Jan 2, 2023
📊 A highly interactive data-driven visualization grammar for statistical charts.

English | 简体中文 G2 A highly interactive data-driven visualization grammar for statistical charts. Website • Tutorial Docs • Blog • G2Plot G2 is a visua

AntV team 11.5k Dec 30, 2022
Keshif - Data Made Explorable (Prototype)

Keshif This repostory is not actively maintained. To access the most recent version and the online platform, visit www.keshif.me Keshif is a web-based

Adil Yalcin 459 Nov 16, 2022
Data visualization library for depicting quantities as animated liquid blobs

liquidity.js A data visualization library for depicting quantities as animated liquid blobs. For a demonstration of what the final product can look li

N Halloran 91 Sep 20, 2022
🍞📊 Beautiful chart for data visualization.

?? ?? Spread your data on TOAST UI Chart. TOAST UI Chart is Beautiful Statistical Data Visualization library. ?? Packages The functionality of TOAST U

NHN 5.2k Jan 2, 2023
A data visualization framework combining React & D3

Semiotic is a data visualization framework combining React & D3 Interactive Documentation API Docs on the wiki Examples Installation npm i semiotic E

nteract 2.3k Dec 29, 2022