Django Class Based Views to generate Ajax charts js parameters.

Overview

Django Chartjs

Django Chartjs lets you manage charts in your Django application.

https://travis-ci.org/peopledoc/django-chartjs.svg?branch=master https://coveralls.io/repos/peopledoc/django-chartjs/badge.png?branch=master&style=flat

This is compatible with Chart.js and Highcharts JS libraries.

Using a set of predefined Class Based Views you are able to get started after writing just your SQL query.

Getting Started

Install django-chartjs:

pip install django-chartjs

Add it to your INSTALLED_APPS settings:

INSTALLED_APPS = (
    '...',
    'chartjs',
)

Using it

A simple Line Chart example.

1. Create the HTML file

{% load static %}
<html>
    <head>
        <title>django-chartjs line chart demo</title>
        <!--[if lte IE 8]>
            <script src="{% static 'js/excanvas.js' %}"></script>
        <![endif]-->
    </head>
    <body>
        <h1>Some Line Charts loaded in Ajax!</h1>

        <canvas id="myChart" width="500" height="400"></canvas>

        <script type="text/javascript" src="http://code.jquery.com/jquery-1.10.0.min.js"></script>
        <script type="text/javascript" src="{% static 'js/Chart.min.js' %}"></script>
        <script type="text/javascript">
            $.get('{% url "line_chart_json" %}', function(data) {
                var ctx = $("#myChart").get(0).getContext("2d");
                new Chart(ctx, {
                    type: 'line', data: data
                });
            });
        </script>
    </body>
</html>

2. Create the view with labels and data definition

from django.views.generic import TemplateView
from chartjs.views.lines import BaseLineChartView


class LineChartJSONView(BaseLineChartView):
    def get_labels(self):
        """Return 7 labels for the x-axis."""
        return ["January", "February", "March", "April", "May", "June", "July"]

    def get_providers(self):
        """Return names of datasets."""
        return ["Central", "Eastside", "Westside"]

    def get_data(self):
        """Return 3 datasets to plot."""

        return [[75, 44, 92, 11, 44, 95, 35],
                [41, 92, 18, 3, 73, 87, 92],
                [87, 21, 94, 3, 90, 13, 65]]


line_chart = TemplateView.as_view(template_name='line_chart.html')
line_chart_json = LineChartJSONView.as_view()

3. Update urls.py with the new urls for TemplateView and AJAX call 'line_chart_json' as in chart.html

from .views import line_chart, line_chart_json

urlpatterns = [
  '...',
  path('chart', line_chart, name='line_chart'),
  path('chartJSON', line_chart_json, name='line_chart_json'),
]

4. Get a Chart.js Line Chart
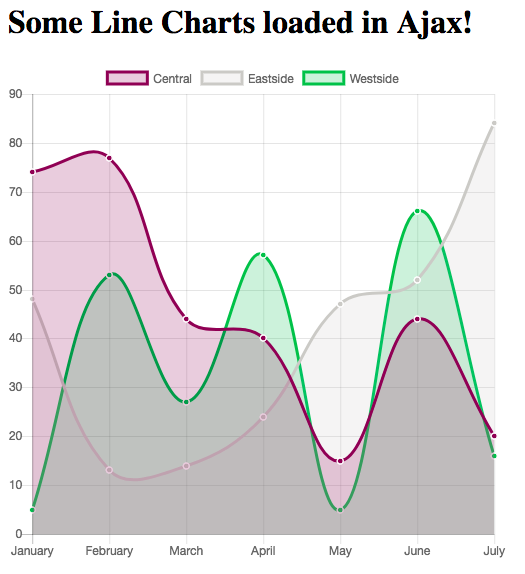
https://raw.github.com/peopledoc/django-chartjs/master/docs/_static/django-chartjs.png

It is that simple!

For other examples including a HighCharts line chart, don't hesitate to look at the demo project.

Also, feel free to contribute your demo!

Comments
  • Class hierarchy fix and naming consistency

    Class hierarchy fix and naming consistency

    We now have BaseColumnsHighChartsView subclass HighChartsView rathern than JSONView and call the appropraite methods on the superclass for things like context data & plot options.

    Also updated a bunch of class names as per issue #12 and generally tried to improve consistency everywhere.

    opened by jimr 6
  • Generator for discontinuous datestamped data

    Generator for discontinuous datestamped data

    This generator is used when you want to plot non-continuous date-stamped data from a Django QuerySet. For example, you might have data spanning three weeks, but you're missing data for the weekends, and you want to express that those data points are missing.

    In order to use this generator you would provide the start and end dates as either datetime.date objects, or strings with the format yyyy-mm-dd, the QuerySet of the model you're using, the name of the date attribute of the model, and the name of the value attribute of the model that you're interested in. If the QuerySet doesn't have a value for a particular date, then this generator yields a 'null'.

    opened by cjohnson318 5
  • Highcharts license?

    Highcharts license?

    What license applies to the bundled version of Highcharts? Highcharts has been non-free software for quite a while and requires a license for non-commercial use. Unfortunately, the link in the highcharts.js file (www.highcharts.com/license) is dead.

    opened by dhepper 5
  • ref #23 - Upgrade django-chartjs to python35 and Django 1.8+

    ref #23 - Upgrade django-chartjs to python35 and Django 1.8+

    Upgrade support to python 2.7 + 3.4 + 3.5, on Django 1.8 + 1.9 and 1.10

    ref #23

    • [x] change tox.ini
    • [x] change .travis.yml
    • [x] update demoproject and settings in order to unit tests to pass
    • [ ] need to do a new release or release on PyPi for python3 ?
    enhancement 
    opened by FlogFr 5
  • Not displaying Pie chart in Django

    Not displaying Pie chart in Django

    Hi authors django-chartit, I have bit problem with your labour. See detail here http://stackoverflow.com/questions/36179624/right-displaying-pie-chart-in-django-with-help-django-chartjs.

    May somebody known how right working with django-charjs and building pie chart

    Thanks

    opened by padymkoclab 4
  • Doughnut chart is uniformly grey

    Doughnut chart is uniformly grey

    Hi,

    I'm implementing a doughnut chart, all labels and areas appears grey : the default colors does not applies to the chart.

    How can I set colors to both labels and areas ?

    Thanks !

    opened by frague59 3
  • ModuleNotFoundError: No module named 'chatjs'

    ModuleNotFoundError: No module named 'chatjs'

    I've installed with this: pip3 install django-chartjs.

    This is how I import on INSTALLED_APPS:

    INSTALLED_APPS = [
        'chatjs',
        'rest.apps.RestConfig',
        'interface.apps.InterfaceConfig',
        'django.contrib.admin',
        'django.contrib.auth',
        'django.contrib.contenttypes',
        'django.contrib.sessions',
        'django.contrib.messages',
        'django.contrib.staticfiles',
    ]
    

    This is the error obtained from django:

    Unhandled exception in thread started by <function check_errors.<locals>.wrapper at 0x1038e46a8>
    Traceback (most recent call last):
      File "/usr/local/lib/python3.6/site-packages/django/utils/autoreload.py", line 225, in wrapper
        fn(*args, **kwargs)
      File "/usr/local/lib/python3.6/site-packages/django/core/management/commands/runserver.py", line 112, in inner_run
        autoreload.raise_last_exception()
      File "/usr/local/lib/python3.6/site-packages/django/utils/autoreload.py", line 248, in raise_last_exception
        raise _exception[1]
      File "/usr/local/lib/python3.6/site-packages/django/core/management/__init__.py", line 327, in execute
        autoreload.check_errors(django.setup)()
      File "/usr/local/lib/python3.6/site-packages/django/utils/autoreload.py", line 225, in wrapper
        fn(*args, **kwargs)
      File "/usr/local/lib/python3.6/site-packages/django/__init__.py", line 24, in setup
        apps.populate(settings.INSTALLED_APPS)
      File "/usr/local/lib/python3.6/site-packages/django/apps/registry.py", line 89, in populate
        app_config = AppConfig.create(entry)
      File "/usr/local/lib/python3.6/site-packages/django/apps/config.py", line 90, in create
        module = import_module(entry)
      File "/usr/local/Cellar/python/3.6.5/Frameworks/Python.framework/Versions/3.6/lib/python3.6/importlib/__init__.py", line 126, in import_module
        return _bootstrap._gcd_import(name[level:], package, level)
      File "<frozen importlib._bootstrap>", line 994, in _gcd_import
      File "<frozen importlib._bootstrap>", line 971, in _find_and_load
      File "<frozen importlib._bootstrap>", line 953, in _find_and_load_unlocked
    ModuleNotFoundError: No module named 'chatjs'
    Unhandled exception in thread started by <function check_errors.<locals>.wrapper at 0x1118e66a8>
    Traceback (most recent call last):
      File "/usr/local/lib/python3.6/site-packages/django/utils/autoreload.py", line 225, in wrapper
        fn(*args, **kwargs)
      File "/usr/local/lib/python3.6/site-packages/django/core/management/commands/runserver.py", line 112, in inner_run
        autoreload.raise_last_exception()
      File "/usr/local/lib/python3.6/site-packages/django/utils/autoreload.py", line 248, in raise_last_exception
        raise _exception[1]
      File "/usr/local/lib/python3.6/site-packages/django/core/management/__init__.py", line 327, in execute
        autoreload.check_errors(django.setup)()
      File "/usr/local/lib/python3.6/site-packages/django/utils/autoreload.py", line 225, in wrapper
        fn(*args, **kwargs)
      File "/usr/local/lib/python3.6/site-packages/django/__init__.py", line 24, in setup
        apps.populate(settings.INSTALLED_APPS)
      File "/usr/local/lib/python3.6/site-packages/django/apps/registry.py", line 89, in populate
        app_config = AppConfig.create(entry)
      File "/usr/local/lib/python3.6/site-packages/django/apps/config.py", line 90, in create
        module = import_module(entry)
      File "/usr/local/Cellar/python/3.6.5/Frameworks/Python.framework/Versions/3.6/lib/python3.6/importlib/__init__.py", line 126, in import_module
        return _bootstrap._gcd_import(name[level:], package, level)
      File "<frozen importlib._bootstrap>", line 994, in _gcd_import
      File "<frozen importlib._bootstrap>", line 971, in _find_and_load
      File "<frozen importlib._bootstrap>", line 953, in _find_and_load_unlocked
    ModuleNotFoundError: No module named 'django-chartjs'
    Unhandled exception in thread started by <function check_errors.<locals>.wrapper at 0x1041a86a8>
    Traceback (most recent call last):
      File "/usr/local/lib/python3.6/site-packages/django/utils/autoreload.py", line 225, in wrapper
        fn(*args, **kwargs)
      File "/usr/local/lib/python3.6/site-packages/django/core/management/commands/runserver.py", line 112, in inner_run
        autoreload.raise_last_exception()
      File "/usr/local/lib/python3.6/site-packages/django/utils/autoreload.py", line 248, in raise_last_exception
        raise _exception[1]
      File "/usr/local/lib/python3.6/site-packages/django/core/management/__init__.py", line 327, in execute
        autoreload.check_errors(django.setup)()
      File "/usr/local/lib/python3.6/site-packages/django/utils/autoreload.py", line 225, in wrapper
        fn(*args, **kwargs)
      File "/usr/local/lib/python3.6/site-packages/django/__init__.py", line 24, in setup
        apps.populate(settings.INSTALLED_APPS)
      File "/usr/local/lib/python3.6/site-packages/django/apps/registry.py", line 89, in populate
        app_config = AppConfig.create(entry)
      File "/usr/local/lib/python3.6/site-packages/django/apps/config.py", line 90, in create
        module = import_module(entry)
      File "/usr/local/Cellar/python/3.6.5/Frameworks/Python.framework/Versions/3.6/lib/python3.6/importlib/__init__.py", line 126, in import_module
        return _bootstrap._gcd_import(name[level:], package, level)
      File "<frozen importlib._bootstrap>", line 994, in _gcd_import
      File "<frozen importlib._bootstrap>", line 971, in _find_and_load
      File "<frozen importlib._bootstrap>", line 953, in _find_and_load_unlocked
    ModuleNotFoundError: No module named 'chatjs'
    
    opened by Lechucico 3
  • setup fails when LC_ALL=C is set

    setup fails when LC_ALL=C is set

    I believe the issue here is that when LC_ALL=C is set the encoding is switched to encodings/ascii.py and we get an error which is UnicodeDecodeError: 'ascii' codec can't decode byte 0xc3 in position 880: ordinal not in range(128). Here is the error trace:

    File "/var/www/venv/eis/build/django-chartjs/setup.py", line 19, in <module>
    long_description=read_relative_file('README.rst'),
    File "/var/www/venv/eis/build/django-chartjs/setup.py", line 11, in read_relative_file
    return f.read()
    File "/var/www/venv/eis/lib/python3.4/encodings/ascii.py", line 26, in decode
    return codecs.ascii_decode(input, self.errors)[0]
    UnicodeDecodeError: 'ascii' codec can't decode byte 0xc3 in position 880: ordinal not in range(128)
    

    Because ascii does not support some symbols used in the html which is the part of this README.rst we get the error. This is not an issue in the most of cases but makes impossible to install the module via some provisioning systems like SaltStack.

    opened by canufeel 3
  • Chart.min.js is too old

    Chart.min.js is too old

    Chart.js 1.0.2 released 27 days ago. Please update your static. Chart.min.js bundled with package does not contain even an .addData (valuesArray, label).

    opened by g1itch 3
  • Makefile lacks demo target

    Makefile lacks demo target

    The Makefile lacks a demo target, yet demo/README includes these instructions:

    git clone [email protected]:novagile/django-chartjs.git cd django-chartjs/ make demo

    It installs and runs the demo server on localhost, port 8000. So have a look at http://localhost:8000/

    For someone unfamiliar with Django, a working demo would be great.

    opened by smontanaro 3
  • Update lines.py

    Update lines.py

    I made a modification on the BaseLineChartView class. Instead of using the class BaseLineOptionsChartView, I added the method get_options(self, index, color) to BaseLineChartView By this way, it is possible to insert new options per dataset preserving the default ones at the client View class. Example as in the Readme:

    class LineChartJSONView(BaseLineChartView): def get_labels(self): """Return 7 labels for the x-axis.""" return ["January", "February", "March", "April", "May", "June", "July"]

    def get_providers(self):
        """Return names of datasets."""
        return ["Central", "Eastside", "Westside"]
    
    def get_data(self):
        """Return 3 datasets to plot."""
    
        return [[75, 44, 92, 11, 44, 95, 35],
                [41, 92, 18, 3, 73, 87, 92],
                [87, 21, 94, 3, 90, 13, 65]]
    
    def get_options(self, index, color):
        options = super(LineChartJSONView,self).get_options(index, color)
        options.update({'lineTension':0})
        return options
    

    If one uses the BaseLineOptionsChartView, it is necessary to modify the html template to: type: 'line', data: data.data, options: data.options,

    Using as I suggested, it is not needed to modify the chart.html javascript anymore, keeping it as the README file: type: 'line', data: data,

    With this suggestion, event the BaseLineOptionsChartView is not necessary anymore.

    Regards

    opened by edras 2
  • Update to Chart.js 3

    Update to Chart.js 3

    Chart.js 3 has many new features and performance improvements. It would be great to be able to use them in Django Chartjs!

    See also the Chart.js 3.x Migration Guide.

    opened by EwoutH 0
  • Chart display permission

    Chart display permission

    Hi,

    In order to display or not to display the chart for the current user, I overwrite the get_data method of BaseLineChartView class such as :

    def get_data(self): """If not authorized, do not display chart""" if not self.request.user.is_superuser: return False

    And this works and chart is not displayed as intended. But is there any other better practice for permission management?

    Thank You

    opened by AliPolat 0
  • Bar chart is not working? What am I doing wrong?

    Bar chart is not working? What am I doing wrong?

    My view:

    class BarChartJSONView(BaseColumnsHighChartsView):
        def get_title(self):
            return "Testing bar charts"
    
        def get_labels(self):
            return ['Africa', 'America', 'Asia', 'Europe', 'Oceania']
    
        def get_yUnit(self):
            return "What is this?!"
    
        def get_providers(self):
            return ["Year 1800", "Year 1900", "Year 2000"]
    
        def get_data(self):
            return [[107, 31, 635, 203, 2], [133, 156, 947, 408, 6], [1052, 954, 4250, 740, 38]]
    

    My url:

        path('chartJSON', views.BarChartJSONView.as_view(), name='bar_chart_json'),
    

    Template:

        <script type="text/javascript">
            $.get('{% url "accounts:bar_chart_json" %}', function(data) {
                var ctx = $("#myChart").get(0).getContext("2d");
                new Chart(ctx, {
                    type: 'bar', data: data
                });
            });
        </script>


    Line chart works fine, but just a simple change to implement a bar chart just returns a grid with 1.0 max on Y axis.

    opened by templargin 2
Releases(2.3.0)
Owner
PeopleDoc
Top-Notch HR Services to Employees. Faster.
PeopleDoc
A plugin for the jQuery javascript library to generate small sparkline charts directly in the browser

jQuery Sparklines This jQuery plugin makes it easy to generate a number of different types of sparklines directly in the browser, using online a line

Gareth Watts 1.2k Jan 4, 2023
Beautiful and interactive javascript charts for Java-based web applications.

Wicked Charts Beautiful and interactive JavaScript charts for Java-based web applications. Check out the Changelog Check out the Feature Overview with

adesso SE 85 Aug 23, 2022
J2CL and GWT Charts library based on CHART.JS

Charba - J2CL and GWT Charts library based on CHART.JS What's Charba GWT Web toolkit doesn't have charting library available out of the box. There are

Pepstock.org 56 Dec 17, 2022
Beautiful charts for Angular based on Chart.js

ng2-charts slack Beautiful charts for Angular based on Chart.js Usage & Demo Samples using ng2-charts https://valor-software.com/ng2-charts/ Installat

Valor Software 2.2k Jan 4, 2023
Simple HTML5 Charts using the tag

Simple yet flexible JavaScript charting for designers & developers Documentation Currently, there are two versions of the library (2.9.4 and 3.x.x). V

Chart.js 59.4k Jan 7, 2023
Simple responsive charts

Big welcome by the Chartist Guy Checkout the documentation site at http://gionkunz.github.io/chartist-js/ Checkout this lightning talk that gives you

Gion Kunz 26 Dec 30, 2022
Simple, responsive, modern SVG Charts with zero dependencies

Frappe Charts GitHub-inspired modern, intuitive and responsive charts with zero dependencies Explore Demos » Edit at CodePen » Contents Installation U

Frappe 14.6k Jan 4, 2023
📊 A highly interactive data-driven visualization grammar for statistical charts.

English | 简体中文 G2 A highly interactive data-driven visualization grammar for statistical charts. Website • Tutorial Docs • Blog • G2Plot G2 is a visua

AntV team 11.5k Dec 30, 2022
JavaScript diagramming library for interactive flowcharts, org charts, design tools, planning tools, visual languages.

GoJS, a JavaScript Library for HTML Diagrams GoJS is a JavaScript and TypeScript library for creating and manipulating diagrams, charts, and graphs. S

Northwoods Software Corporation 6.6k Dec 30, 2022
Attractive JavaScript charts for jQuery

flot About flot is a JavaScript plotting library for engineering and scientific applications derived from Flot: http://www.flotcharts.org/ Take a look

Flot 5.9k Dec 22, 2022
Progressive pie, donut, bar and line charts

Peity Peity (sounds like deity) is a jQuery plugin that converts an element's content into a mini <svg> pie, donut, line or bar chart. Basic Usage HTM

Ben Pickles 4.2k Jan 1, 2023
Charts for Raphaël

g.Raphaël - Official charting plugin for Raphaël For more information, see: http://g.raphaeljs.com/ Changelog v0.51 Fixed issues with piechart related

Dmitry Baranovskiy 1.5k Dec 31, 2022
Awesome charts for AngularJS.

n3-line-chart v2 n3-line-chart is an easy-to-use JavaScript library for creating beautiful charts in AngularJS applications and it is built on top of

null 1.2k Dec 7, 2022
Create beautiful charts with one line of JavaScript

Chartkick.js Create beautiful charts with one line of JavaScript See it in action Supports Chart.js, Google Charts, and Highcharts Also available for

Andrew Kane 1.2k Jan 2, 2023
Ember Charts 3.5 2.3 L2 JavaScript A powerful and easy to use charting library for Ember.js

Ember Charts A charting library built with the Ember.js and d3.js frameworks. It includes time series, bar, pie, and scatter charts which are easy to

Addepar 793 Dec 7, 2022
A friendly reusable charts DSL for D3

D4 D4 is a friendly charting DSL for D3. The goal of D4 is to allow developers to quickly build data-driven charts with little knowledge of the intern

Mark Daggett 429 Dec 5, 2022
Reusable JavaScript library for creating sketchy/hand-drawn styled charts in the browser.

roughViz.js is a reusable JavaScript library for creating sketchy/hand-drawn styled charts in the browser, based on D3v5, roughjs, and handy. Why? Use

Jared Wilber 6.4k Jan 4, 2023
Financial lightweight charts built with HTML5 canvas

Lightweight Charts Demos | Documentation | Discord community TradingView Lightweight Charts are one of the smallest and fastest financial HTML5 charts

TradingView, Inc. 5.8k Jan 9, 2023
Create beautiful JavaScript charts with one line of React

React Chartkick Create beautiful JavaScript charts with one line of React See it in action Supports Chart.js, Google Charts, and Highcharts Quick Star

Andrew Kane 1.2k Dec 28, 2022