Charba - J2CL and GWT Charts library based on CHART.JS


![]()
What's Charba
GWT Web toolkit doesn't have charting library available out of the box.
There are some open source charting libraries for GWT available to be used but with some constraints or unclear items:
- internet connection needed
- open source license not completely clear, sometimes with some obligations like to add specific labels
- old packages not longer maintained
For all these reasons, Charba has been developed, leveraging on Chart.JS capabilities which are now available to GWT developers.
Not only GWT
Even if Charba was born only as GWT chart library, as of version 3, Charba has been changed in order to be used not only in GWT but also with other DOM frameworks, based on J2CL - JavaToClosure, like Google Elemental2 or Elemento.
Charba has got an own DOM manager which allows to it to be independent from any other DOM frameworks (i.e. GWT, Elemental2 or Elemento) but it is providing a set of hooks in order to use it also over those frameworks.

Building
To build Charba, you can check out the project and to run Ant build.xml.
The Ant build.xml is able to build the 2 artifacts, related to the 2 distributions available.
The first distribution is a Charba file without any GWT dependency (but working on GWT anyway), consumable also in other J2CL - JavaToClosure frameworks, like Google Elemental2 and Elemento.
To build the project, execute buildBinary target.
It creates a charba-[version.release].jar file in dist folder, ready to be included in your project.
The second distribution is a Charba file with a hard GWT dependency which contains charts widgets and code splitting capabilities.
To build the project, execute buildBinaryGwt target.
It creates a charba-[version.release]-gwt.jar file in dist folder, ready to be included in your project.

Installation
Currently Charba is available on MVN repository.
It is available also on GitHub releases.
If you are using Apache Maven:
<dependency>
    <groupId>org.pepstock</groupId>
    <artifactId>charba</artifactId>
    <version>5.0</version>
    <!-- for GWT -->
    <version>5.0-gwt</version>
</dependency>
If you are using Apache Ivy:
<dependency org="org.pepstock" name="charba" rev="5.0"/>
<!-- for GWT -->
<dependency org="org.pepstock" name="charba" rev="5.0-gwt"/>
To install in your GWT project, both for GWT and for J2CL artifacts, you must the following configuration in your GWT project module configuration:
...
    <inherits name="org.pepstock.charba.Charba"/>
...
Charba is based on JSINTEROP method to integrate java script objects.
As the name suggests, JsInterop is a way of interoperating Java with JavaScript. It offers a better way of communication between the two using annotations instead of having to write java script in your classes (using JSNI).
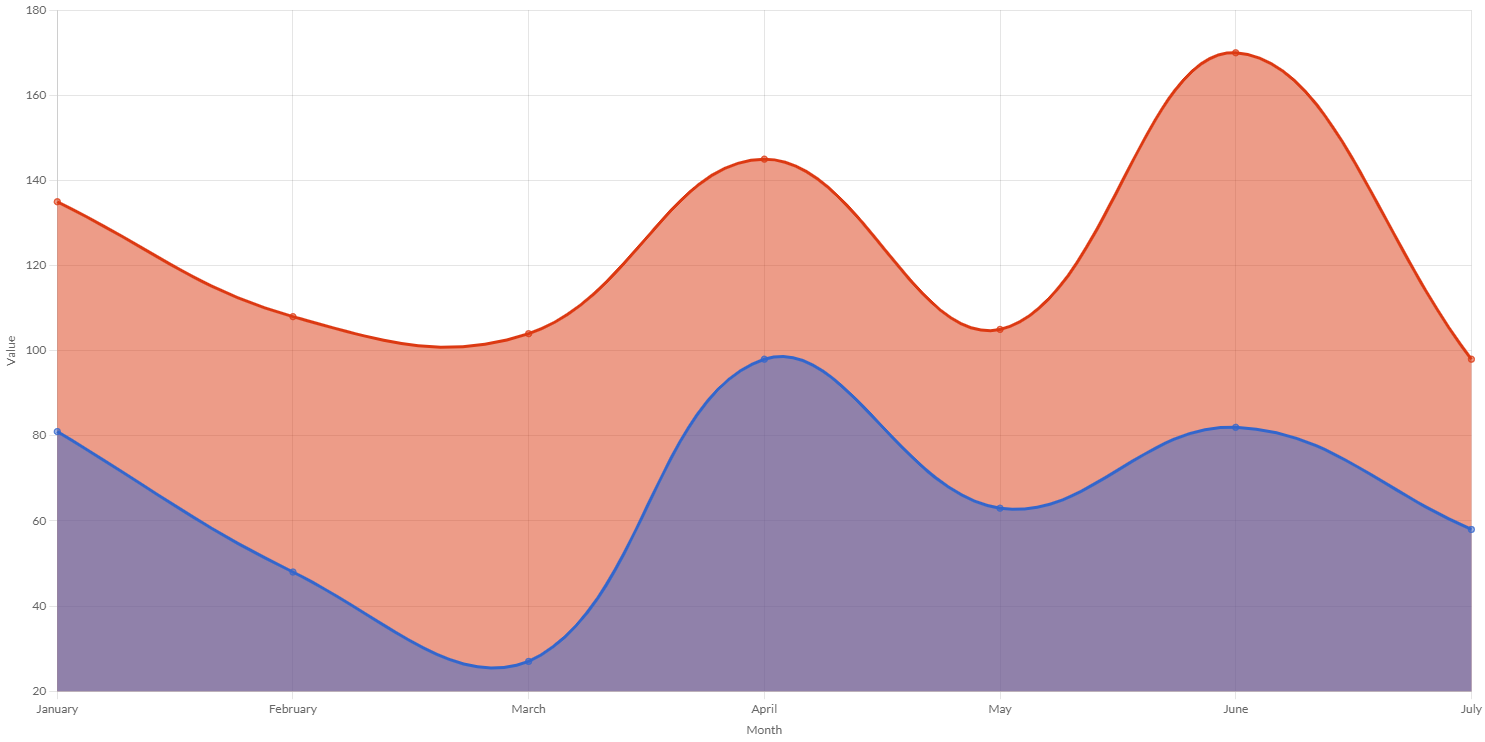
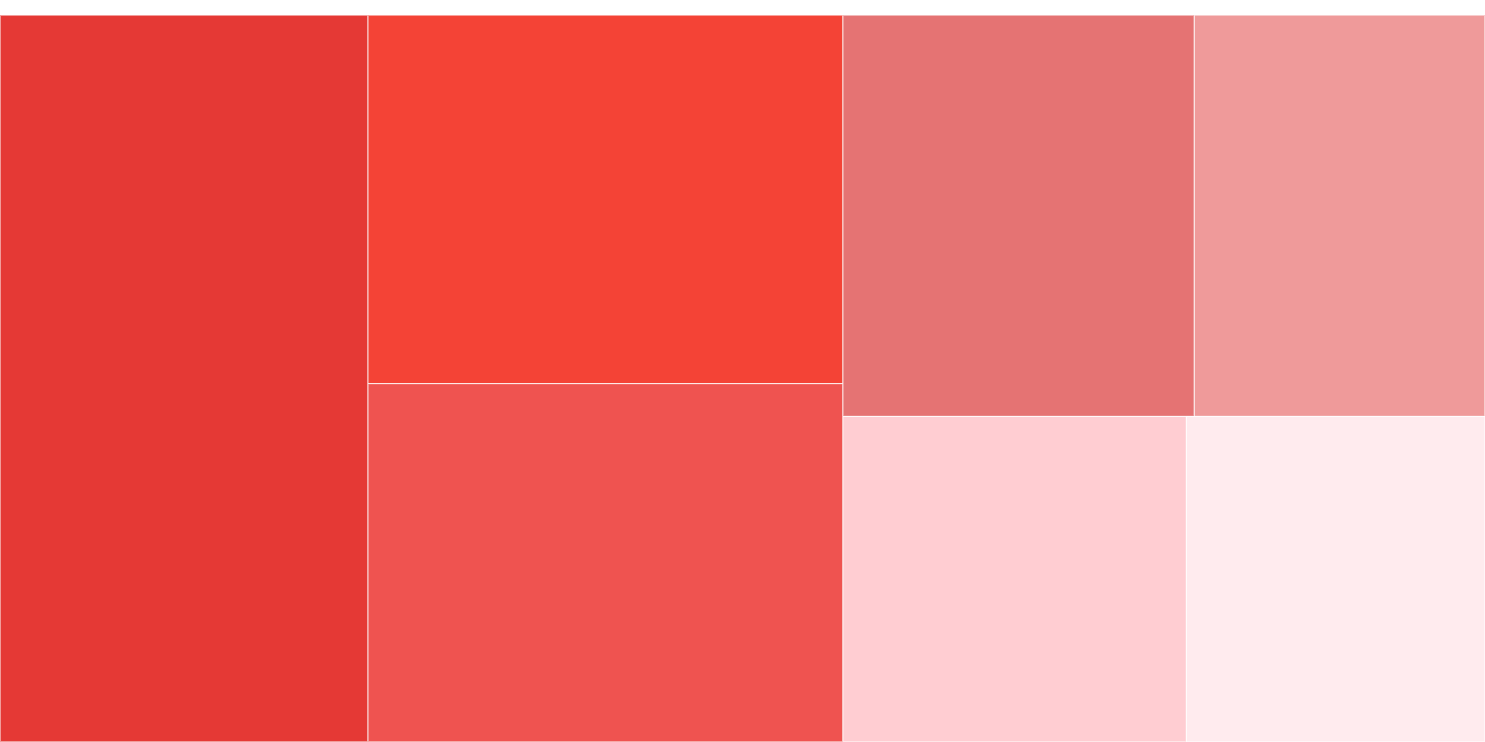
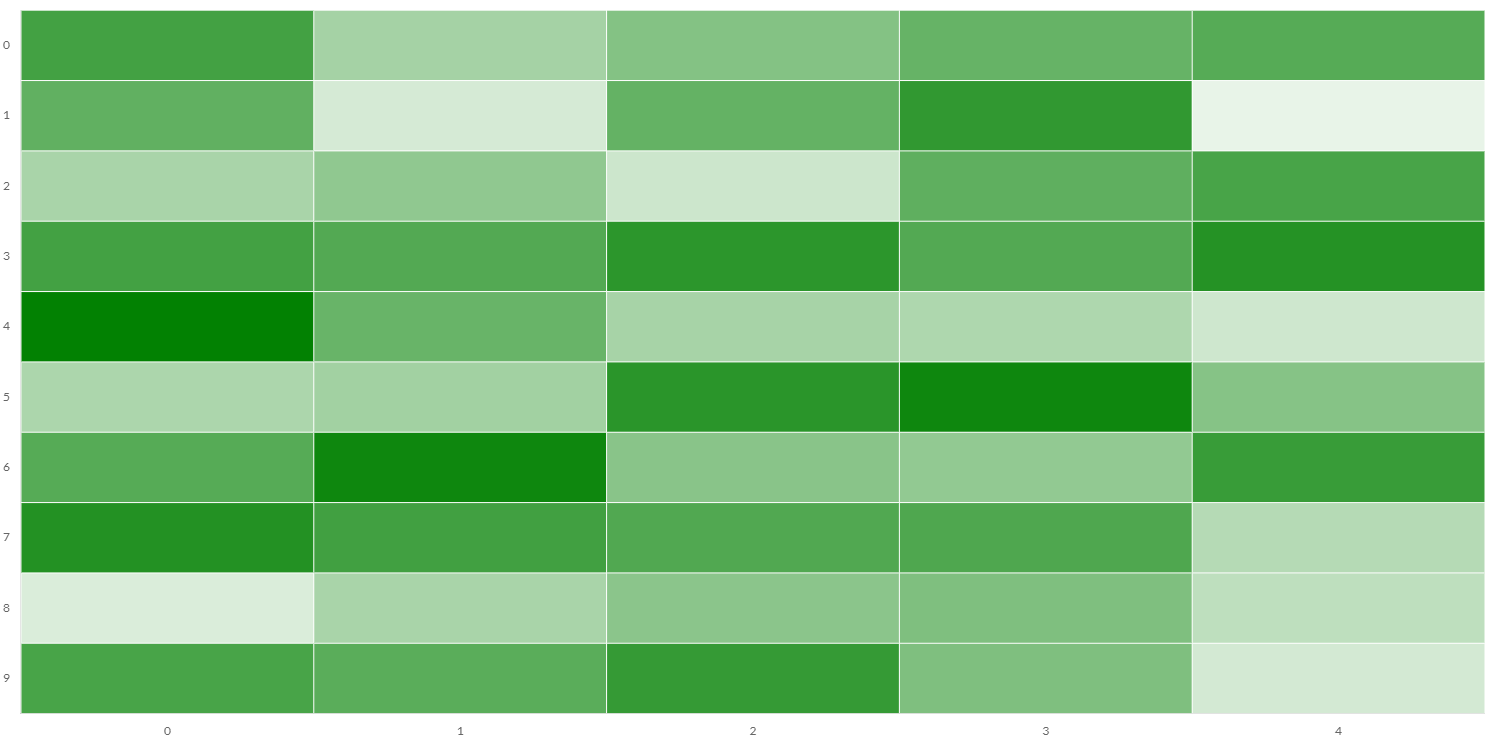
Gallery
 |
 |
 |
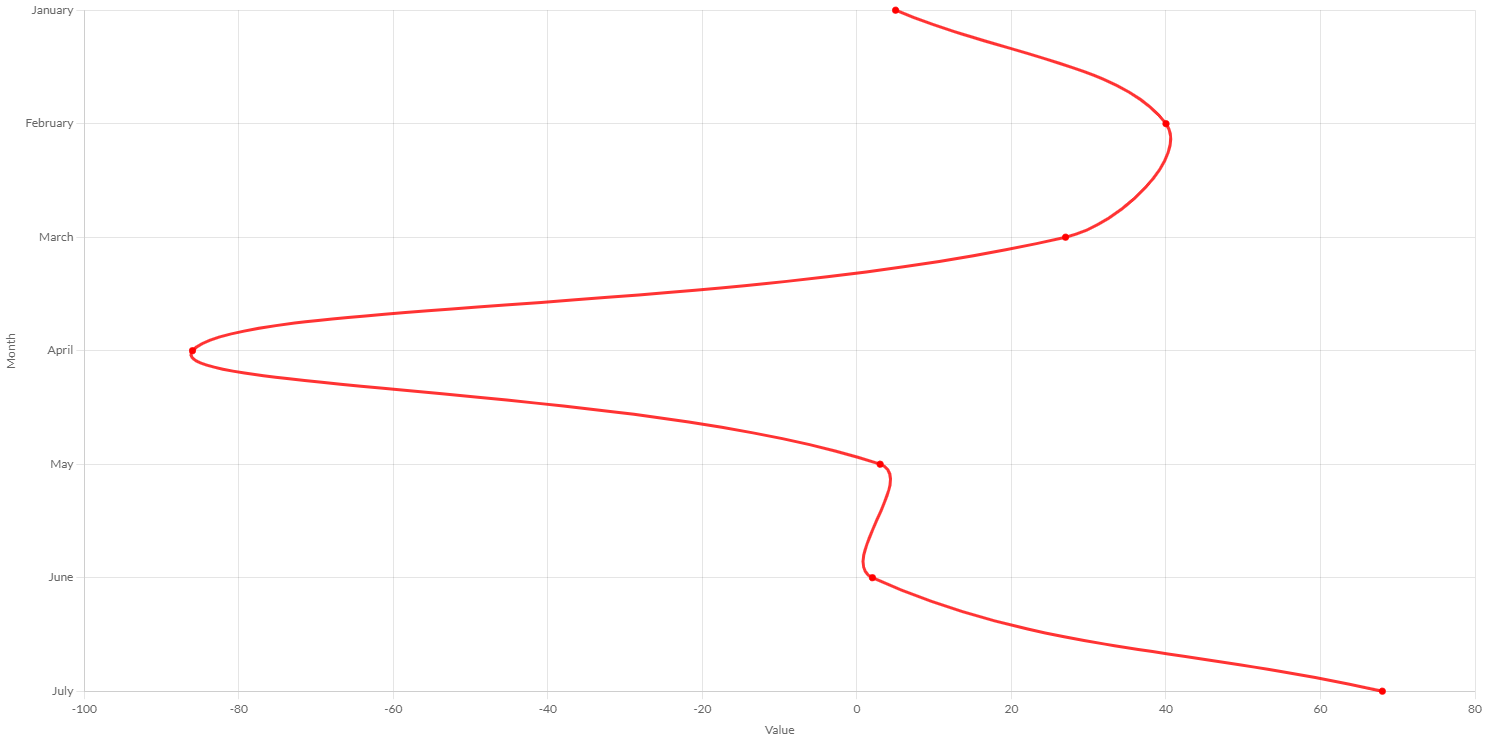 |
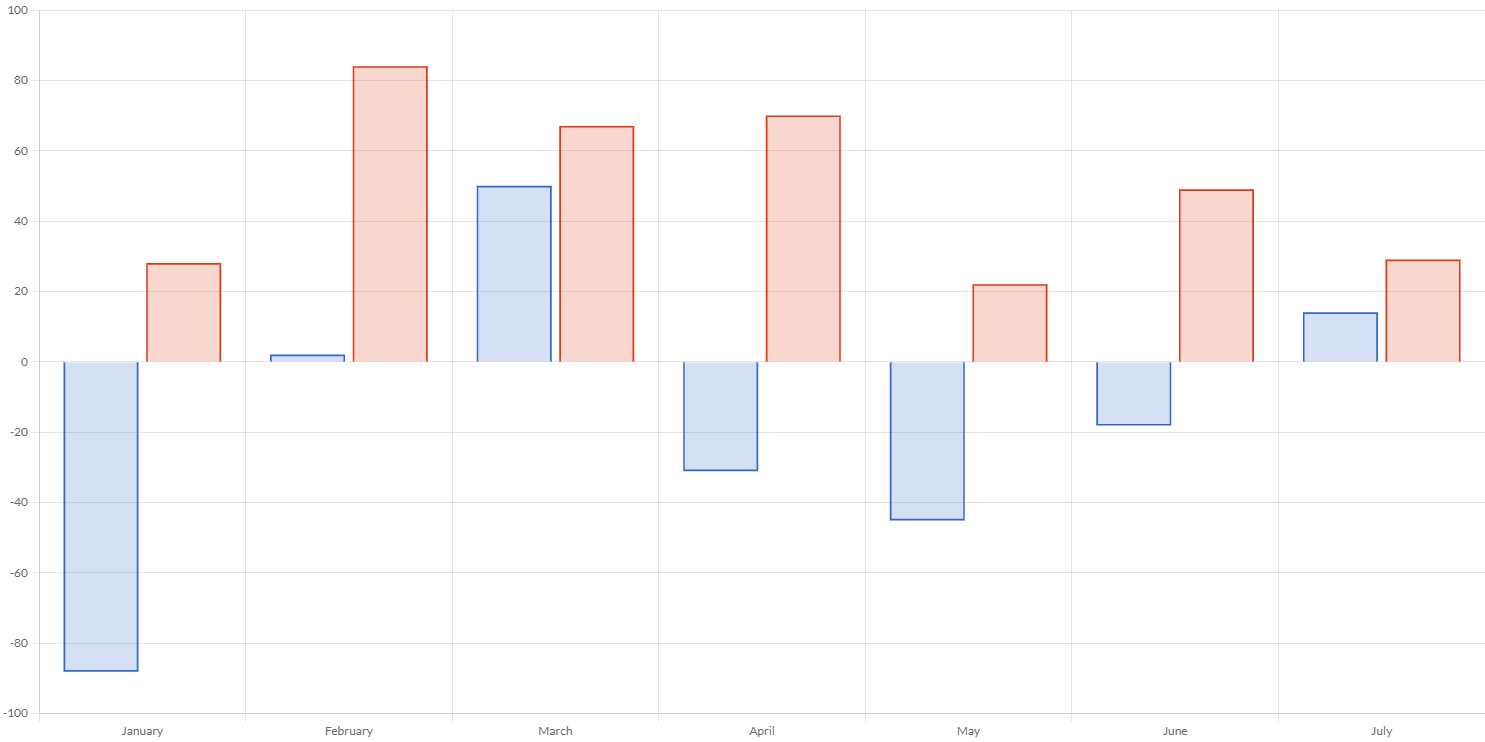
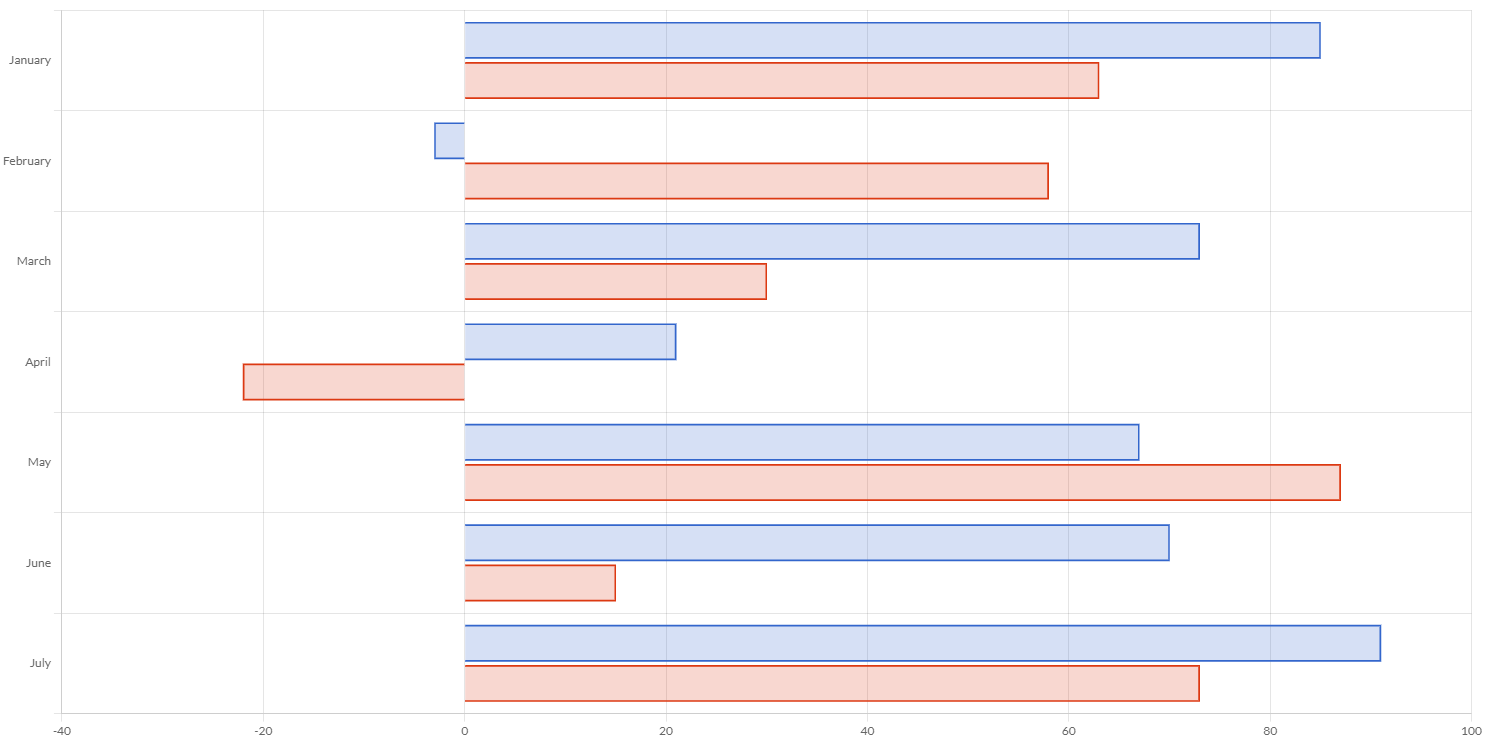
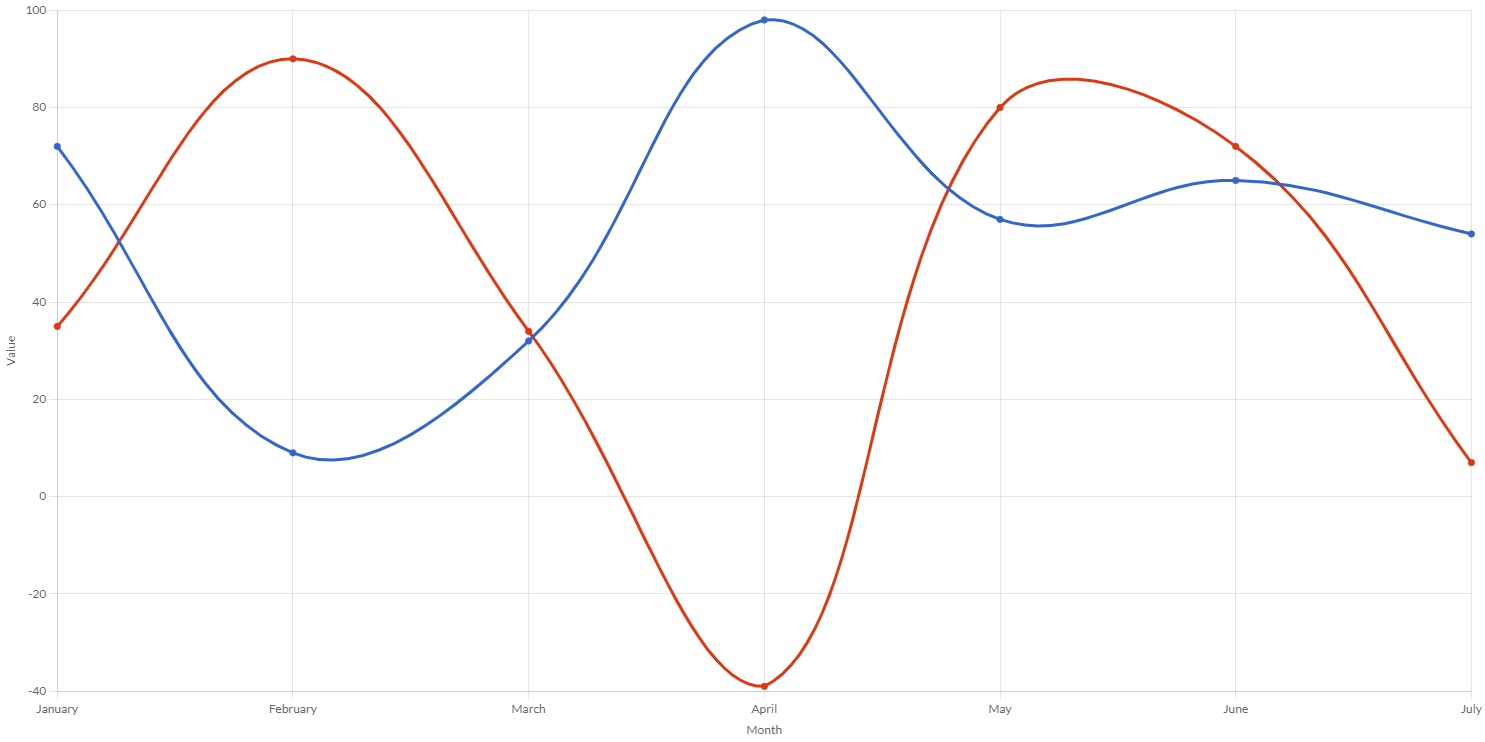
| Bar | Horizontal bar | Line | Vertical line |
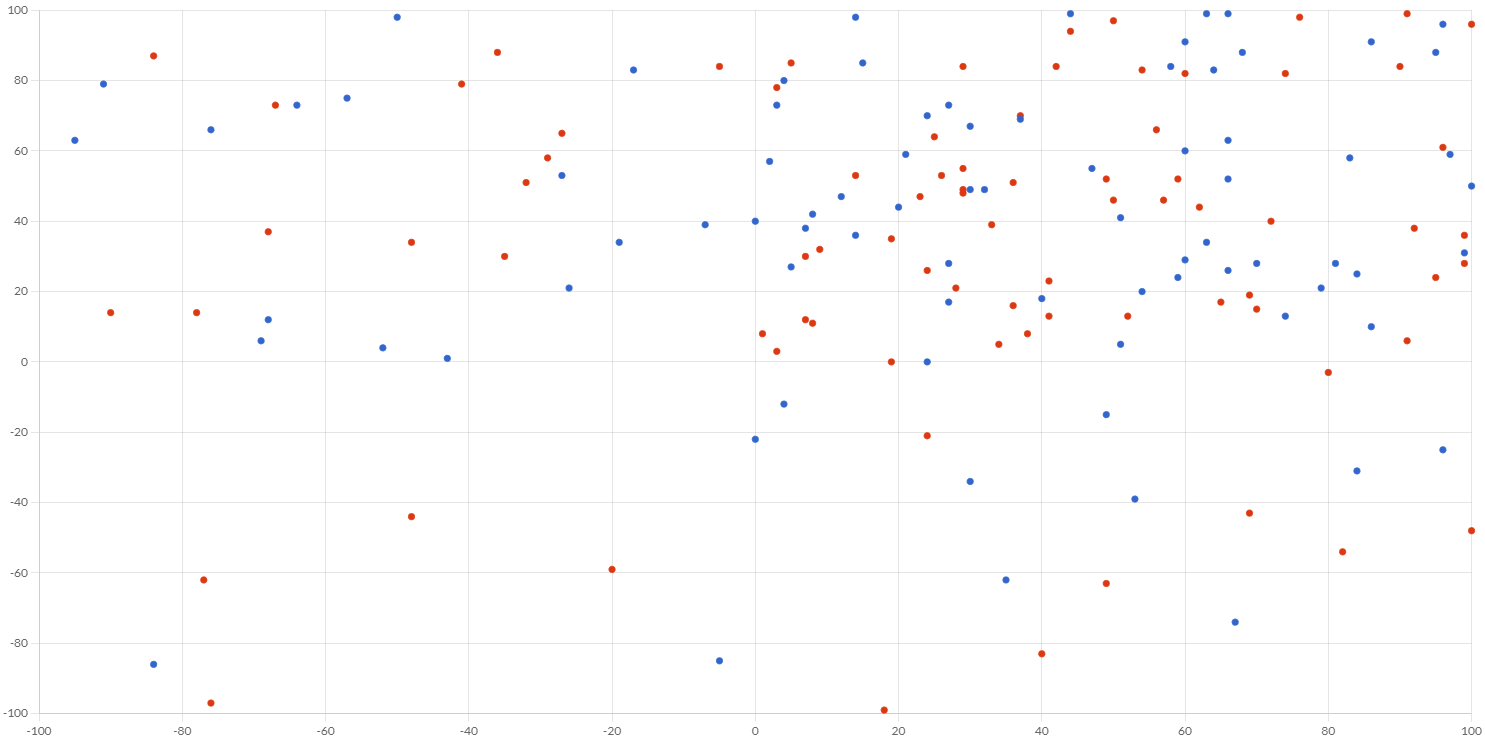 |
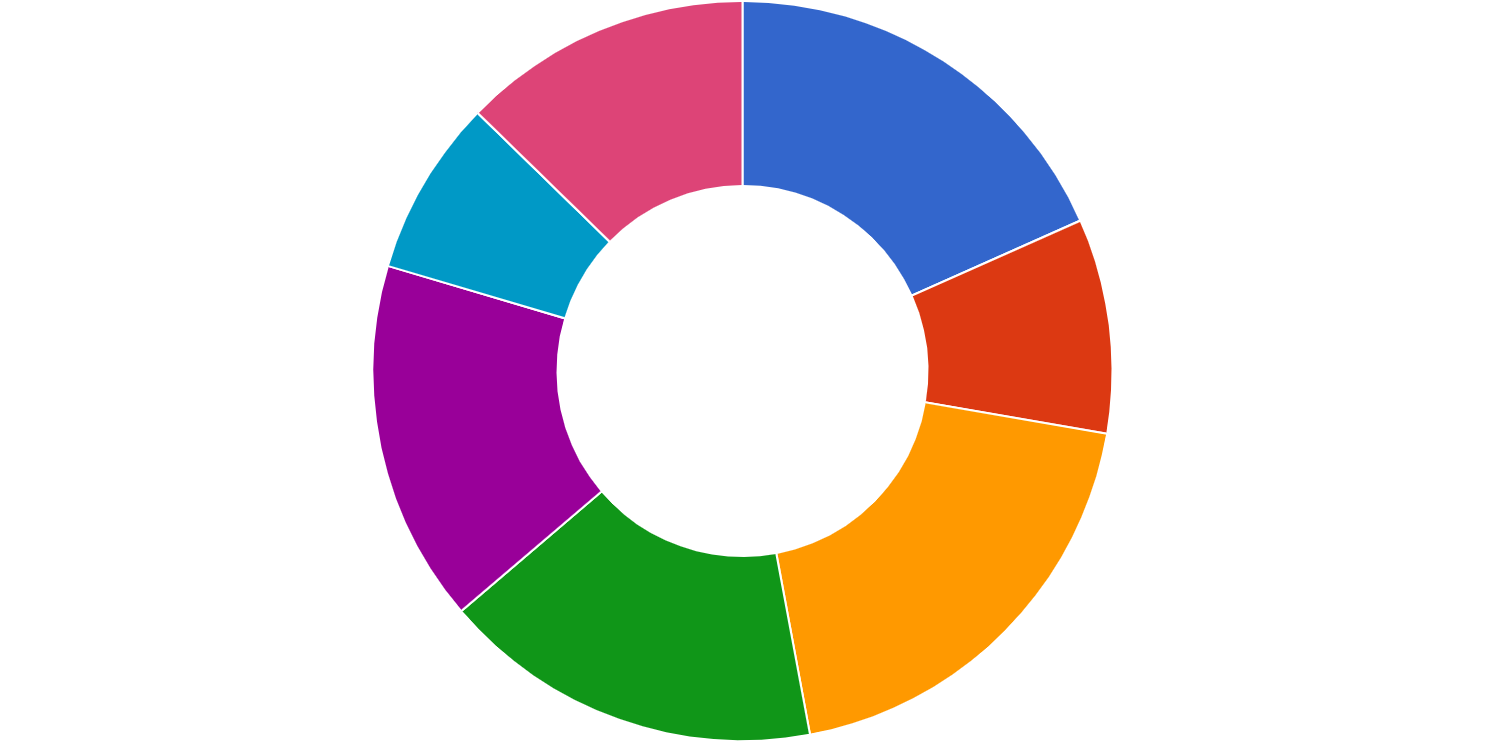 |
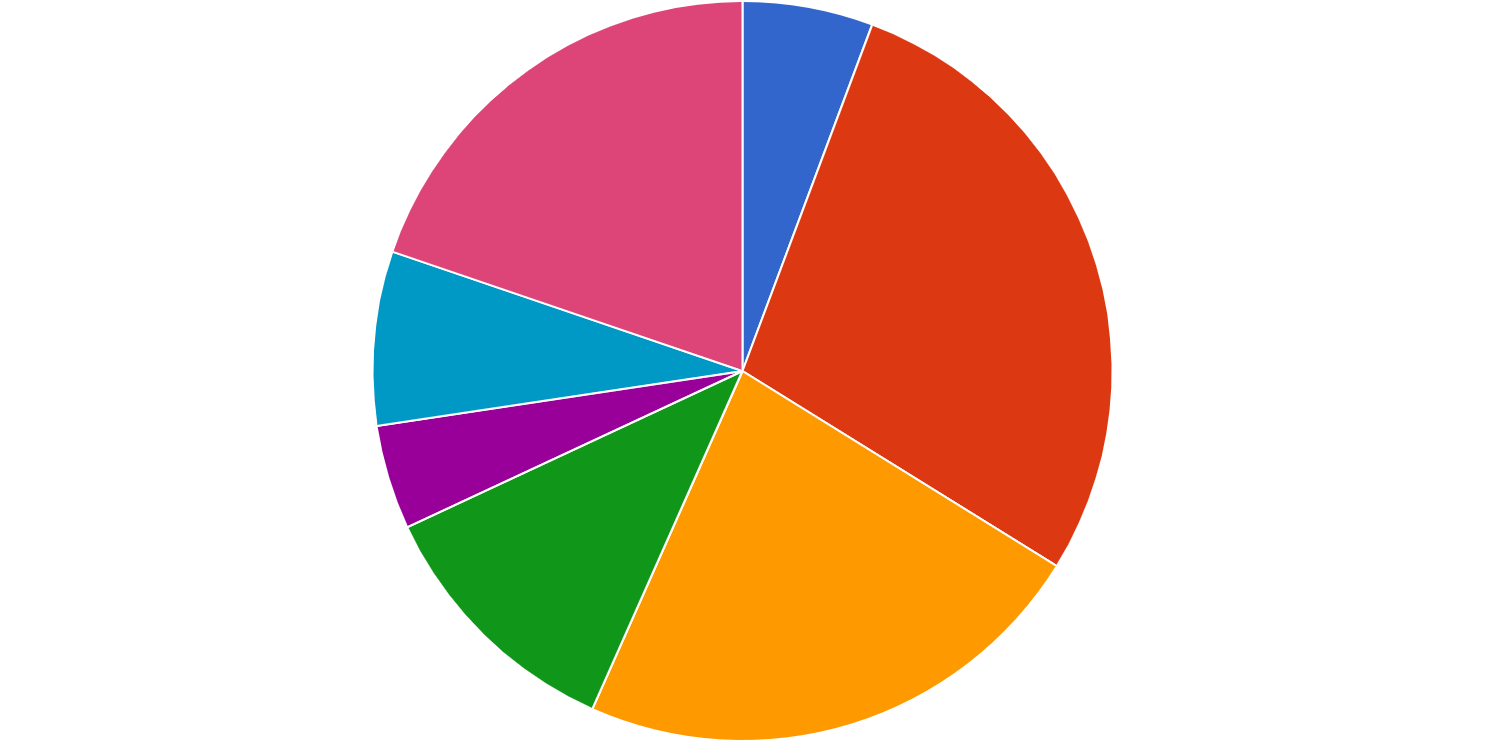 |
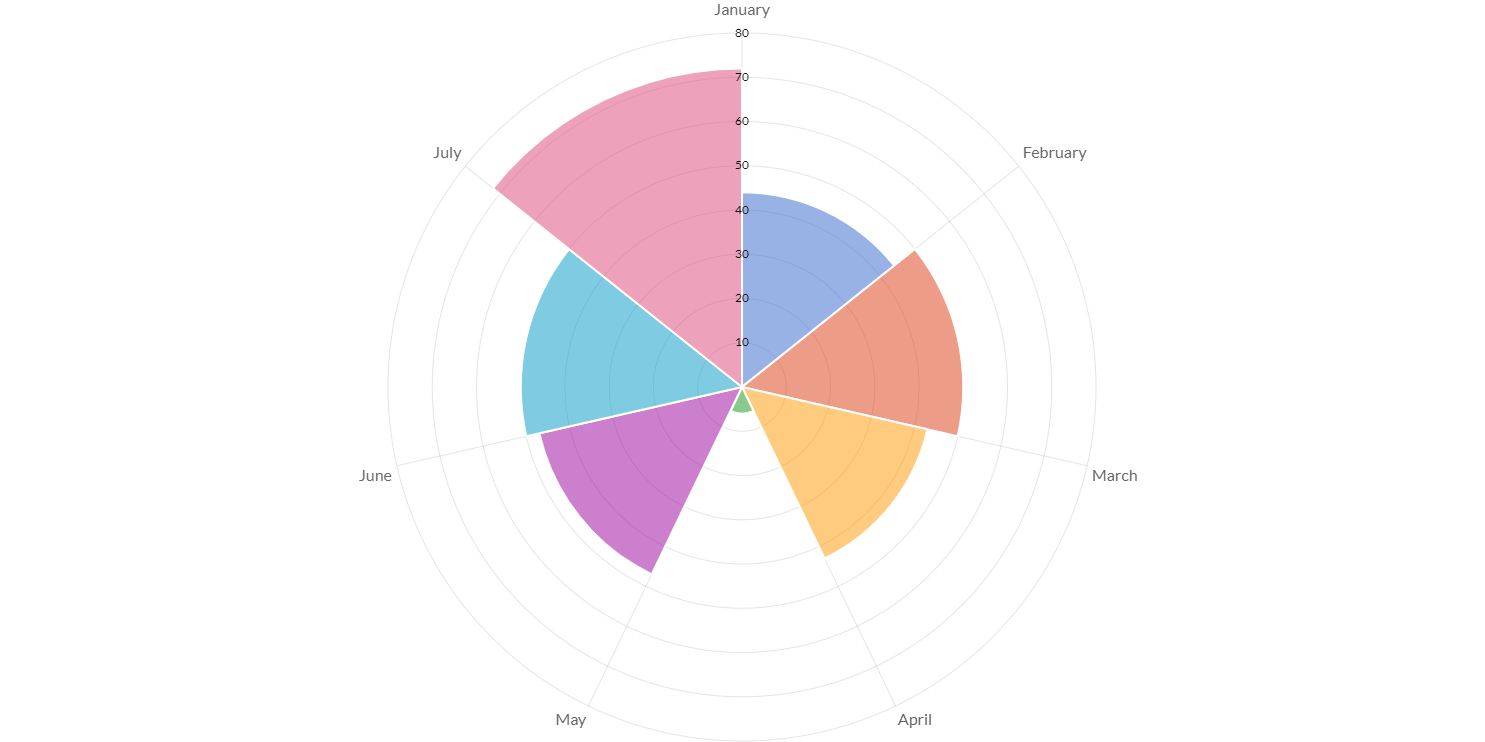 |
| Scatter | Doughnut | Pie | Polar area |
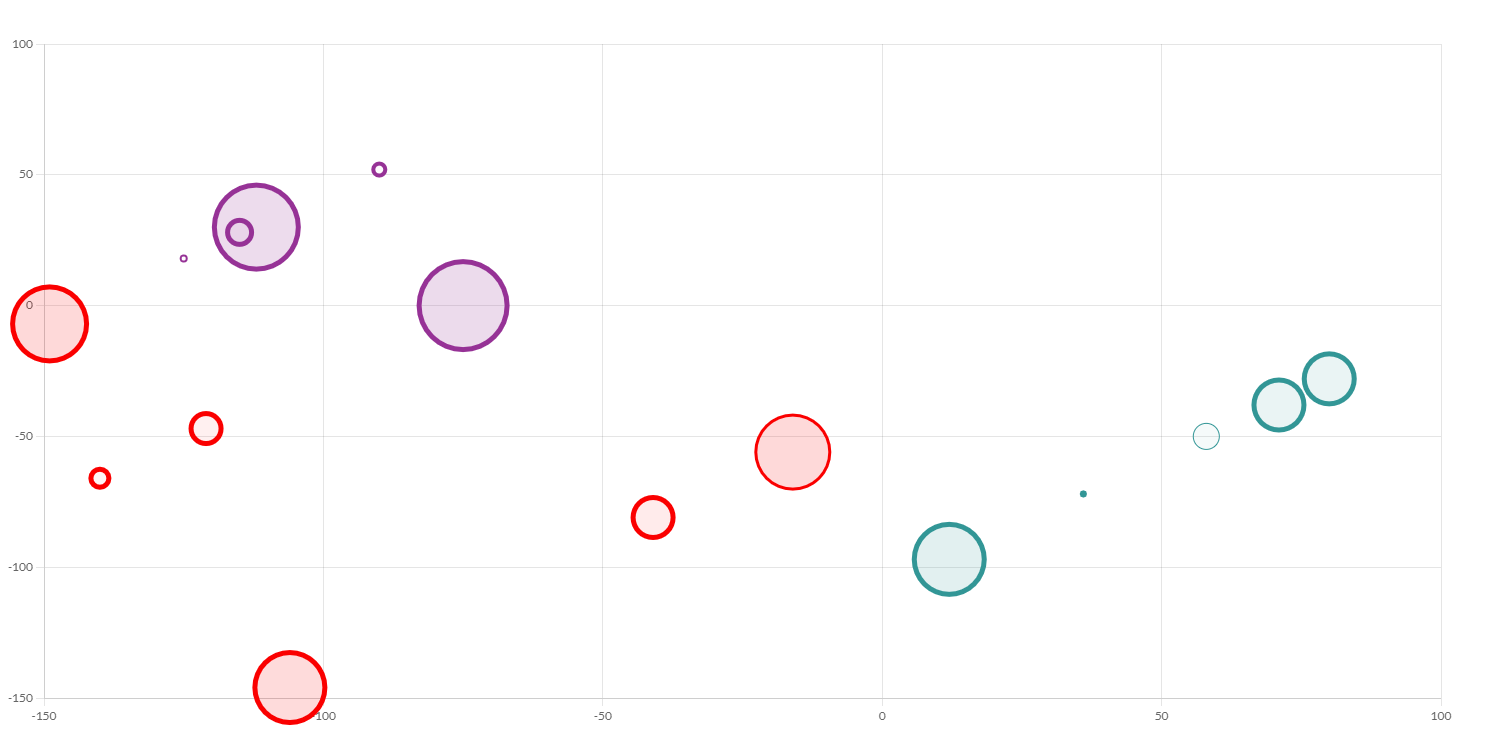
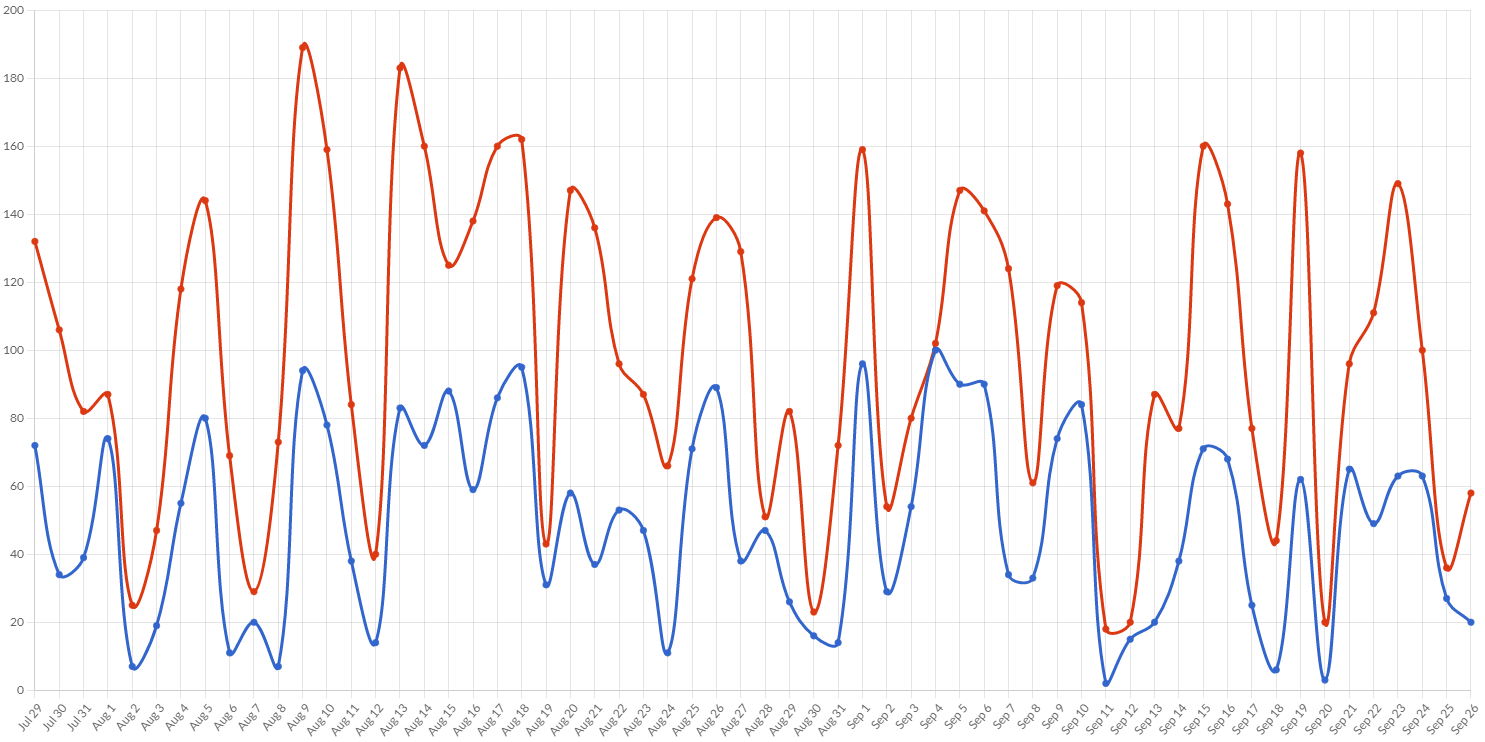
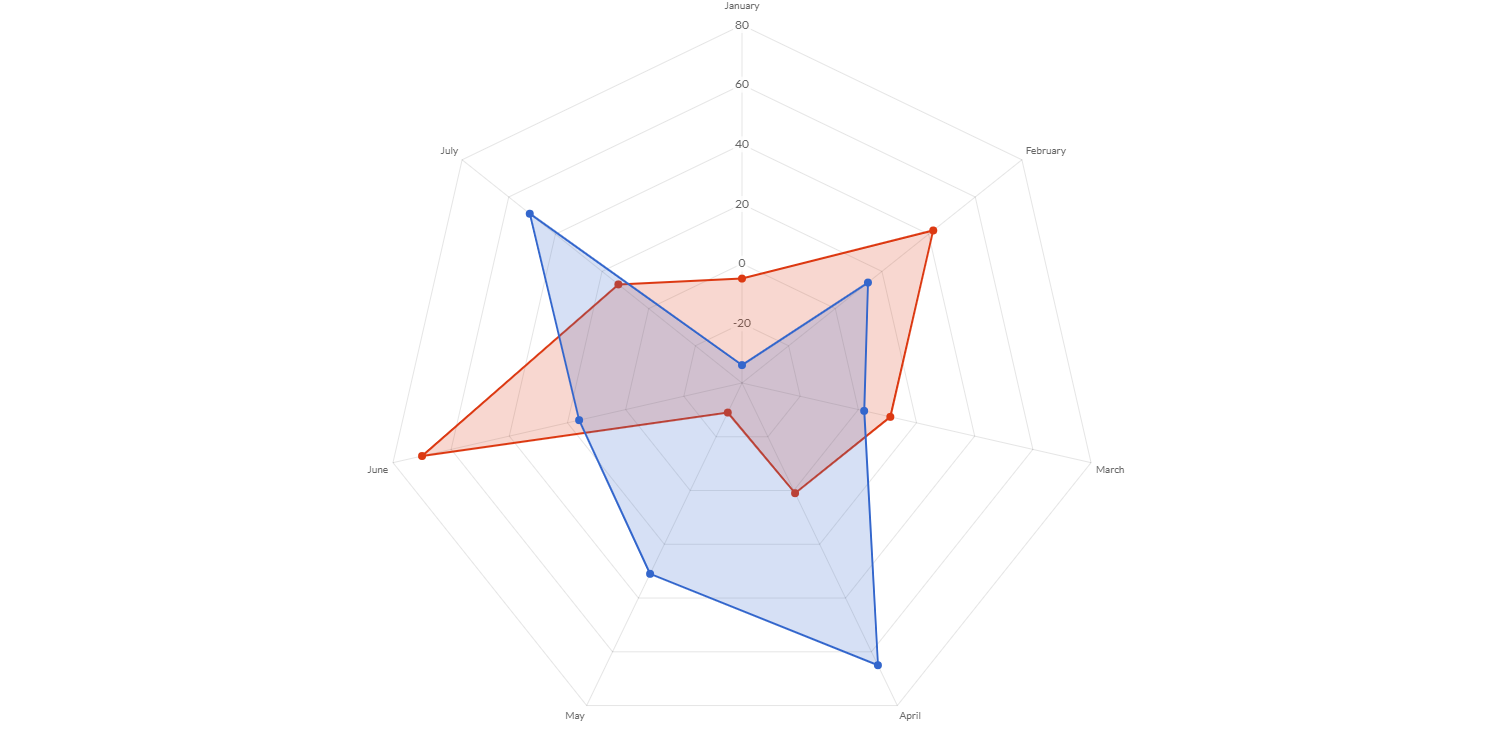 |
 |
 |
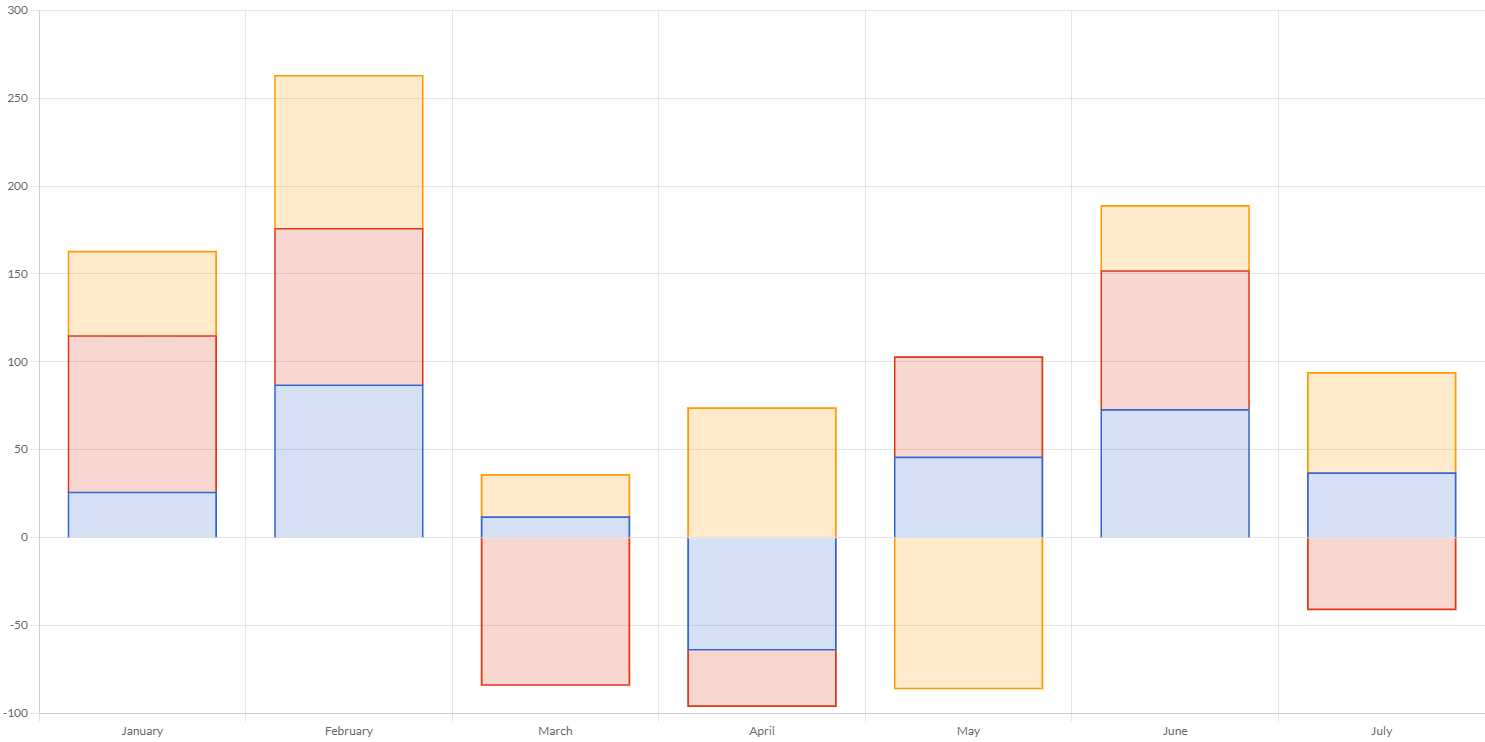 |
| Radar | Bubble | Time series | Stacked |
 |
 |
 |
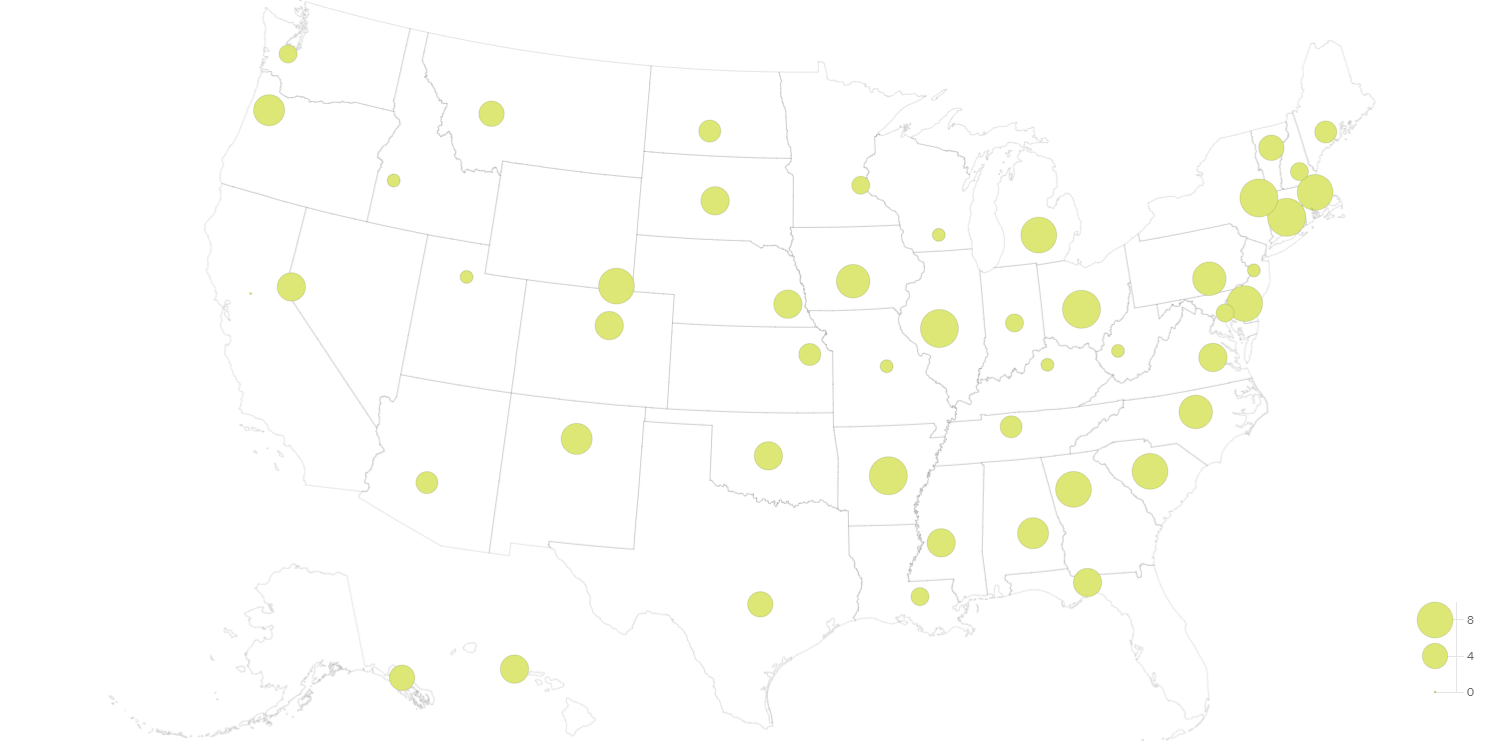 |
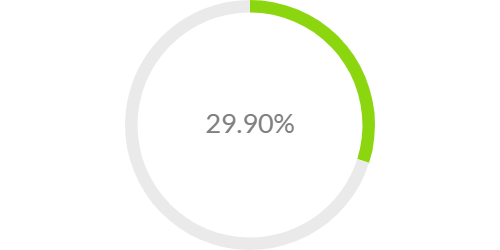
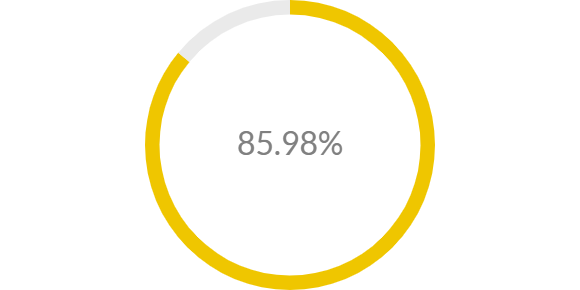
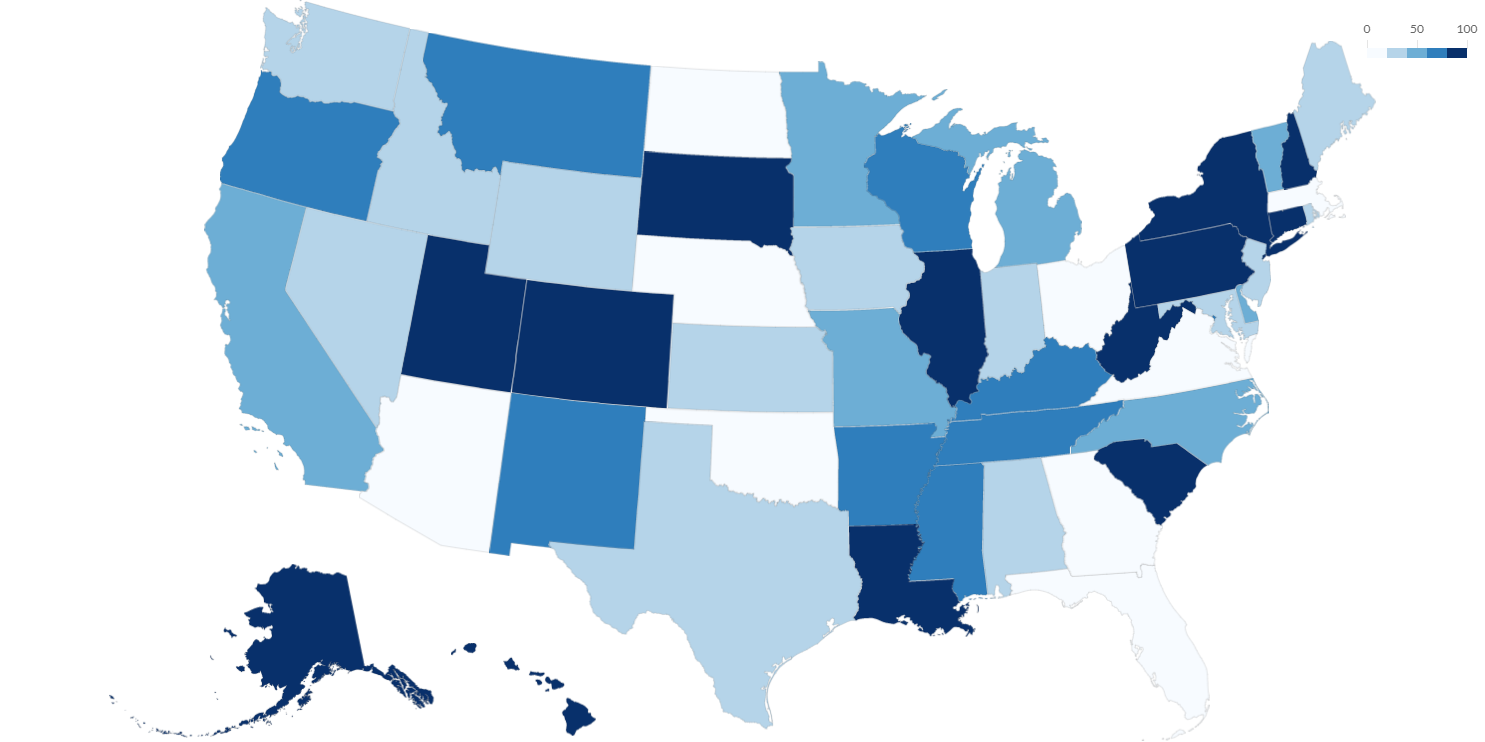
| Meter | Gauge | Choropleth | Bubble map |
 |
 |
 |
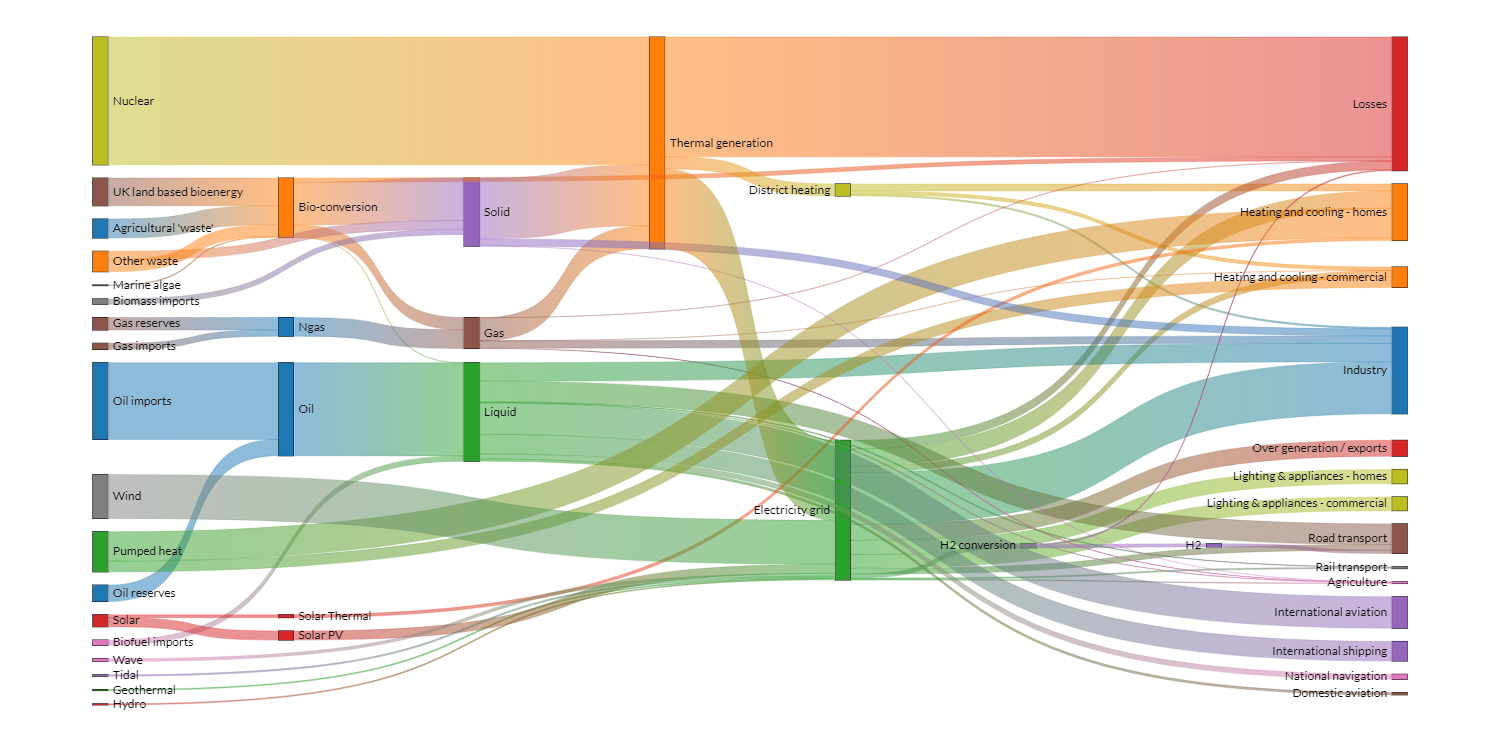 |
| Area | Treemap | Matrix | Sankey |
Documentation
Charba documentation is published here.
All Charba documentation will be maintained in Charba-Wiki project.
API JavaDoc for version 5.0 is published here.
You can also access the previous API JavaDoc, because every version is published to https://pepstock-org.github.io/Charba/[version.release].
The API JavaDoc of the master branch is published here.
Showcase
See Charba showcase on GWT to have a look what you can do with it.
See also Charba showcase GWT source code on GitHub as starting point, if you are going to use on GWT.
See Charba showcase built by J2CL and based on Google Elemental2, to have a look what you can do with it.
See also Charba showcase J2CL source code on GitHub as starting point, if you are going to use on J2CL.
The samples are going to reflect what CHART.JS samples are showing here.
Continuous integration and quality gate
Charba is continuously built at every commit and merge in master by GitHub Action.
At every build, Charba is also checked by Sonar.io in order to have the pulse of its quality.
Going to next release
Here you can find the list of enhancements and updates available on master branch before which will be part of new official release:
Breaking changes
- change
PointStyleCallbackclass, adding context as generic. - remove
xPaddingandyPaddingoptions fromLineLabeloptions. Use padding instead.
Features
- import CHART.JS version v3.6.2.
- import CHART.JS TREEMAP controller version v2.0.1.
- import CHART.JS MATRIX controller version v1.1.1.
- import CHART.JS ANNOTATION plugin version v1.2.1.
- import LUXON library version v2.2.0.
- add
clipproperty to annotation options. - add
pointStyle,rotation,xAdjustandyAdjustproperties toPointAnnotationoptions. - add new
PolygonAnnotationclass in order to draw a polygon. - add new
LabelAnnotationclass in order to draw a content (text, image or canvas) on the chart. - add point positioning by box options for
PointAnnotationclass. - add label options to
BoxAnnotationclass. - enable to set a content by
Canvasinstance toLineLabeloptions. - enable to set the
positionof theLineLabeloptions as percentage of the line dimension.
License
Charba is available under the Apache 2.0 license.


 2.2k Jan 4, 2023
 2.2k Dec 13, 2022
 61 Dec 14, 2022
 73 Dec 1, 2022
 99 Dec 18, 2022
 177 Jan 4, 2023
 97 Nov 9, 2022
 24 Dec 12, 2022
 9.2k Jan 2, 2023
 5.4k Jan 1, 2023
 85 Aug 23, 2022
 377 Dec 25, 2022
 102 Dec 16, 2022
 793 Dec 7, 2022
 473 Dec 15, 2022
 2 Aug 18, 2022
 26 Dec 30, 2022
 4 Jul 27, 2022