TradeX-chart is a trade chart written in plain (vanilla) JavaScript with minimal dependencies

Overview

README

WIP - under heavy development

TradeX-chart is a trade chart written in plain (vanilla) JavaScript with minimal dependencies; use it with any framework or backend.

It provides a two way API to give you complete control over the chart.

Table of Contents

Why

TradeX-chart was created to give you the developer the freedom to choose your framework and not lock you in.

Secondly after talking to other developers, top on their wishlist for a trading chart was more direct control over it, so they could create their own custom plots. The extensive API will give you power over your chart data like you never had before. Subscribe to the internal events messaging to trigger events in your own application.

Getting Started

Requirements

TradeX-chart targets browsers that support ECMAScript 2022.

Demo

npm install
npm run build
npm run serve

Development

npm install
npm run dev

Build

npm install
npm run build

Production

How to use the chart in production... coming soon to a repo near you, once it is added to npmjs.com.

Documentation

Full documentation including API can be found under docs.

Features

  • Plain JavaScript with no framework dependencies
  • WIP: All chart features and functions accessible via API
  • Built in a modular manner
  • Build your own modular plugins
  • Provides message, emit and subscribe methods
  • State object defines chart configuration, on and off chart indicators, drawing tool overlays and can be imported or exported.
  • Chart implements a multi-layer canvas class which makes overlays easy. It also supports interaction through hit detection.
  • Export chart to png, jpg, webp.
  • Indicator calculation provided by talib-web as a WebAssembly module.
  • Supports multiple candle types:
    • solid
    • hollow
    • solid up, hollow down
    • hollow up, solid down
    • OHLC
    • TODO: area
  • Chart pan / scroll via mouse or cursor keys
You might also like...

TChart.js - simple and configurable Bar and Line Chart library in Javascript

TChart.js - simple and configurable Bar and Line Chart library in Javascript

TChart.js Simple and configurable Bar and Line Chart library in Javascript Description TChart.js is a canvas-based simple Javascript Bar and Line Char

Mar 3, 2021

Java library for use with Chart.js javascript library

Chart.java Chart.java enables integration with the excellent Chart.js library from within a Java application. Usage example In Java: BarDataset datase

Dec 16, 2022

Barcode generation library written in JavaScript that works in both the browser and on Node.js

Introduction JsBarcode is a barcode generator written in JavaScript. It supports multiple barcode formats and works in browsers and with Node.js. It h

Dec 30, 2022

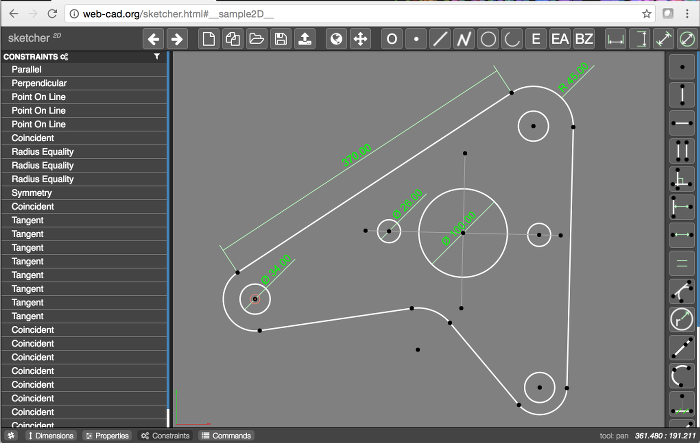
JS.Sketcher is a parametric 2D and 3D CAD modeler written in pure javascript

JS.Sketcher is a parametric 2D and 3D CAD modeler written in pure javascript

JS.Sketcher JS.Sketcher is a parametric 2D and 3D CAD modeler written in pure javascript YouTube Tutorial Video Live Sample Demo 2D Sketcher Help Docs

Jan 3, 2023

Redefined chart library built with React and D3

Recharts Introduction Recharts is a Redefined chart library built with React and D3. The main purpose of this library is to help you to write charts i

Jan 2, 2023

:bar_chart: A D3-based reusable chart library

c3 c3 is a D3-based reusable chart library that enables deeper integration of charts into web applications. Follow the link for more information: http

Jan 2, 2023

๐Ÿž๐Ÿ“Š Beautiful chart for data visualization.

๐Ÿž๐Ÿ“Š  Beautiful chart for data visualization.

๐Ÿž ๐Ÿ“ˆ Spread your data on TOAST UI Chart. TOAST UI Chart is Beautiful Statistical Data Visualization library. ๐Ÿ“ฆ Packages The functionality of TOAST U

Jan 2, 2023

:bar_chart: A library of modular chart components built on D3

Plottable Plottable is a library of chart components for creating flexible, custom charts for websites. It is built on top of D3.js and provides highe

Dec 31, 2022

Chart image and QR code web API

Chart image and QR code web API

QuickChart QuickChart is a service that generates images of charts from a URL. Because these charts are simple images, they are very easy to embed in

Dec 25, 2022
Comments
Owner
null
A simple and minimal, ultra-lightweight vanilla JS framework with 0 deps.

piss.js A simple and minimal, ultra-lightweight vanilla JS framework with 0 deps, containing one function, piss. This function has the background colo

grian 15 Oct 21, 2022
A Simple Dashboard Chart in Laravel Nova using Chart JS

A Simple Dashboard Chart in Laravel Nova using Chart JS. Starting create your own dashboard with Chart JS Integration can save your time and help you maintain consistency across standard elements such as Bar, Stacked, Line, Area, Doughnut and Pie Chart.

Kuncoro Wicaksono 177 Jan 4, 2023
Chart.js plugin to defer initial chart updates

Chart.js plugin to defer initial chart updates until the user scrolls and the canvas appears inside the viewport, and thus trigger the initial chart a

Chart.js 97 Nov 9, 2022
Bar Funnel Chart extension for Chart.js

Chart.BarFunnel.js Provides a Bar Funnel Chart for use with Chart.js Documentation To create a Bar Funnel Chart, include Chart.BarFunnel.js after Char

Chart.js 58 Nov 24, 2022
IBM Gantt Chart Component, integrable in Vanilla, jQuery, or React Framework.

@ibm/gantt-chart IBM Gantt Chart Component, integrable in Vanilla, jQuery, or React Framework. Getting started Documentation and Examples are availabl

International Business Machines 169 Dec 20, 2022
HTML5 Canvas Gauge. Tiny implementation of highly configurable gauge using pure JavaScript and HTML5 canvas. No dependencies. Suitable for IoT devices because of minimum code base.

HTML Canvas Gauges v2.1 Installation Documentation Add-Ons Special Thanks License This is tiny implementation of highly configurable gauge using pure

Mykhailo Stadnyk 1.5k Dec 30, 2022
Simple, responsive, modern SVG Charts with zero dependencies

Frappe Charts GitHub-inspired modern, intuitive and responsive charts with zero dependencies Explore Demos ยป Edit at CodePen ยป Contents Installation U

Frappe 14.6k Jan 4, 2023
Minimalistic, animated SVG gauge. Zero dependencies

SVG Gauge Minmalistic, configurable, animated SVG gauge. Zero dependencies Buy me a coffee โ˜• If you like my work please consider making a small donati

Aniket Naik 264 Dec 17, 2022
GPL version of Javascript Gantt Chart

dhtmlxGantt Getting started | Features | Follow us | License | Useful links dhtmlxGantt is an open source JavaScript Gantt chart that helps you illust

null 952 Dec 29, 2022
:bar_chart: Re-usable, easy interface JavaScript chart library based on D3.js

billboard.js is a re-usable, easy interface JavaScript chart library, based on D3 v4+. The name "billboard" comes from the famous billboard chart whic

NAVER 5.4k Jan 1, 2023