🍞📊 Beautiful chart for data visualization.

Overview

Toast UI Chart

🍞 📈 Spread your data on TOAST UI Chart. TOAST UI Chart is Beautiful Statistical Data Visualization library.

GitHub release npm GitHub license PRs welcome code with hearth by NHN lerna

📦 Packages

The functionality of TOAST UI Chart is available when using the Plain JavaScript, React, Vue Component.

📙 Documents

😍 Why TOAST UI Chart?

Simple, Easy to Use, And It's Beautiful!

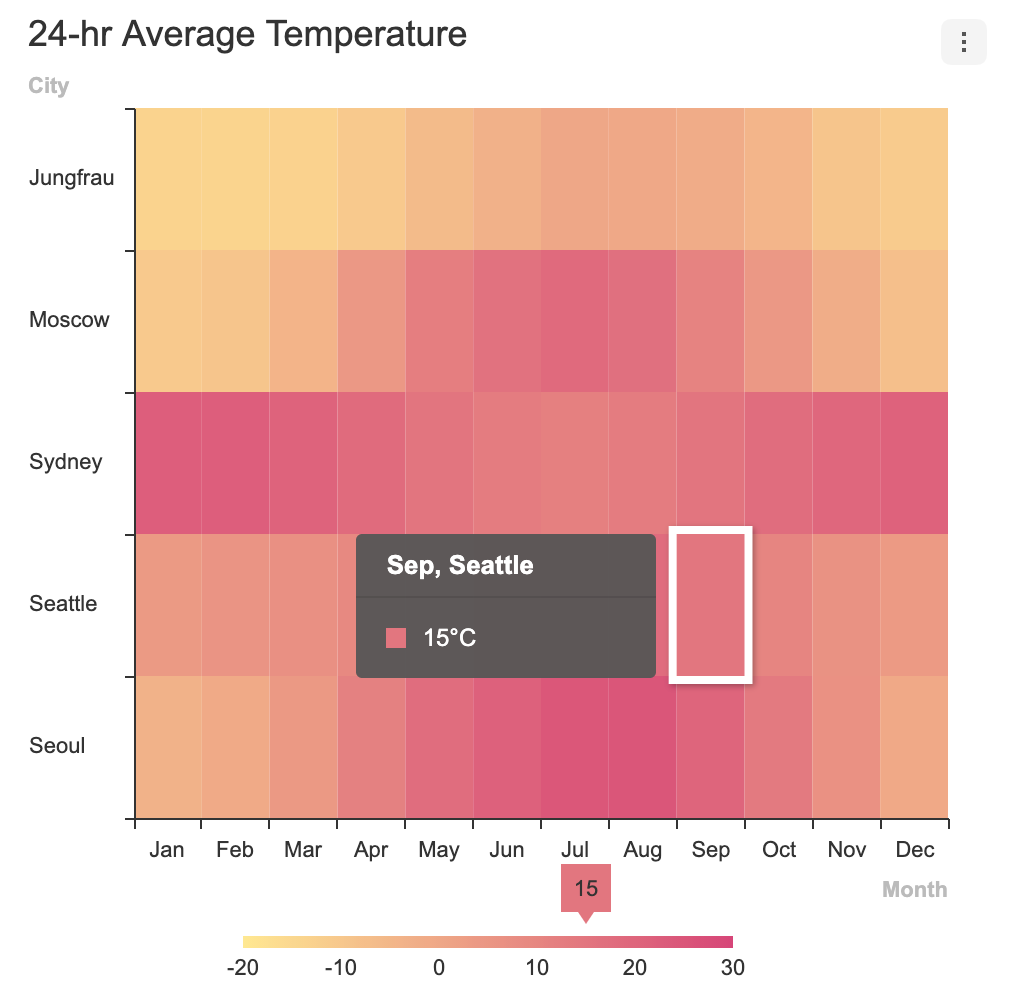
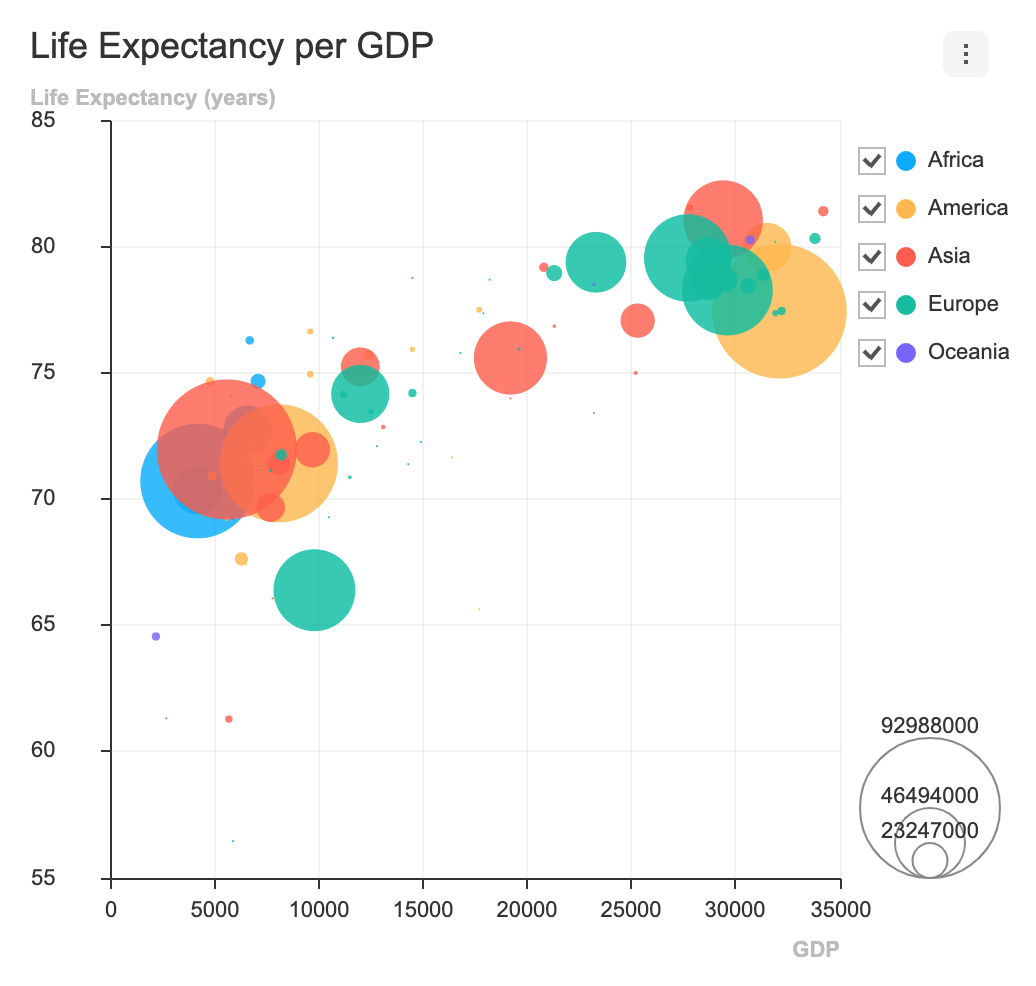
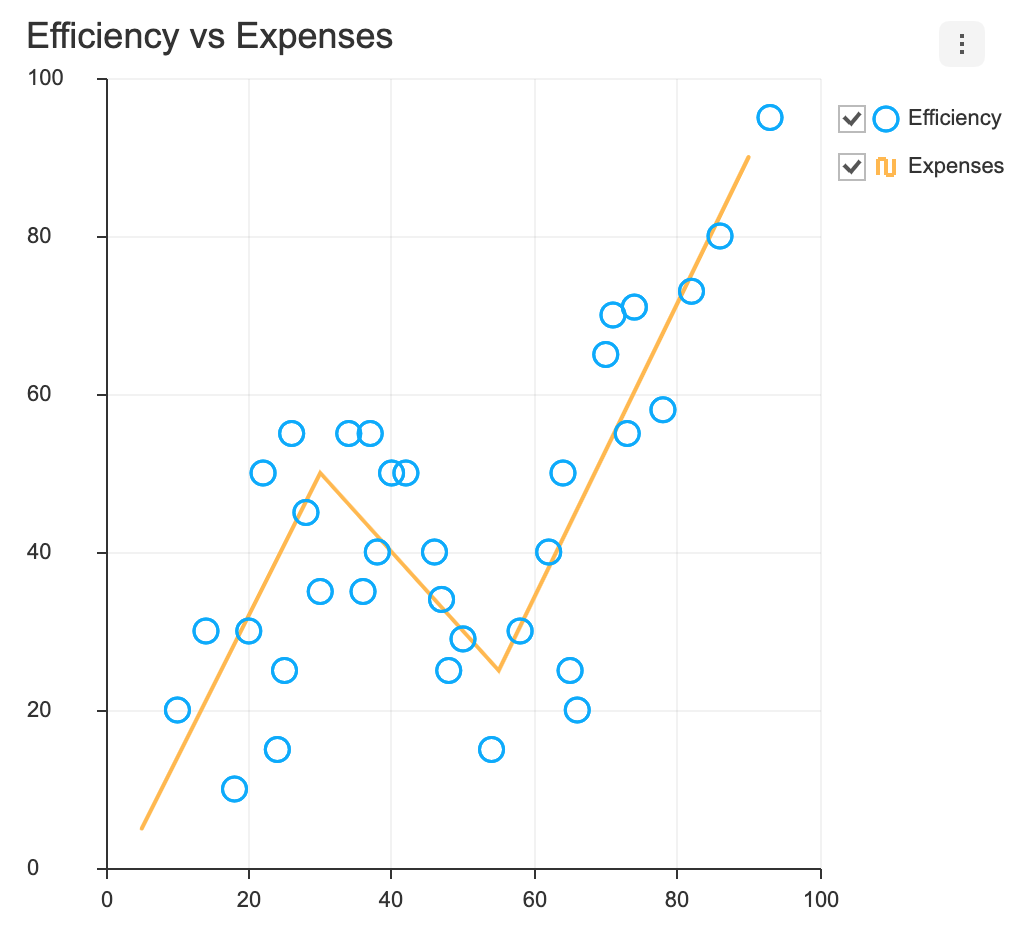
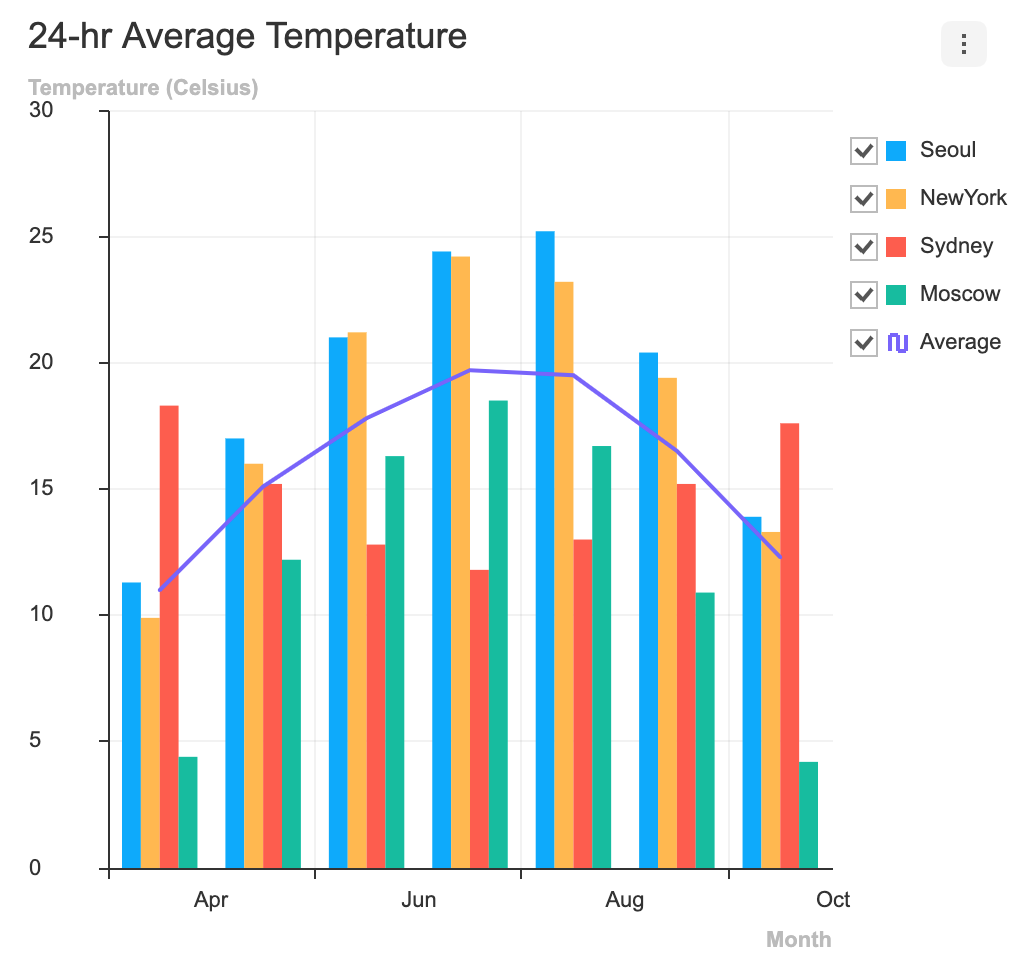
TOAST UI Chart makes your data pop and presents it in a manner that is easy to understand. Furthermore, it provides a wide range of theme options for customizing the charts to be suitable for all of your services. Chart components like the title, axes, legends, tooltips, plots, series, and more can be customized through the options.

image

Variety of powerful features!

Responsive

Add different options and animations according to the charts' sizes by using the responsive option.

responsive

Zoomable

Make the data presented in the Line, Area, and Treemap Charts zoomable with the zoomable option.

zoomable

Live Update

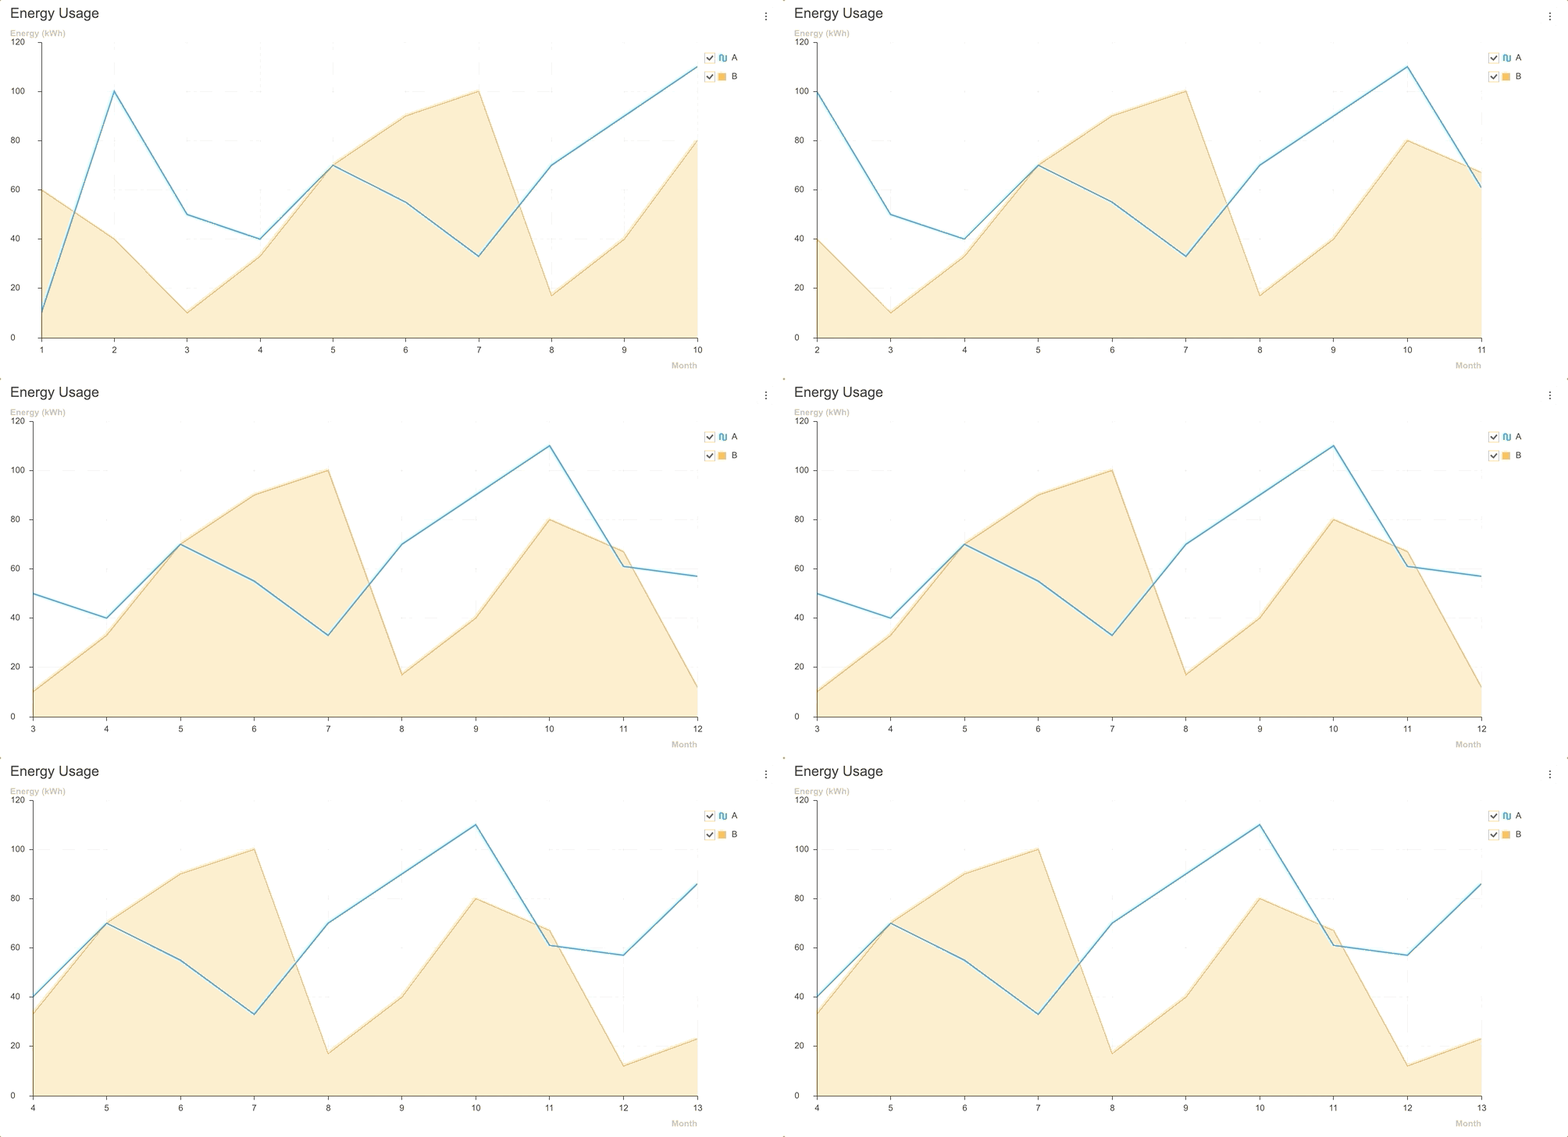
View and manage new data as they are added realtime with the addData API and the options.series.shift option.

Area Line Heatmap
area live update line heatmap
LineArea Column ColumnLine
lineArea column columnline

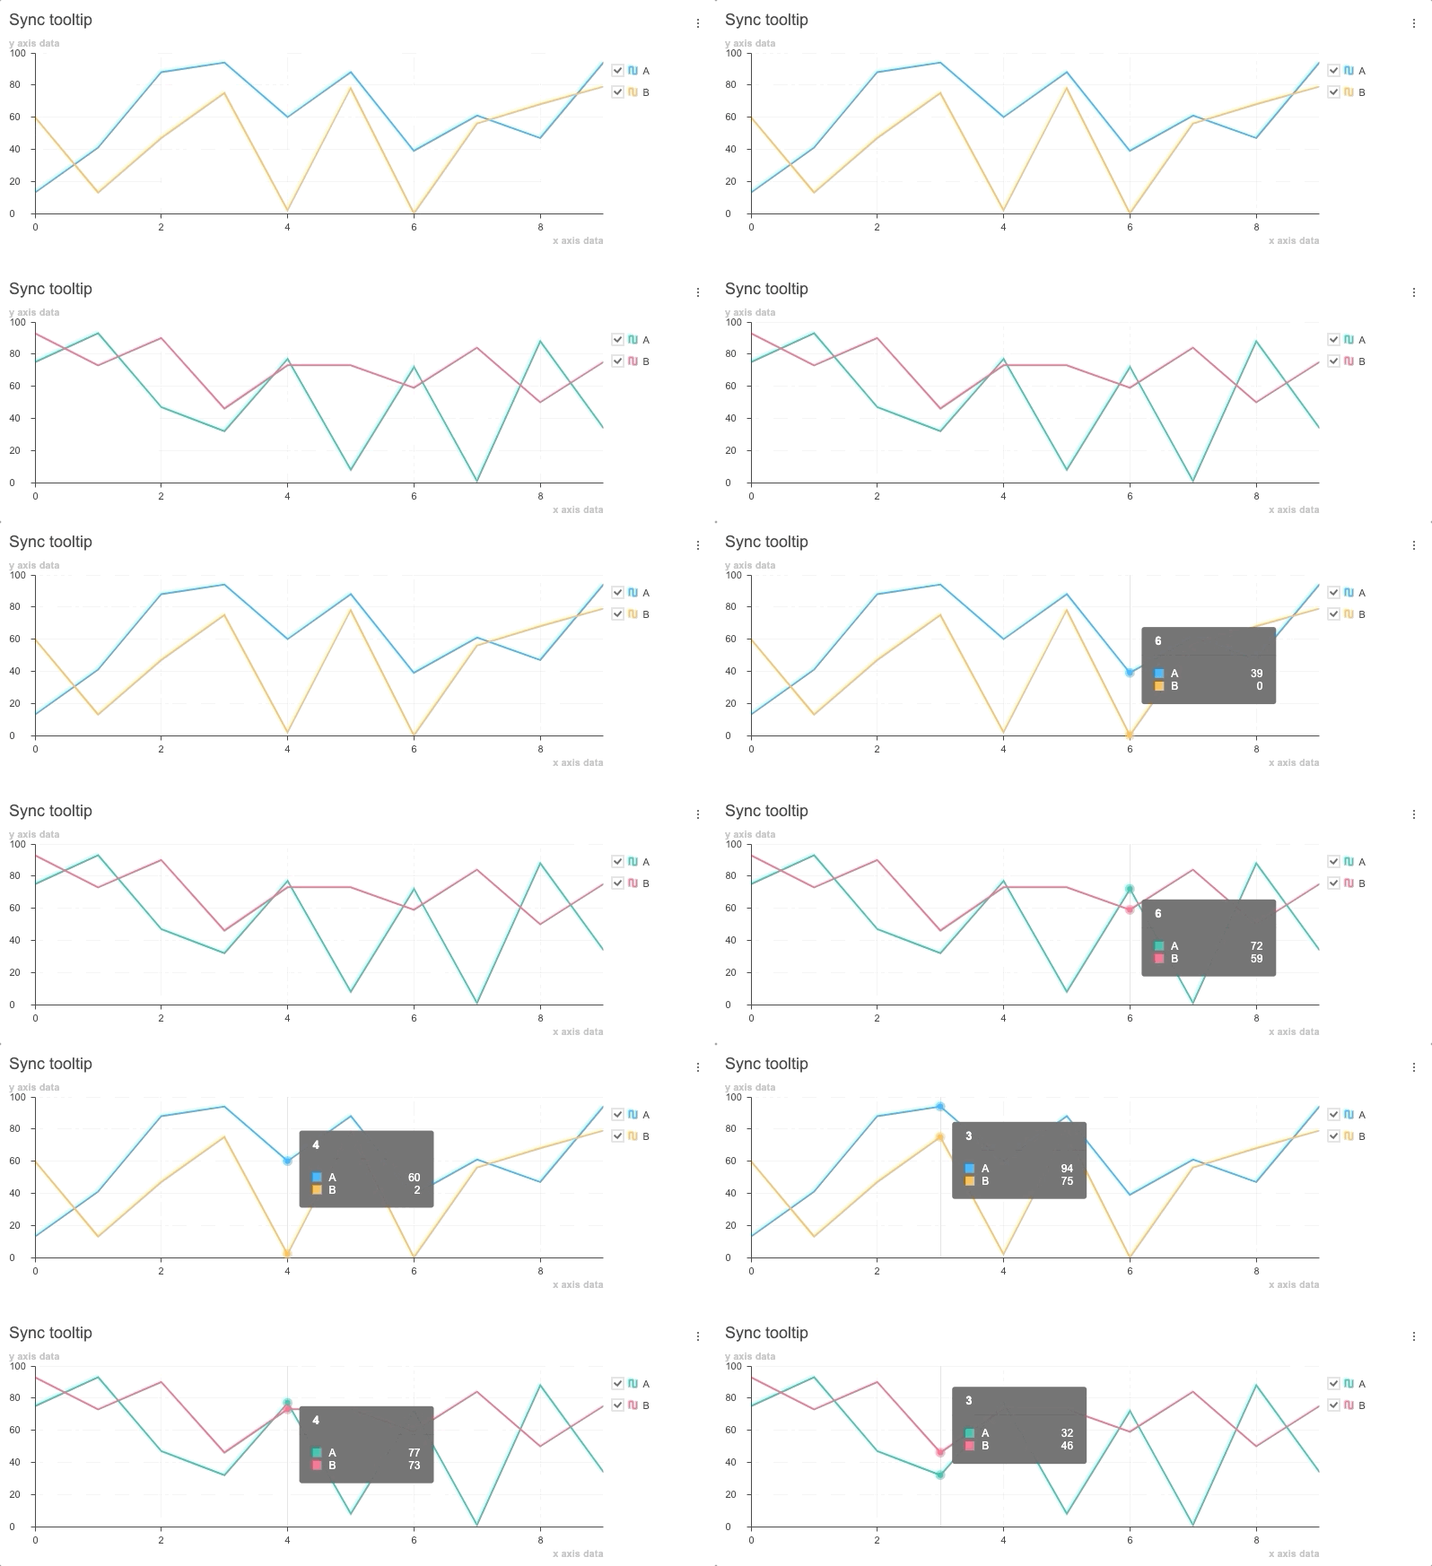
Synchronize Tooltip

Use and synchronize the tooltip features at the moment the cursor hovers over the chart with the showTooltip API and the on custom event.

synctooltip

🎨 Features

Charts

The TOAST UI Chart provides many types of charts to visualize the various forms of data.

Area Line Bar Column
area chart line chart bar chart column chart
Bullet BoxPlot Treemap Heatmap
bullet chart boxplot chart treemap chart heatmap chart
Scatter Bubble Radar Pie
scatter chart bubble chart radar chart pie chart
LineArea LineScatter ColumnLine NestedPie
lineArea chart lineScatter chart columnLine chart nestedPie chart
RadialBar
radialBar chart coming soon coming soon next

In addition, a variety of powerful features can be found on the demo page below. 👇 👇 👇

🐾 Examples

Here are more examples and play with TOAST UI Chart!

🔧 Pull Request Steps

TOAST UI products are open source, so you can create a pull request(PR) after you fix issues. Run npm scripts and develop yourself with the following process.

Setup

Fork main branch into your personal repository. Clone it to local computer. Install node modules. Before starting development, you should check to have any errors.

$ git clone https://github.com/{your-personal-repo}/tui.chart.git
$ npm install
$ cd apps/chart
$ npm install
$ npm run test

Develop

Let's start development! You can develop UI through webpack-dev-server or storybook, and you can write tests through Jest. Don't miss adding test cases and then make green rights.

Run webpack-dev-server

$ npm run serve

Run storybook

$ npm run storybook

Run test

$ npm run test

Pull Request

Before PR, check to test lastly and then check any errors. If it has no error, commit and then push it!

For more information on PR's step, please see links of Contributing section.

💬 Contributing

🌏 Browser Support

Chrome Chrome IE Internet Explorer Edge Edge Safari Safari Firefox Firefox
Yes 10+ Yes Yes Yes

🍞 TOAST UI Family

🚀 Used By

📜 License

This software is licensed under the MIT © NHN.

Comments
  • Cross-Site Scripting vulnerability in the chart legend fields

    Cross-Site Scripting vulnerability in the chart legend fields

    Describe the bug Cross-Site Scripting (XSS) attacks are a type of injection, in which malicious scripts are injected into otherwise benign and trusted websites. XSS attacks occur when an attacker uses a web application to send malicious code, generally in the form of a browser side script, to a different end user. Flaws that allow these attacks to succeed are quite widespread and occur anywhere a web application uses input from a user within the output it generates without validating or encoding it.

    To Reproduce

    1. Run the following html file in any browser
    <html>
    <head>
          <title>tui-chart</title>
    </head>   
    <body>
         
          <link rel="stylesheet" href="https://uicdn.toast.com/chart/latest/toastui-chart.min.css" />
          <script src="https://uicdn.toast.com/chart/latest/toastui-chart.min.js"></script>
          <div id="chart-area"></div>
          <script type="text/javascript">   
            const el = document.getElementById('chart-area');
          const data = {
            categories: ['Browser'],
            series: [
              {
                name: 'Chrome"<img src=x onerror=alert(1)>',
                data: 46.02,
              },
              {
                name: 'IE',
                data: 20.47,
              },
              {
                name: 'Firefox',
                data: 17.71,
              },
              {
                name: 'Safari',
                data: 5.45,
              },
              {
                name: 'Opera',
                data: 3.1,
              },
              {
                name: 'Etc',
                data: 7.25,
              },
            ],
          };
          const options = {
            chart: { title: 'Usage share of web browsers', width: 600, height: 400 },
          };
    
          const chart = toastui.Chart.pieChart({ el, data, options });
        </script>
    </body>
    </html>
    
    1. JavaScript alert will pop-up.

    Vulnerability fix I've fixed the vulnerability by sanitizing dangerous legend inputs just before rendering. Please refer to the PR here https://github.com/418sec/tui.chart/pull/1

    opened by arjunshibu 15
  • Cannot see exportMenu

    Cannot see exportMenu

    Hi. I'm using @toast-ui/vue-chart 4.0.4 on a vue project. After I updated to version 4.0.4,, I can't see the export menu. I can see the button, but It doesn't appear when I click it. It was okay before I update. It was v1.1.2 before

    I guess it could be z-index problem, but I don't know how to solve it. Please help me. export

    Type: Bug Priority: High 
    opened by Han-Jiho 14
  • Incorrect Typescript type Definitions

    Incorrect Typescript type Definitions

    Describe the bug I tried to use this project with scala-js and used the Typescript to Scala-js converter to creat Scala bindings. Unfortunately that process Fails.

    see: https://github.com/ScalablyTyped/Converter/issues/249

    The Reply that i got over there ist that somehow the included Typescript type definitions in this project are not Standards conform. As I am no Typescript expert i cannot give more Information on this aspect. But it seems as the parameters to create the charts cannot be set. Maybe you can fix that issue in one of the next releases. Greetings Gerald Mixa

    A clear and concise description of what you expected to happen.

    Expected: A usable Type Definition in ScalaJS Setup Description: see referenced bug

    Priority: High 
    opened by gmixa 13
  • Security fix for Cross-Site Scripting Vulnerability in the legend fields

    Security fix for Cross-Site Scripting Vulnerability in the legend fields

    Fix for Cross-site Scripting vulnerability

    Resolves the bug mentioned in #601 completely without affecting any functionality

    Please check if the PR fulfills these requirements

    • [x] It's submitted to right branch according to our branching model
    • [x] It's right issue type on title
    • [x] When resolving a specific issue, it's referenced in the PR's title (e.g. fix #xxx[,#xxx], where "xxx" is the issue number)
    • [x] The commit message follows our guidelines
    • [x] Tests for the changes have been added (for bug fixes/features)
    • [x] Docs have been added/updated (for bug fixes/features)
    • [x] It does not introduce a breaking change or has description for the breaking change

    Description

    Fully described here https://github.com/418sec/tui.chart/pull/2

    Please do not merge this commit directly as I said here https://github.com/nhn/tui.chart/issues/601#issuecomment-786454161 Once you are happy with the fix, please comment here https://github.com/418sec/tui.chart/pull/2 🚀. Thanks in advance 😄


    Thank you for your contribution to TOAST UI product. 🎉 😘 ✨

    opened by arjunshibu 11
  • Can't use tui-chart event if I'm not using it to render Markdown content

    Can't use tui-chart event if I'm not using it to render Markdown content

    Version

    2.17.1

    Development Environment

    wordpress,web

    Help seeking problem

    Hello, I'm working on a wordpress plugin which base on tui-editor, to prevent doing repeat rendering(which is unnecessary if the markdown content didn't change), I cached the render results from tui-editor.But this cause an issue, I can't use the tui-chart's javascript event if I don't use it to render Markdown content, how can I work out this issue?

    opened by jack9603301 10
  • Security Fix for Cross-site Scripting (XSS) - huntr.dev

    Security Fix for Cross-site Scripting (XSS) - huntr.dev

    @arjunshibu (https://huntr.dev/users/arjunshibu) has fixed a potential Cross-site Scripting (XSS) vulnerability in your repository 🔨. For more information, visit our website (https://huntr.dev/) or click the bounty URL below...

    Q | A Version Affected | * Bug Fix | YES Original Pull Request | https://github.com/418sec/tui.chart/pull/2 Vulnerability README | https://github.com/418sec/huntr/blob/master/bounties/npm/@toast-ui/chart/1/README.md

    If you are happy with this disclosure, we would love to get a CVE assigned to the vulnerability. Feel free to credit @arjunshibu, the discloser found in the bounty URL (below) and @huntr-helper.

    User Comments:

    :bar_chart: Metadata *

    @toast-ui/chart is vulnerable to Cross-Site Scripting (XSS).

    Bounty URL: https://www.huntr.dev/bounties/1-npm-%40toast-ui%2Fchart

    :gear: Description *

    The package does not properly validate some legend fields including name and categories. This causes XSS and the payload is triggered when the chart renders. The fix is implemented by sanitizing dangerous html given by users before rendering them.

    :computer: Technical Description *

    Cross-Site Scripting (XSS) attacks are a type of injection, in which malicious scripts are injected into otherwise benign and trusted websites. XSS attacks occur when an attacker uses a web application to send malicious code, generally in the form of a browser side script, to a different end user. Flaws that allow these attacks to succeed are quite widespread and occur anywhere a web application uses input from a user within the output it generates without validating or encoding it.

    :bug: Proof of Concept (PoC) *

    Save and execute the following file in any browser

    <html>
    <head>
          <title>tui-chart</title>
    </head>   
    <body>
         
          <link rel="stylesheet" href="https://uicdn.toast.com/chart/latest/toastui-chart.min.css" />
          <script src="https://uicdn.toast.com/chart/latest/toastui-chart.min.js"></script>
          <div id="chart-area"></div>
          <script type="text/javascript">   
            const el = document.getElementById('chart-area');
          const data = {
            categories: ['Browser'],
            series: [
              {
                name: 'Chrome"<img src=x onerror=alert(1)>',
                data: 46.02,
              },
              {
                name: 'IE',
                data: 20.47,
              },
              {
                name: 'Firefox',
                data: 17.71,
              },
              {
                name: 'Safari',
                data: 5.45,
              },
              {
                name: 'Opera',
                data: 3.1,
              },
              {
                name: 'Etc',
                data: 7.25,
              },
            ],
          };
          const options = {
            chart: { title: 'Usage share of web browsers', width: 600, height: 400 },
          };
    
          const chart = toastui.Chart.pieChart({ el, data, options });
        </script>
    </body>
    </html>
    

    :fire: Proof of Fix (PoF) *

    Before fix

    image

    After fix

    image image

    +1 User Acceptance Testing (UAT)

    • I've executed unit tests.
    • After fix the functionality is unaffected.
    opened by huntr-helper 9
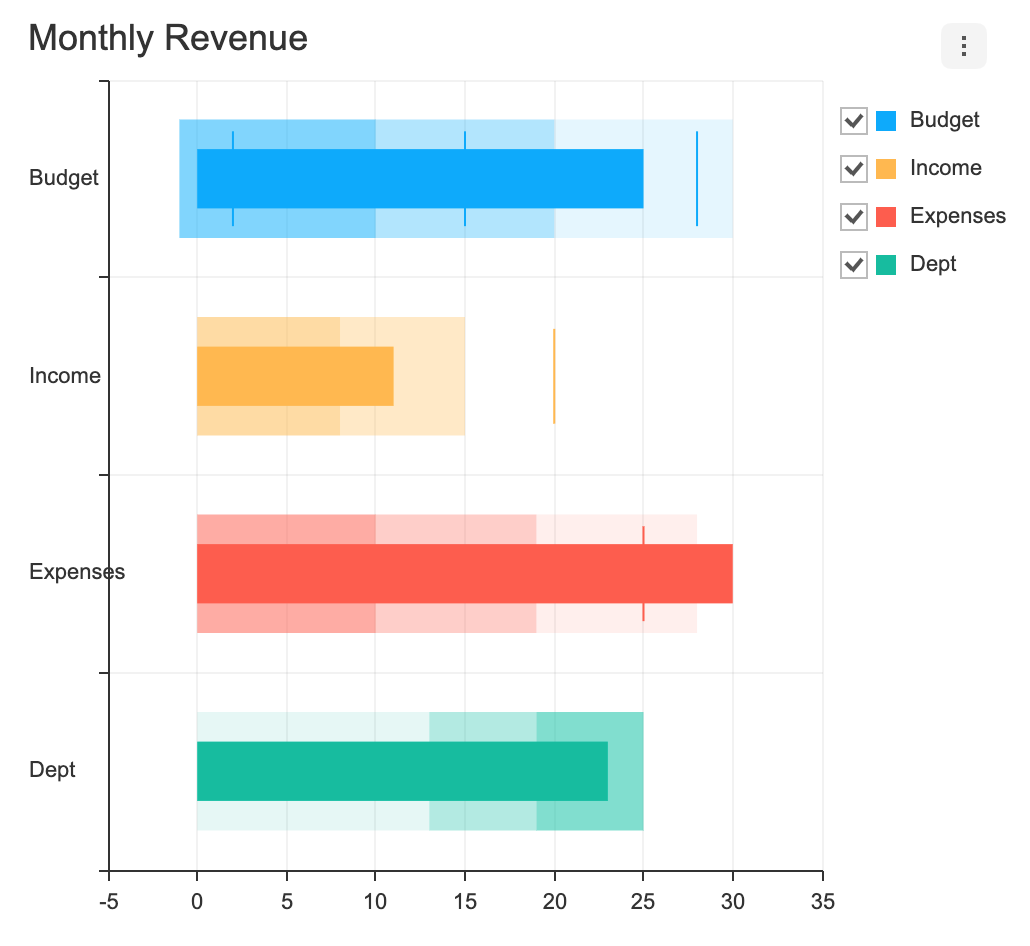
  • Series of bullet chart are not rendered for certain marker values

    Series of bullet chart are not rendered for certain marker values

    The following script does not render series on the chart. Chart is empty with correct legend.

    <script>
    var overview_chart_ff = document.getElementById('overview_chart_4444');
    var dataoverview_chart_ff = {    
        series: [
            {name:'w2',data:1.2,markers:[1.1],ranges:[[1.1,1.2]]},
            {name:'w3',data:1.4,markers:[1.3],ranges:[[1.3,1.4]]}
        ]
    };
    var themeoverview_chart_ff = {
        series: {
            rangeColors:['rgba(0, 0, 0, 0.2)']
        }
    };
    var optionsoverview_chart_ff = {
    	chart: {
    		width: 900,
    		height: 600,
    		title: 'KE - 0,2 Percent Dead Compared to 24 hours'
    	},
    	xAxis: {
    		title: 'Treatments'
    	},
    	yAxis: {
    		title: 'Killing Efficiency'
    	},
        legend: {
            align: 'top'
        },
        series: {
            dataLabels:{visible:true},
    		vertical:true,
        },
        theme: themeoverview_chart_ff
    };
    toastui.Chart.bulletChart({ el:overview_chart_ff, data:dataoverview_chart_ff, options:optionsoverview_chart_ff });
    </script>
    

    If I change values of marker and range values of the first series like below, it works.

    <script>
    var overview_chart_ff = document.getElementById('overview_chart_4444');
    var dataoverview_chart_ff = {    
        series: [
            {name:'w2',data:1.2,markers:[1.0],ranges:[[1.0,1.2]]},
            {name:'w3',data:1.4,markers:[1.3],ranges:[[1.3,1.4]]}
        ]
    };
    var themeoverview_chart_ff = {
        series: {
            rangeColors:['rgba(0, 0, 0, 0.2)']
        }
    };
    var optionsoverview_chart_ff = {
    	chart: {
    		width: 900,
    		height: 600,
    		title: 'KE - 0,2 Percent Dead Compared to 24 hours'
    	},
    	xAxis: {
    		title: 'Treatments'
    	},
    	yAxis: {
    		title: 'Killing Efficiency'
    	},
        legend: {
            align: 'top'
        },
        series: {
            dataLabels:{visible:true},
    		vertical:true,
        },
        theme: themeoverview_chart_ff
    };
    toastui.Chart.bulletChart({ el:overview_chart_ff, data:dataoverview_chart_ff, options:optionsoverview_chart_ff });
    </script>
    

    Screenshots

    Result of the script that does not work:

    image

    Result of the script that works

    image

    • OS: Windows
    • Browser: chrome
    • Version: latest

    Here are examples of other cases of bullet chart failing to render series:

    <script>
    // chart overview_chart_44 bullet 'KE - 0,8 Percent Dead Compared to 48 hours'
    var overview_chart_44 = document.getElementById('overview_chart_44');
    var dataoverview_chart_44 = {
        
        series: [
            {name:'w1',data:2.35208711433757,markers:[2.22515606471995],ranges:[[2.35208711433757,2.22515606471995]]},
            {name:'w2',data:1.03242953157343,markers:[1.01113622374169],ranges:[[1.03242953157343,1.01113622374169]]},
            {name:'w3',data:1.55006180469716,markers:[1.50104287680401],ranges:[[1.55006180469716,1.50104287680401]]}
        ]
    };
    var themeoverview_chart_44 = {
        series: {
            rangeColors:['rgba(0, 0, 0, 0.2)']
        }
    };
    var optionsoverview_chart_44 = {
    	chart: {
    		width: 900,
    		height: 600,
    		title: 'KE - 0,8 Percent Dead Compared to 48 hours'
    	},
    	xAxis: {
    		title: 'Treatments'
    	},
    	yAxis: {
    		title: 'Killing Efficiency'
    	},
        legend: {
            align: 'top'
        },
        series: {
            dataLabels:{visible:true},vertical:true
        },
        theme: themeoverview_chart_44
    };
    toastui.Chart.bulletChart({ el:overview_chart_44, data:dataoverview_chart_44, options:optionsoverview_chart_44 });
    // chart overview_chart_45 bullet 'KE - 0,6 Percent Dead Compared to 48 hours'
    var overview_chart_45 = document.getElementById('overview_chart_45');
    var dataoverview_chart_45 = {
        
        series: [
            {name:'w1',data:1.47930007191042,markers:[1.39946922309431],ranges:[[1.47930007191042,1.39946922309431]]},
            {name:'w2',data:1.21775620191714,markers:[1.19264063046316],ranges:[[1.21775620191714,1.19264063046316]]},
            {name:'w3',data:1.29142160293626,markers:[1.25058187497047],ranges:[[1.29142160293626,1.25058187497047]]}
        ]
    };
    var themeoverview_chart_45 = {
        series: {
            rangeColors:['rgba(0, 0, 0, 0.2)']
        }
    };
    var optionsoverview_chart_45 = {
    	chart: {
    		width: 900,
    		height: 600,
    		title: 'KE - 0,6 Percent Dead Compared to 48 hours'
    	},
    	xAxis: {
    		title: 'Treatments'
    	},
    	yAxis: {
    		title: 'Killing Efficiency'
    	},
        legend: {
            align: 'top'
        },
        series: {
            dataLabels:{visible:true},vertical:true
        },
        theme: themeoverview_chart_45
    };
    toastui.Chart.bulletChart({ el:overview_chart_45, data:dataoverview_chart_45, options:optionsoverview_chart_45 });
    // chart overview_chart_46 bullet 'KE - 0,4 Percent Dead Compared to 48 hours'
    var overview_chart_46 = document.getElementById('overview_chart_46');
    var dataoverview_chart_46 = {
        
        series: [
            {name:'w1',data:2.36756736247684,markers:[2.2398009168687],ranges:[[2.36756736247684,2.2398009168687]]},
            {name:'w2',data:2.04011817757736,markers:[1.99804182946855],ranges:[[2.04011817757736,1.99804182946855]]},
            {name:'w3',data:2.60787075631701,markers:[2.5253998327892],ranges:[[2.60787075631701,2.5253998327892]]}
        ]
    };
    var themeoverview_chart_46 = {
        series: {
            rangeColors:['rgba(0, 0, 0, 0.2)']
        }
    };
    var optionsoverview_chart_46 = {
    	chart: {
    		width: 900,
    		height: 600,
    		title: 'KE - 0,4 Percent Dead Compared to 48 hours'
    	},
    	xAxis: {
    		title: 'Treatments'
    	},
    	yAxis: {
    		title: 'Killing Efficiency'
    	},
        legend: {
            align: 'top'
        },
        series: {
            dataLabels:{visible:true},vertical:true
        },
        theme: themeoverview_chart_46
    };
    toastui.Chart.bulletChart({ el:overview_chart_46, data:dataoverview_chart_46, options:optionsoverview_chart_46 });
    // chart overview_chart_47 bullet 'KE - 0,2 Percent Dead Compared to 48 hours'
    var overview_chart_47 = document.getElementById('overview_chart_47');
    var dataoverview_chart_47 = {
        
        series: [
            {name:'w1',data:2.67516469697186,markers:[2.53079867378472],ranges:[[2.67516469697186,2.53079867378472]]},
            {name:'w2',data:2.05170975813178,markers:[2.00939433986326],ranges:[[2.05170975813178,2.00939433986326]]},
            {name:'w3',data:2.83894791194004,markers:[2.74916943822622],ranges:[[2.83894791194004,2.74916943822622]]}
        ]
    };
    var themeoverview_chart_47 = {
        series: {
            rangeColors:['rgba(0, 0, 0, 0.2)']
        }
    };
    var optionsoverview_chart_47 = {
    	chart: {
    		width: 900,
    		height: 600,
    		title: 'KE - 0,2 Percent Dead Compared to 48 hours'
    	},
    	xAxis: {
    		title: 'Treatments'
    	},
    	yAxis: {
    		title: 'Killing Efficiency'
    	},
        legend: {
            align: 'top'
        },
        series: {
            dataLabels:{visible:true},vertical:true
        },
        theme: themeoverview_chart_47
    };
    toastui.Chart.bulletChart({ el:overview_chart_47, data:dataoverview_chart_47, options:optionsoverview_chart_47 });
    // chart overview_chart_48 bullet 'KE - 0,1 Percent Dead Compared to 48 hours'
    var overview_chart_48 = document.getElementById('overview_chart_48');
    var dataoverview_chart_48 = {
        
        series: [
            {name:'w1',data:2.49980273021384,markers:[2.36490016540284],ranges:[[2.49980273021384,2.36490016540284]]},
            {name:'w2',data:1.68535507985049,markers:[1.65059553120957],ranges:[[1.68535507985049,1.65059553120957]]},
            {name:'w3',data:2.25919939146144,markers:[2.18775480020017],ranges:[[2.25919939146144,2.18775480020017]]}
        ]
    };
    var themeoverview_chart_48 = {
        series: {
            rangeColors:['rgba(0, 0, 0, 0.2)']
        }
    };
    var optionsoverview_chart_48 = {
    	chart: {
    		width: 900,
    		height: 600,
    		title: 'KE - 0,1 Percent Dead Compared to 48 hours'
    	},
    	xAxis: {
    		title: 'Treatments'
    	},
    	yAxis: {
    		title: 'Killing Efficiency'
    	},
        legend: {
            align: 'top'
        },
        series: {
            dataLabels:{visible:true},vertical:true
        },
        theme: themeoverview_chart_48
    };
    toastui.Chart.bulletChart({ el:overview_chart_48, data:dataoverview_chart_48, options:optionsoverview_chart_48 });
    // chart overview_chart_49 bullet 'KE - 0,05 Percent Dead Compared to 48 hours'
    var overview_chart_49 = document.getElementById('overview_chart_49');
    var dataoverview_chart_49 = {
        
        series: [
            {name:'w1',data:1.86673580502982,markers:[1.76599687676186],ranges:[[1.86673580502982,1.76599687676186]]},
            {name:'w2',data:1.1743119266055,markers:[1.15009237013312],ranges:[[1.1743119266055,1.15009237013312]]},
            {name:'w3',data:1.56290512225271,markers:[1.51348003916287],ranges:[[1.56290512225271,1.51348003916287]]}
        ]
    };
    var themeoverview_chart_49 = {
        series: {
            rangeColors:['rgba(0, 0, 0, 0.2)']
        }
    };
    var optionsoverview_chart_49 = {
    	chart: {
    		width: 900,
    		height: 600,
    		title: 'KE - 0,05 Percent Dead Compared to 48 hours'
    	},
    	xAxis: {
    		title: 'Treatments'
    	},
    	yAxis: {
    		title: 'Killing Efficiency'
    	},
        legend: {
            align: 'top'
        },
        series: {
            dataLabels:{visible:true},vertical:true
        },
        theme: themeoverview_chart_49
    };
    toastui.Chart.bulletChart({ el:overview_chart_49, data:dataoverview_chart_49, options:optionsoverview_chart_49 });
    </script>
    
    Type: Bug Priority: High 
    opened by vbelyakov 9
  • Need Single bar column chart

    Need Single bar column chart

    Need Single bar column chart for processing the report. In examples, column charts are grouped one, not for single column chart. Is this chart available in the latest library? If yes, Kindly help me on creating Single Column chart with multi colors for column.

    Type: Feature 
    opened by rajhen96 9
  • feat: apply plot.bands and plot.lines options

    feat: apply plot.bands and plot.lines options

    Please check if the PR fulfills these requirements

    • [ ] It's submitted to right branch according to our branching model
    • [ ] It's right issue type on title
    • [ ] When resolving a specific issue, it's referenced in the PR's title (e.g. fix #xxx[,#xxx], where "xxx" is the issue number)
    • [ ] The commit message follows our guidelines
    • [ ] Tests for the changes have been added (for bug fixes/features)
    • [ ] Docs have been added/updated (for bug fixes/features)
    • [ ] It does not introduce a breaking change or has description for the breaking change

    Description

    • feat: apply plot options (showLine, lines, bands, mergeOverlappingRanges)

    showLine

        plot: {
          showLine: false,
        },
    
    스크린샷 2020-09-03 10 05 32

    mergeOverlappingRanges

        xAxis: { title: 'minute', date: { format: 'hh:mm:ss' } },
        plot: {
          bands: [
            {
              range: [
                ['08/22/2020 10:35:00', '08/22/2020 10:45:00'],
                ['08/22/2020 10:40:00', '08/22/2020 10:55:00'],
              ],
              color: '#00bcd4',
              opacity: 0.2,
              mergeOverlappingRanges: boolean('mergeOverlappingRanges', true),
            },
          ],
    

    | mergeOverlappingRanges: false | mergeOverlappingRanges: true | | --- | --- | | 스크린샷 2020-09-03 09 36 32 | 스크린샷 2020-09-03 10 09 25 |

    • basic
        plot: {
          bands: [
            {
              range: [3, 8],
              color: '#ff5722',
              opacity: 0.2,
            },
          ],
          lines: [
            {
              value: 20,
              color: '#fa2828',
            },
          ],
        },
    
    스크린샷 2020-09-03 10 06 57
    • datetime xAxis
        xAxis: { title: 'minute', date: { format: 'hh:mm:ss' } },
        plot: {
          lines: [
            {
              value: '08/22/2020 10:20:00',
              color: '#fa2828',
            },
          ],
          bands: [
            {
              range: [
                ['08/22/2020 10:35:00', '08/22/2020 10:45:00'],
                ['08/22/2020 10:40:00', '08/22/2020 10:55:00'],
              ],
              color: '#00bcd4',
              opacity: 0.2,
            },
            {
              range: [['08/22/2020 10:05:00', '08/22/2020 10:15:00']],
              color: '#ff5722',
              opacity: 0.1,
            },
          ],
        },
    
    스크린샷 2020-09-03 10 01 03

    Thank you for your contribution to TOAST UI product. 🎉 😘 ✨

    opened by jungeun-cho 9
  • bower로 tui.chart 설치시 오류 메시지

    bower로 tui.chart 설치시 오류 메시지

    안녕하세요. 클라우드플랫폼개발팀 신진호 입니다.

    high chart 라이선스 만료로 tui.chart를 적용하려 합니다.

    Wiki 내용대로 bower를 사용해서 tui.chart를 설치시 오류 메시지가 출력됩니다. 가이드 부탁드립니다.

    $ bower install tui-chart
    bower tui-chart#*           not-cached https://github.com/nhnent/tui.chart.git#*
    bower tui-chart#*              resolve https://github.com/nhnent/tui.chart.git#*
    bower tui-chart#*             download https://github.com/nhnent/tui.chart/archive/2.5.0.tar.gz
    bower tui-chart#*              extract archive.tar.gz
    bower tui-chart#*             resolved https://github.com/nhnent/tui.chart.git#2.5.0
    bower raphael#v2.1.4b       not-cached https://github.com/nhnent/raphael.git#v2.1.4b
    bower raphael#v2.1.4b          resolve https://github.com/nhnent/raphael.git#v2.1.4b
    bower tui-code-snippet#1.0.8       not-cached https://github.com/nhnent/tui.code-snippet.git#1.0.8
    bower tui-code-snippet#1.0.8          resolve https://github.com/nhnent/tui.code-snippet.git#1.0.8
    bower tui-component-effects#~1.1.0 not-cached https://github.com/nhnent/tui.component.effects.git#~1.1.0
    bower tui-component-effects#~1.1.0    resolve https://github.com/nhnent/tui.component.effects.git#~1.1.0
    bower raphael#v2.1.4b                download https://github.com/nhnent/raphael/archive/v2.1.4b.tar.gz
    bower tui-code-snippet#1.0.8         download https://github.com/nhnent/tui.code-snippet/archive/1.0.8.tar.gz
    bower tui-component-effects#~1.1.0   download https://github.com/nhnent/tui.component.effects/archive/1.1.1.tar.gz
    bower tui-component-effects#~1.1.0    extract archive.tar.gz
    bower tui-component-effects#~1.1.0   resolved https://github.com/nhnent/tui.component.effects.git#1.1.1
    bower tui-code-snippet#~1.1.0      not-cached https://github.com/nhnent/tui.code-snippet.git#~1.1.0
    bower tui-code-snippet#~1.1.0         resolve https://github.com/nhnent/tui.code-snippet.git#~1.1.0
    bower tui-code-snippet#~1.1.0        download https://github.com/nhnent/tui.code-snippet/archive/1.1.3.tar.gz
    bower raphael#v2.1.4b                 extract archive.tar.gz
    bower raphael#v2.1.4b                resolved https://github.com/nhnent/raphael.git#v2.1.4b
    bower tui-code-snippet#1.0.8          extract archive.tar.gz
    bower tui-code-snippet#1.0.8         resolved https://github.com/nhnent/tui.code-snippet.git#1.0.8
    bower tui-code-snippet#~1.1.0         extract archive.tar.gz
    bower tui-code-snippet#~1.1.0        resolved https://github.com/nhnent/tui.code-snippet.git#1.1.3
    bower                               ECONFLICT Unable to find suitable version for tui-code-snippet
    
    Help Wanted🤝 
    opened by gimbimloki 9
  • Chart doesn't working in IE (not displaying)

    Chart doesn't working in IE (not displaying)

    Translated

    Hello. I am using TOAST UI CHART well.

    I worked with the sources you provided. I can't see it in explorer.

    In the console, it says syntax error and an error occurs. I checked condition: ({ width: w }) => { <--- It comes from this part.

    I'm not sure if I installed it wrong.

    Original

    안녕하세요. TOAST UI CHART를 잘 이용하고 있습니다.

    제공해주신 소스들로 구성해서 작업을 했는데요. 익스플로러에서 노출이 안되네요.

    콘솔에서 구문오류라고 하여 에러가 발생되는데요. 확인해보니 condition: ({ width: w }) => { <--- 이부분에서 나옵니다.

    제가 설치를 잘못한것인지..문의드립니다.

    inactive 
    opened by jewon7377 8
  • chore(deps): bump express from 4.17.1 to 4.18.2

    chore(deps): bump express from 4.17.1 to 4.18.2

    Bumps express from 4.17.1 to 4.18.2.

    Release notes

    Sourced from express's releases.

    4.18.2

    4.18.1

    • Fix hanging on large stack of sync routes

    4.18.0

    ... (truncated)

    Changelog

    Sourced from express's changelog.

    4.18.2 / 2022-10-08

    4.18.1 / 2022-04-29

    • Fix hanging on large stack of sync routes

    4.18.0 / 2022-04-25

    ... (truncated)

    Commits

    Dependabot compatibility score

    Dependabot will resolve any conflicts with this PR as long as you don't alter it yourself. You can also trigger a rebase manually by commenting @dependabot rebase.


    Dependabot commands and options

    You can trigger Dependabot actions by commenting on this PR:

    • @dependabot rebase will rebase this PR
    • @dependabot recreate will recreate this PR, overwriting any edits that have been made to it
    • @dependabot merge will merge this PR after your CI passes on it
    • @dependabot squash and merge will squash and merge this PR after your CI passes on it
    • @dependabot cancel merge will cancel a previously requested merge and block automerging
    • @dependabot reopen will reopen this PR if it is closed
    • @dependabot close will close this PR and stop Dependabot recreating it. You can achieve the same result by closing it manually
    • @dependabot ignore this major version will close this PR and stop Dependabot creating any more for this major version (unless you reopen the PR or upgrade to it yourself)
    • @dependabot ignore this minor version will close this PR and stop Dependabot creating any more for this minor version (unless you reopen the PR or upgrade to it yourself)
    • @dependabot ignore this dependency will close this PR and stop Dependabot creating any more for this dependency (unless you reopen the PR or upgrade to it yourself)
    • @dependabot use these labels will set the current labels as the default for future PRs for this repo and language
    • @dependabot use these reviewers will set the current reviewers as the default for future PRs for this repo and language
    • @dependabot use these assignees will set the current assignees as the default for future PRs for this repo and language
    • @dependabot use this milestone will set the current milestone as the default for future PRs for this repo and language

    You can disable automated security fix PRs for this repo from the Security Alerts page.

    dependencies 
    opened by dependabot[bot] 0
  • chore(deps): bump qs from 6.5.2 to 6.5.3

    chore(deps): bump qs from 6.5.2 to 6.5.3

    Bumps qs from 6.5.2 to 6.5.3.

    Changelog

    Sourced from qs's changelog.

    6.5.3

    • [Fix] parse: ignore __proto__ keys (#428)
    • [Fix] utils.merge`: avoid a crash with a null target and a truthy non-array source
    • [Fix] correctly parse nested arrays
    • [Fix] stringify: fix a crash with strictNullHandling and a custom filter/serializeDate (#279)
    • [Fix] utils: merge: fix crash when source is a truthy primitive & no options are provided
    • [Fix] when parseArrays is false, properly handle keys ending in []
    • [Fix] fix for an impossible situation: when the formatter is called with a non-string value
    • [Fix] utils.merge: avoid a crash with a null target and an array source
    • [Refactor] utils: reduce observable [[Get]]s
    • [Refactor] use cached Array.isArray
    • [Refactor] stringify: Avoid arr = arr.concat(...), push to the existing instance (#269)
    • [Refactor] parse: only need to reassign the var once
    • [Robustness] stringify: avoid relying on a global undefined (#427)
    • [readme] remove travis badge; add github actions/codecov badges; update URLs
    • [Docs] Clean up license text so it’s properly detected as BSD-3-Clause
    • [Docs] Clarify the need for "arrayLimit" option
    • [meta] fix README.md (#399)
    • [meta] add FUNDING.yml
    • [actions] backport actions from main
    • [Tests] always use String(x) over x.toString()
    • [Tests] remove nonexistent tape option
    • [Dev Deps] backport from main
    Commits
    • 298bfa5 v6.5.3
    • ed0f5dc [Fix] parse: ignore __proto__ keys (#428)
    • 691e739 [Robustness] stringify: avoid relying on a global undefined (#427)
    • 1072d57 [readme] remove travis badge; add github actions/codecov badges; update URLs
    • 12ac1c4 [meta] fix README.md (#399)
    • 0338716 [actions] backport actions from main
    • 5639c20 Clean up license text so it’s properly detected as BSD-3-Clause
    • 51b8a0b add FUNDING.yml
    • 45f6759 [Fix] fix for an impossible situation: when the formatter is called with a no...
    • f814a7f [Dev Deps] backport from main
    • Additional commits viewable in compare view

    Dependabot compatibility score

    Dependabot will resolve any conflicts with this PR as long as you don't alter it yourself. You can also trigger a rebase manually by commenting @dependabot rebase.


    Dependabot commands and options

    You can trigger Dependabot actions by commenting on this PR:

    • @dependabot rebase will rebase this PR
    • @dependabot recreate will recreate this PR, overwriting any edits that have been made to it
    • @dependabot merge will merge this PR after your CI passes on it
    • @dependabot squash and merge will squash and merge this PR after your CI passes on it
    • @dependabot cancel merge will cancel a previously requested merge and block automerging
    • @dependabot reopen will reopen this PR if it is closed
    • @dependabot close will close this PR and stop Dependabot recreating it. You can achieve the same result by closing it manually
    • @dependabot ignore this major version will close this PR and stop Dependabot creating any more for this major version (unless you reopen the PR or upgrade to it yourself)
    • @dependabot ignore this minor version will close this PR and stop Dependabot creating any more for this minor version (unless you reopen the PR or upgrade to it yourself)
    • @dependabot ignore this dependency will close this PR and stop Dependabot creating any more for this dependency (unless you reopen the PR or upgrade to it yourself)
    • @dependabot use these labels will set the current labels as the default for future PRs for this repo and language
    • @dependabot use these reviewers will set the current reviewers as the default for future PRs for this repo and language
    • @dependabot use these assignees will set the current assignees as the default for future PRs for this repo and language
    • @dependabot use this milestone will set the current milestone as the default for future PRs for this repo and language

    You can disable automated security fix PRs for this repo from the Security Alerts page.

    dependencies 
    opened by dependabot[bot] 0
  • chore(deps): bump decode-uri-component from 0.2.0 to 0.2.2

    chore(deps): bump decode-uri-component from 0.2.0 to 0.2.2

    Bumps decode-uri-component from 0.2.0 to 0.2.2.

    Release notes

    Sourced from decode-uri-component's releases.

    v0.2.2

    • Prevent overwriting previously decoded tokens 980e0bf

    https://github.com/SamVerschueren/decode-uri-component/compare/v0.2.1...v0.2.2

    v0.2.1

    • Switch to GitHub workflows 76abc93
    • Fix issue where decode throws - fixes #6 746ca5d
    • Update license (#1) 486d7e2
    • Tidelift tasks a650457
    • Meta tweaks 66e1c28

    https://github.com/SamVerschueren/decode-uri-component/compare/v0.2.0...v0.2.1

    Commits

    Dependabot compatibility score

    Dependabot will resolve any conflicts with this PR as long as you don't alter it yourself. You can also trigger a rebase manually by commenting @dependabot rebase.


    Dependabot commands and options

    You can trigger Dependabot actions by commenting on this PR:

    • @dependabot rebase will rebase this PR
    • @dependabot recreate will recreate this PR, overwriting any edits that have been made to it
    • @dependabot merge will merge this PR after your CI passes on it
    • @dependabot squash and merge will squash and merge this PR after your CI passes on it
    • @dependabot cancel merge will cancel a previously requested merge and block automerging
    • @dependabot reopen will reopen this PR if it is closed
    • @dependabot close will close this PR and stop Dependabot recreating it. You can achieve the same result by closing it manually
    • @dependabot ignore this major version will close this PR and stop Dependabot creating any more for this major version (unless you reopen the PR or upgrade to it yourself)
    • @dependabot ignore this minor version will close this PR and stop Dependabot creating any more for this minor version (unless you reopen the PR or upgrade to it yourself)
    • @dependabot ignore this dependency will close this PR and stop Dependabot creating any more for this dependency (unless you reopen the PR or upgrade to it yourself)
    • @dependabot use these labels will set the current labels as the default for future PRs for this repo and language
    • @dependabot use these reviewers will set the current reviewers as the default for future PRs for this repo and language
    • @dependabot use these assignees will set the current assignees as the default for future PRs for this repo and language
    • @dependabot use this milestone will set the current milestone as the default for future PRs for this repo and language

    You can disable automated security fix PRs for this repo from the Security Alerts page.

    dependencies 
    opened by dependabot[bot] 0
  • feat: support-vue3

    feat: support-vue3

    Please check if the PR fulfills these requirements

    • [ ] It's submitted to right branch according to our branching model
    • [ ] It's right issue type on title
    • [ ] When resolving a specific issue, it's referenced in the PR's title (e.g. fix #xxx[,#xxx], where "xxx" is the issue number)
    • [ ] The commit message follows our guidelines
    • [ ] Tests for the changes have been added (for bug fixes/features)
    • [ ] Docs have been added/updated (for bug fixes/features)
    • [ ] It does not introduce a breaking change or has description for the breaking change

    Description

    support vue3


    Thank you for your contribution to TOAST UI product. 🎉 😘 ✨

    opened by taeyeon-Kim 0
  • chore(deps): bump jsdom, jest and ts-jest

    chore(deps): bump jsdom, jest and ts-jest

    Removes jsdom. It's no longer used after updating ancestor dependencies jsdom, jest and ts-jest. These dependencies need to be updated together.

    Removes jsdom

    Updates jest from 24.9.0 to 29.3.1

    Release notes

    Sourced from jest's releases.

    v29.3.1

    Fixes

    • [jest-config] Do not warn about preset in ProjectConfig #13583

    Performance

    • [jest-transform] Defer creation of cache directory #13420

    v29.3.0

    Features

    • [jest-runtime] Support WebAssembly (Wasm) imports in ESM modules (#13505)

    Fixes

    • [jest-config] Add config validation for projects option (#13565)
    • [jest-mock] Treat cjs modules as objects so they can be mocked (#13513)
    • [jest-worker] Throw an error instead of hanging when jest workers terminate unexpectedly (#13566)

    Chore & Maintenance

    • [@jest/transform] Update convert-source-map (#13509)
    • [docs] Mention toStrictEqual in UsingMatchers docs. (#13560)

    New Contributors

    Full Changelog: https://github.com/facebook/jest/compare/v29.2.2...v29.3.0

    v29.2.2

    Fixes

    • [@jest/test-sequencer] Make sure sharding does not produce empty groups (#13476)
    • [jest-circus] Test marked as todo are shown as todo when inside a focussed describe (#13504)
    • [jest-mock] Ensure mock resolved and rejected values are promises from correct realm (#13503)
    • [jest-snapshot] Don't highlight passing asymmetric property matchers in snapshot diff (#13480)

    Chore & Maintenance

    • [docs] Update link to Jest 28 upgrade guide in error message (#13483)
    • [jest-runner, jest-watcher] Update emittery (#13490)

    New Contributors

    ... (truncated)

    Changelog

    Sourced from jest's changelog.

    29.3.1

    Fixes

    • [jest-config] Do not warn about preset in ProjectConfig #13583

    Performance

    • [jest-transform] Defer creation of cache directory #13420

    29.3.0

    Features

    • [jest-runtime] Support WebAssembly (Wasm) imports in ESM modules (#13505)

    Fixes

    • [jest-config] Add config validation for projects option (#13565)
    • [jest-mock] Treat cjs modules as objects so they can be mocked (#13513)
    • [jest-worker] Throw an error instead of hanging when jest workers terminate unexpectedly (#13566)

    Chore & Maintenance

    • [@jest/transform] Update convert-source-map (#13509)
    • [docs] Mention toStrictEqual in UsingMatchers docs. (#13560)

    29.2.2

    Fixes

    • [@jest/test-sequencer] Make sure sharding does not produce empty groups (#13476)
    • [jest-circus] Test marked as todo are shown as todo when inside a focussed describe (#13504)
    • [jest-mock] Ensure mock resolved and rejected values are promises from correct realm (#13503)
    • [jest-snapshot] Don't highlight passing asymmetric property matchers in snapshot diff (#13480)

    Chore & Maintenance

    • [docs] Update link to Jest 28 upgrade guide in error message (#13483)
    • [jest-runner, jest-watcher] Update emittery (#13490)

    29.2.1

    Features

    • [@jest/globals, jest-mock] Add jest.Spied* utility types (#13440)

    Fixes

    • [jest-environment-node] make globalThis.performance writable for Node 19 and fake timers (#13467)

    ... (truncated)

    Commits
    Maintainer changes

    This version was pushed to npm by simenb, a new releaser for jest since your current version.


    Updates ts-jest from 24.3.0 to 29.0.3

    Release notes

    Sourced from ts-jest's releases.

    v29.0.3

    Please refer to CHANGELOG.md for details.

    v29.0.2

    Please refer to CHANGELOG.md for details.

    v29.0.1

    Please refer to CHANGELOG.md for details.

    v29.0.0

    Please refer to CHANGELOG.md for details.

    v29.0.0-next.1

    Please refer to CHANGELOG.md for details.

    v29.0.0-next.0

    Please refer to CHANGELOG.md for details.

    v28.0.8

    Please refer to CHANGELOG.md for details.

    v28.0.7

    No release notes provided.

    v28.0.6

    No release notes provided.

    v28.0.5

    No release notes provided.

    v28.0.4

    No release notes provided.

    v28.0.3

    No release notes provided.

    v28.0.2

    No release notes provided.

    v28.0.1

    No release notes provided.

    v28.0.0

    No release notes provided.

    v28.0.0-next.3

    No release notes provided.

    v28.0.0-next.2

    No release notes provided.

    ... (truncated)

    Changelog

    Sourced from ts-jest's changelog.

    29.0.3 (2022-09-28)

    Bug Fixes

    • merge config from globals with transformer config correctly (#3842) (9c9fd60), closes #3841
    • presets: allow merging transform config when using presets (#3833) (afc6a94)

    Features

    • add useESM option to pathsToModuleNameMapper options (#3792) (eabe906)

    29.0.2 (2022-09-23)

    Bug Fixes

    29.0.2 (2022-09-22)

    Bug Fixes

    29.0.1 (2022-09-13)

    Bug Fixes

    • legacy: include existing globals config in cached config (#3803) (e79be47)

    Features

    • add typings for ts-jest options via transform config (#3805) (664b0f2)

    29.0.0 (2022-09-08)

    ... (truncated)

    Commits
    • 4a27966 chore(release): 29.0.3 (#3847)
    • 9c9fd60 fix: merge config from globals with transformer config correctly (#3842)
    • c76195b build(deps): Update @​types packages to ^5.38.1 (#3838)
    • 5a54a63 test(e2e): change esm nodejs condition to 14.15.0 (#3835)
    • eabe906 feat: add useESM option to pathsToModuleNameMapper options (#3792)
    • 12a90d3 docs(devs-infra): add example transform match file regex (#3834)
    • afc6a94 fix(presets): allow merging transform config when using presets (#3833)
    • 071ccbd build(deps): Update dependency eslint to ^8.24.0 (#3831)
    • 0a33c98 chore(release): 29.0.2 (#3824)
    • 214cb8c fix: use transformer config in config:init instead of globals (#3829)
    • Additional commits viewable in compare view

    Dependabot will resolve any conflicts with this PR as long as you don't alter it yourself. You can also trigger a rebase manually by commenting @dependabot rebase.


    Dependabot commands and options

    You can trigger Dependabot actions by commenting on this PR:

    • @dependabot rebase will rebase this PR
    • @dependabot recreate will recreate this PR, overwriting any edits that have been made to it
    • @dependabot merge will merge this PR after your CI passes on it
    • @dependabot squash and merge will squash and merge this PR after your CI passes on it
    • @dependabot cancel merge will cancel a previously requested merge and block automerging
    • @dependabot reopen will reopen this PR if it is closed
    • @dependabot close will close this PR and stop Dependabot recreating it. You can achieve the same result by closing it manually
    • @dependabot ignore this major version will close this PR and stop Dependabot creating any more for this major version (unless you reopen the PR or upgrade to it yourself)
    • @dependabot ignore this minor version will close this PR and stop Dependabot creating any more for this minor version (unless you reopen the PR or upgrade to it yourself)
    • @dependabot ignore this dependency will close this PR and stop Dependabot creating any more for this dependency (unless you reopen the PR or upgrade to it yourself)
    • @dependabot use these labels will set the current labels as the default for future PRs for this repo and language
    • @dependabot use these reviewers will set the current reviewers as the default for future PRs for this repo and language
    • @dependabot use these assignees will set the current assignees as the default for future PRs for this repo and language
    • @dependabot use this milestone will set the current milestone as the default for future PRs for this repo and language

    You can disable automated security fix PRs for this repo from the Security Alerts page.

    dependencies 
    opened by dependabot[bot] 0
  • chore(deps): bump vm2 from 3.9.3 to 3.9.11

    chore(deps): bump vm2 from 3.9.3 to 3.9.11

    Bumps vm2 from 3.9.3 to 3.9.11.

    Release notes

    Sourced from vm2's releases.

    3.9.11

    New Features

    https://github.com/patriksimek/vm2/commit/58478a58c6f4af3c54faf4117ed5ab72d2cc8cd5: Add option require.strict to allow to load required modules in non strict mode.

    Fixes

    https://github.com/patriksimek/vm2/commit/d9a7f3cc995d3d861e1380eafb886cb3c5e2b873: Security fix.

    3.9.10

    New Features

    61d240f69cc02974be27c7582fee2defd0e6c7a8: Add uptime to process.

    Fixes

    e3e573fdc99a98a9c7db026e4c40474eb78cab4a: Security fix. 245da82dcdfa67031e065fd7c7a7348b5e21f2b8: Fix inspect showProxy.

    3.9.9

    Fixes

    5c2e13bbf0c0518e1958a4307982a999aa181049: Bump ECMA version to 2022.

    3.9.8

    Fixes

    777ffb0e021ef89444f215a69365a689d7051896: Fix access to some restricted function properties on non functions and fix findBestExtensionHandler not finding the best handler. 925e3e665acfa37dd3db0ea8e7f02b57277677e8: Try to return nicer parser errors.

    3.9.7

    Fixes

    b7f794dfb3034d2173b9da957f48425adc4081c3: Custom Resolver is allowed to return undefined 568934f58cf72339a3dd2a2c578cc28550c19d27: Fixed some bugs introduced in v3.9.6 b6581b4a9cf9a4706b2967fceb5930a3de4d2ac7: Fixed root path checking

    3.9.6

    Fixes

    532120d5cdec7da8225fc6242e154ebabc63fe4d: Internal restructuring and security improvements

    3.9.5

    New Features

    d9af94ca3a701b9ba6283264fafeef4827786702: Added editor config

    Fixes

    4f0db94bfa250089d903083fcd6c6cf6cd11b8a9: Fix Promise.then not working

    ... (truncated)

    Changelog

    Sourced from vm2's changelog.

    v3.9.11 (2022-08-28)

    [new] Add option require.strict to allow to load required modules in non strict mode.
    [fix] Security fix.

    v3.9.10 (2022-07-05)

    [new] Add uptime to process.
    [fix] Security fix.
    [fix] Fix inspection with showProxy.

    v3.9.9 (2022-02-24)

    [fix] Bump parser ECMA version to 2022.

    v3.9.8 (2022-02-16)

    [fix] Add function type check for arguments, caller, and callee property check (GeoffRen)
    [fix] Fix find best extension handler

    v3.9.7 (2022-02-10)

    [fix] Allow relative require from base script
    [fix] Fix issue with modules with exports clause in package JSON
    [fix] Added missing whitelist check before custom require
    [fix] Revert plain object toString behavior
    [fix] Root path check improved

    v3.9.6 (2022-02-08)

    [fix] Security fixes (XmiliaH)

    v3.9.5 (2021-10-17)

    [new] Editor config (aubelsb2)
    [fix] Fix for Promise.then breaking
    [fix] Fix for missing properties on CallSite

    v3.9.4 (2021-10-12)

    [new] Added strict option
    [fix] Security fixes (XmiliaH)
    [fix] Fixed bound function causes TypeError (XmiliaH)
    [fix] Allow extending of frozen objects

    Commits

    Dependabot compatibility score

    Dependabot will resolve any conflicts with this PR as long as you don't alter it yourself. You can also trigger a rebase manually by commenting @dependabot rebase.


    Dependabot commands and options

    You can trigger Dependabot actions by commenting on this PR:

    • @dependabot rebase will rebase this PR
    • @dependabot recreate will recreate this PR, overwriting any edits that have been made to it
    • @dependabot merge will merge this PR after your CI passes on it
    • @dependabot squash and merge will squash and merge this PR after your CI passes on it
    • @dependabot cancel merge will cancel a previously requested merge and block automerging
    • @dependabot reopen will reopen this PR if it is closed
    • @dependabot close will close this PR and stop Dependabot recreating it. You can achieve the same result by closing it manually
    • @dependabot ignore this major version will close this PR and stop Dependabot creating any more for this major version (unless you reopen the PR or upgrade to it yourself)
    • @dependabot ignore this minor version will close this PR and stop Dependabot creating any more for this minor version (unless you reopen the PR or upgrade to it yourself)
    • @dependabot ignore this dependency will close this PR and stop Dependabot creating any more for this dependency (unless you reopen the PR or upgrade to it yourself)
    • @dependabot use these labels will set the current labels as the default for future PRs for this repo and language
    • @dependabot use these reviewers will set the current reviewers as the default for future PRs for this repo and language
    • @dependabot use these assignees will set the current assignees as the default for future PRs for this repo and language
    • @dependabot use this milestone will set the current milestone as the default for future PRs for this repo and language

    You can disable automated security fix PRs for this repo from the Security Alerts page.

    dependencies 
    opened by dependabot[bot] 0
Releases(v4.6.1)
  • v4.6.1(Dec 21, 2022)

    Bug fixes

    • Fix problem when exporting csv from firefox in compliance with data URL spec

    Full Changelog: https://github.com/nhn/tui.chart/compare/v4.5.0...v4.6.1

    Source code(tar.gz)
    Source code(zip)
  • v4.5.0(Nov 16, 2022)

    New Features

    Add rangeSelection option on Line, Column Chart (https://github.com/nhn/tui.chart/pull/763)

    rangeselection range2

    Refer to the code below to get the range you've selected.

    chart.on('rangeSelection`, ([from, to]) => {
      console.log(`${from} ~ ${to}`);
    })
    

    Full Changelog: https://github.com/nhn/tui.chart/compare/v4.4.3...v4.5.0

    Source code(tar.gz)
    Source code(zip)
  • v4.4.3(Apr 27, 2022)

  • v4.4.1(Oct 22, 2021)

  • v4.4.0(Sep 28, 2021)

    New Features

    Add new option named 'colorByCategories' (https://github.com/nhn/tui.chart/pull/705)

    It paints bar color based on categories. iamge

    const data = {
      categories: ['Jun', 'Jul', 'Aug', 'Sep', 'Oct', 'Nov', 'Dec'],
      series: [
        {
          name: 'Budget',
          data: [5000, 3000, 5000, 7000, 6000, 4000, 1000],
          colorByCategories: true
        }
      ]
    }
    
    Source code(tar.gz)
    Source code(zip)
  • v4.3.6(Jul 28, 2021)

    Bug Fixes

    • Fix do not make pie series model of zero value data (#684)
    • Fix box type data labels using useSeriesColor option (#687)
    • Fix chart option for rotatable story (#689)
    • Fix remove library module name in vue wrapper build (#691)
    • Fix to considering the chart layout in the axis rotation calculation (#695)
    Source code(tar.gz)
    Source code(zip)
  • v4.3.5(Jun 21, 2021)

  • v4.3.4(May 24, 2021)

  • v4.3.3(May 20, 2021)

  • v4.3.2(Apr 22, 2021)

    Bug Fixes

    • Resolve chart canvas background color transparency (#653)
    • Resolve an abnormal value of the export data, when an object type is used for coordinate data as in scatter and line charts (#656)
    Source code(tar.gz)
    Source code(zip)
  • v4.3.1(Apr 15, 2021)

    Bug Fixes

    • Fix the bullet chart scale was not calculated properly(#602, #648)
    • Fix bullet chart with negative values were not drawn correctly(#648)
    • Fix that not reflected when downloading from the export menu after data manipulation(#649)
    • Fix lineScatter chart scale was not calculated properly(#651)
    • Fix the title of the heatmap y-axis was not displayed properly(#644)
    Source code(tar.gz)
    Source code(zip)
  • v4.3.0(Apr 1, 2021)

    New Features

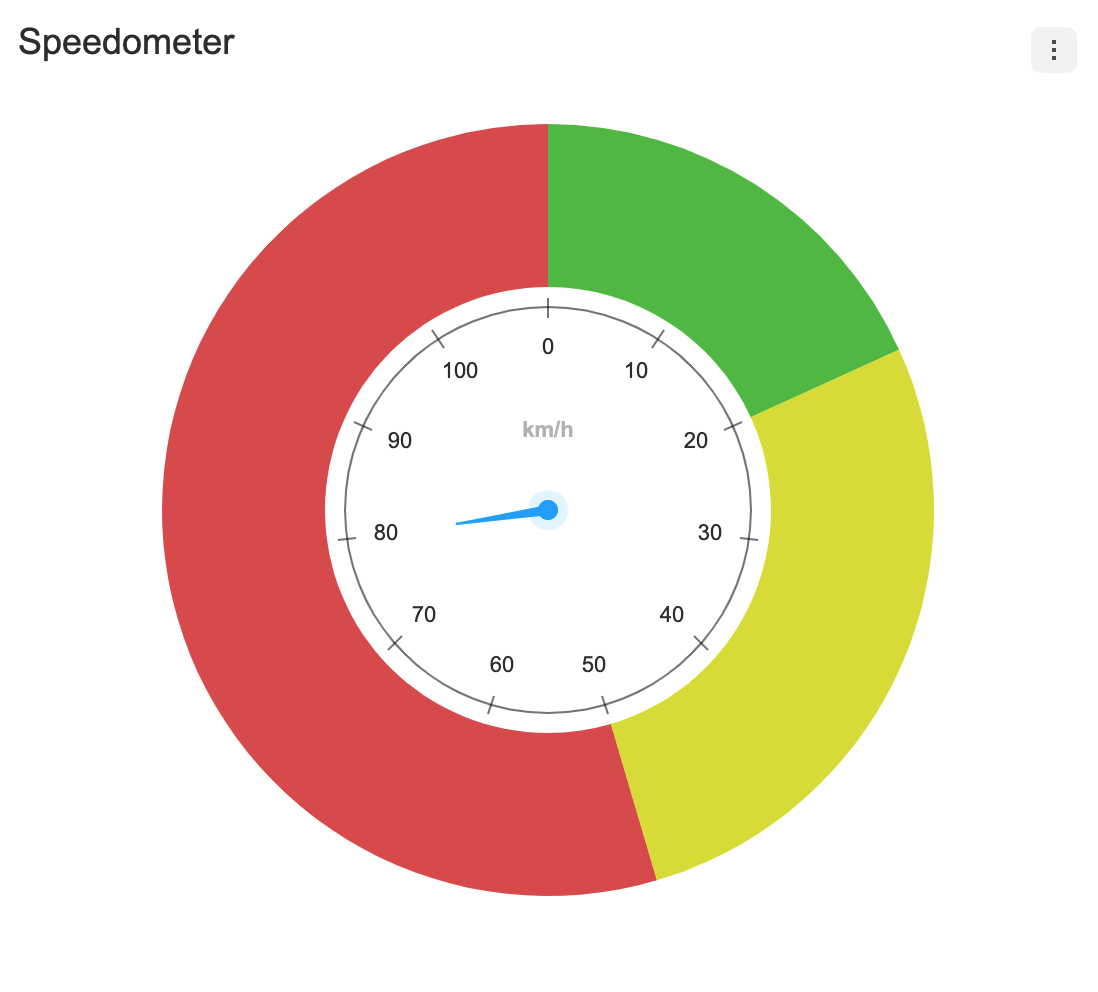
    A new chart type, the Gauge chart announced 🎉

    It supports series options such as clockwise, angleRange, solid, etc. Use these options to display your own charts. This new chart has circularAxis ans plot options. This chart does not support legends..

    plot You can set the range using the plot option.

    const options = {
      ...
      plot: {
        bands: [
          { range: [0, 20], color: '#55bf3b' },
          { range: [20, 50], color: '#dddf0d' },
          { range: [50, 110], color: '#df5353' },
        ],
      },
      // using category data
      plot: {
        bands: [
          { range: ['Apple', 'Watermelon'], color: '#df5353' },
          { range: ['Watermelon', 'Grape'], color: '#8700ff' },
          { range: ['Grape', 'Apple'], color: '#ff9800' },
        ],
      },
    };
    

    | basic | using category data | | :---: | :---: | | gauge-basic | gauge-category-data |

    series.clockwise options Determines the direction in which the series is painted.

    const chart = new GaugeChart({el, data, {
      ...
      clockwise: false,          // default: true
    }});
    

    | clockwise | counter clockwise | | :---: | :---: | | gauge-clockwise | gauge-countterclockwise |

    series.angleRange options The angleRange uses start and end options to determine the range of the arc.

    const chart = new GaugeChart({el, data, {
      ...
      angleRange: {
        start: 45,
        end: 315
      }
    }});
    

    | apply angleRange | with theme | | :---: | :---: | | gauge-angleRange | gauge-angleRange-with-theme |

    series.solid options The solid option is available when there is only one series. If set to solid: true, the a clockhand are not displayed by default. If you want to display the clockhand, set solid.clockHand: true.

    const chart = new GaugeChart({el, data, {
      ...
      solid: true
      // or
      solid: {
        clockHand: true // defat: false
      }
    }});
    

    | with clockHand | with dataLabels | | :---: | :---: | | gauge-solid-with-theme | gauge-solid-with-datalabels |

    Guide

    Source code(tar.gz)
    Source code(zip)
  • v4.2.1(Mar 30, 2021)

    Bug Fixes

    • Fix the coordinate chart was not rendered properly.(#641, #628, #634)
    • Fix range plot bands not rendering properly. (#635)
    • Fix chart not rendering properly in webpack5. (#619)
    • Fix the theme was not applied when calling the selectSeries API. (#639)
    • Fix the chart was not drawn properly when setData in the no data state(#629)
    Source code(tar.gz)
    Source code(zip)
  • v4.2.0(Mar 17, 2021)

    New Features

    Legend Item Ellipsis(#614)

    Controls the width and overflow options of the legend item. If a value is given to item.width and the overflow setting is not specified, overflow:'ellipsis' is applied.

    const options = {
      legend: {
        item: {
          width: 40,
          overflow: 'ellipsis'
        }
      }
    };
    

    image

    No Data Layer(#607)

    No Data Text is options for displaying a message like "No data to display".

    Default

    image

    lang Options

    The default text value is "No data to display". Use options.lang.noData when you want to process i18n or change the text.

    const options = {
      lang: {
        noData: '😭No Data!!😭',
      },
    }
    

    image

    theme

    The following is a list of themes that can be modified in the No Data Text.

    const options = {
      theme: {
        noData: {
          fontSize: 30,
          fontFamily: 'Verdana',
          fontWeight: 'bold',
          color: '#3ee',
        }
      }
    }
    
    interface NoDataTheme {
      fontSize?: number;
      fontFamily?: string;
      fontWeight?: string | number;
      color?: string;
    }
    

    image

    Bug Fixes

    • Fix Cross-Site Scripting Vulnerability (#604, #618) (📣 @arjunshibu Thanks for CONTRIBUTING!)
    • Fix the spectrum legend layout was not properly exposed (#626)
    Source code(tar.gz)
    Source code(zip)
  • v4.1.4(Mar 9, 2021)

  • v4.1.3(Feb 25, 2021)

  • v4.1.2(Feb 24, 2021)

    Bug fixes

    • add react-wrapper style props for responsive options(#595)
    • Fix coordinate type hide all series then show a series throws error(#593)

    Enhancement

    • radial bar visible data options(#588)
    Source code(tar.gz)
    Source code(zip)
  • v4.1.1(Feb 19, 2021)

  • v4.1.0(Feb 18, 2021)

    New Features

    A new chart type, the RadialBar chart announced 🎉

    It supports options such as clockwise, angleRange, radiusRange, etc. Use these options to display your own charts. This new chart has circularAxis, verticalAxis. In addition, Radar Chart has improved the concept of the previously ambiguous axis, and uses CircularAxis and verticalAxis.

    selectable and eventDetectType options The selectable option makes the series selectable and defines how to detect the series through the mouse with eventDetectType.

    const chart = new RadialBarChart({el, data, {
      series: {
        selectable: true,          // default: false
        eventDetectType: 'grouped' // default: 'point',
      }
    }});
    

    | point | grouped | | :---: | :---: | | radialbar-point | radialbar-grouped |

    clockwise options Determines the direction in which the series is painted.

    const chart = new RadialBarChart({el, data, {
      series: {
        clockwise: false,          // default: true
      }
    }});
    

    | clockwise | counter clockwise | | :---: | :---: | | radialbar-clockwise | radialbar-counterclockwise |

    angleRange options The angleRange uses start and end options to determine the range of the arc.

    const chart = new RadialBarChart({el, data, {
      ...
      series: {
        angleRange: {
          start: 45,
          end: 315
        }
      }
    }});
    

    | angleRange | with theme | | :---: | :---: | | radialBar-angleRange | radialbar-angleRange-theme |

    radiusRange options The radiusRange uses inner and outer options to define the radii of inner and outer circles.

    const chart = new RadialBarChart({el, data, {
      series: {
        radiusRange: {
          inner: 50,
          outer: '90%'
        }
      }
    }});
    

    | radiusRange | with theme | | :---: | :---: | | radialbar-radiusRange | radialbar-radiusrange-theme |

    Guide

    addOutlier API (#557)

    Using addOutlier(), you can add new outlier data to the BoxPlot chart.

    public addOutlier(seriesIndex: number, outliers: number[][])
    
    /* example */
    const boxPlotChart = new BoxPlotChart({ el, data, options });
    
    boxPlotChart.addOutlier(1, [[1, 50], [3, 30]]);
    

    Data visible options

    • Compatible with: Line, Area, LineArea, Bar, Column, ColumnLine, Bullet, BoxPlot, Scatter, LineScatter, Bubble, Pie, NestedPie, Radar

    ⚠️ RadialBar chart will be supported in 4.1.1

    Each series can have visible option. The visible option determines whether the series is displayed when the chart is first drawn. The default is true. Both basic chart and range chart use the same way.

    const data = {
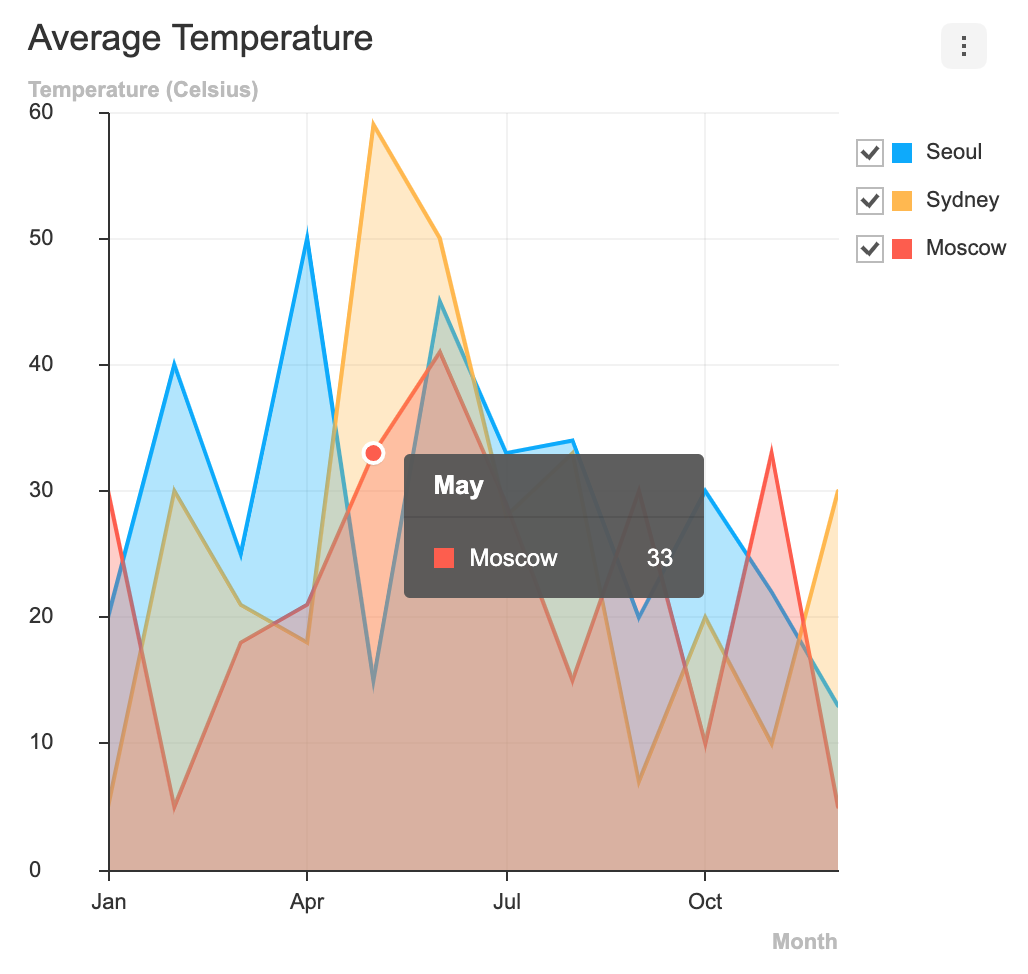
      categories: ['Jan', 'Feb', 'Mar', 'Apr', 'May', 'Jun'],
      series: [
        {
          name: 'Seoul',
          data: [20, 40, 25, 50, 15, 45],
          visible: false,
        },
      ],
    }
    

    Bug Fixes

    • Fix bug where colors are not properly exposed when there are more than 27 series(#555)
    • Automatically change the legend layout when the number of series is large.(#562)
    • Fix bug where the container's width and height were not specified and when 'auto' was used(#568)
    • Remove alias used when importing types(#561)
    • Fix bug that the position was not properly exposed when scrolling the export menu.(#578)
    • Fix bug where the data of the selected series was not provide selectSeries()(#582)
    Source code(tar.gz)
    Source code(zip)
  • v4.0.4(Feb 3, 2021)

  • v4.0.3(Jan 29, 2021)

    Bug Fixes

    • a47af549e851ec1dd0ebd85fa99932f1e38c40f3 Change the sideEffects setting, set the css file with side effects not to be tree shaken.
    Source code(tar.gz)
    Source code(zip)
  • v3.11.3(Jan 29, 2021)

    bugfixes

    • Fixed a bug where tickInterval auto did not work properly in the line chart when there is no initial data and when data is defined with setData afterwards
    • Add custom tooltip data color information
    • Fixed a bug where data labels were not exposed when using line chart null data
    Source code(tar.gz)
    Source code(zip)
  • v4.0.2(Jan 28, 2021)

  • v4.0.1(Jan 26, 2021)

    🎊 TOAST UI Chart 4.0 is here! 🎊

    TOAST UI Chart v3 was developed based on svg and raphael.js. We supported and were loved by a wide range of browsers from IE8 to more modern browsers. However, as time passed, raphael.js stopped updating, and we needed to find a new solution to continue building the Chart. TOAST UI Chart team removed all of the dependencies and rebuilt the entire product based on canvas from scratch in order to make the Chart lighter.

    As we kick off the new year 2021, we would like to introduce the brand-new TOAST UI Chart. Now, let's take a look at each and every change!

    👀 What's new?

    📌 Lighter Chart

    TOAST UI Chart v4.0 removed all of the dependencies including raphael.js and TOAST UI Code Snippet and replaced it with our own reactive system.

    • Refer to https://bundlephobia.com/result?p=@toast-ui/chart

    Furthermore, with the ESM build support, users can pick out the charts as necessary and use the Chart more efficiently.

    📌 Features Made Easier

    responsive

    The responsive option allows users to define chart options according to the changes in the chart's width or height and even manage the animation play speed.

    const options = {
      ...
      responsive: {
        animation: { duration: 300 },
        rules: [
          {
            condition: ({ width, height }) => {
              // Apply the following options when the width is below 500px and the height is below 400px.
              return w <= 500 && h <= 400;
            },
            options: {
              chart: { title: '' },
              legend: {
                visible: false
              },
              exportMenu: {
                visible: false
              }
            }
          }
        ]
      }
    };
    

    Users can use this option to change the position of the legend, change the interval between ticks or labels, and much more custom options according to the size of the chart rendered.

    image

    Live Update

    Live Update feature can be used to update the chart according to the chart's size when new data is added in real time. The feature that was only supported with Line Chart in TOAST UI Chart v3.x is now supported with Area, Line, Heatmap, LineArea, Column, and ColumnLine charts.

    | Area | Line | Heatmap | |--- | --- | --- | | area | live update line | heatmap |

    | LineArea | Column | ColumnLine | |--- | --- | --- | | lineArea | column | columnline |

    Use the Live Update features to make your data come to life!

    Even More Themes and Layout Configurations

    In order to make the charts blend into the styles of users' services, we are offering a wider variety of theme options than we did with v3.x. Users now have the ability to change styles like color, width, format not only for the series but also for other components like axes, legends, plots, and more!

    Additionally, users can control not only the size of the entire chart but also the widths and heights of specific components in order to make the chart's layout more suitable for the page.

    const options = {
      xAxis: {
        width: 700,
        height: 100
      },
      yAxis: {
        width: 100,
        height: 350,
      },
      legned: {
        width: 200
      }
    };
    

    Use the themes and layout options to customize your charts!

    📌 Easier Development

    TOAST UI Chart v4.0 is written in TypeScript and is of the Mono-repo format that uses Lerna. Any developer who wishes to contribute to the TOAST UI Chart can understand the code through types and due to the fact that there are multiple Github issues in a single repository.

    ✈️ Migration Guide

    Are you already using TOAST UI Chart v3.x? Then we have put together a migration guide just for you. Check out the changes by stages and apply them!

    • English(🇺🇸): https://github.com/nhn/tui.chart/blob/next/docs/v4.0-migration-guide-en.md
    • Korean(🇰🇷): https://github.com/nhn/tui.chart/blob/next/docs/v4.0-migration-guide-ko.md
    Source code(tar.gz)
    Source code(zip)
  • v3.11.2(Apr 22, 2020)

    Bugfixes

    • Apply Heatmap border color, width theme option(#292)
    • Apply Legend label color on spectrumLegend theme option(#292)
    var theme = {
        series: {
            startColor: '#ffefef',
            endColor: '#ac4142',
            borderColor: '#fff', // heatmap border color
            borderWidth: 2 // heatmap border width
        },
        legend: {
            label: {
                color: 'blue' // heatmap / treemap spectrum font color
            }
        }
    };
    
    • Recalculate legend pagination button when calling setData(#293)
    • Reset prevXData when calling setData For applying tickInterval(#294)
    Source code(tar.gz)
    Source code(zip)
  • v3.11.1(Apr 3, 2020)

  • v3.11.0(Mar 31, 2020)

    Features

    image

    • column chart connector(#279)
      • deprecate stackType option
      • add new stack option
    const options = {
      series: {
        stack: 'normal' | 'percent',
        // or
        stack: {
          type: 'normal' | 'percent',
          connector: boolean,  // default: false
          // or
          connector: {
            type: 'solid' | 'dotted', // default: solid
            color: string, // default: #aaa
            width: number // default: 1
          }
        }
      }
    }
    

    Enhancement

    • Change the order of stack column chart legend (#279)
    Source code(tar.gz)
    Source code(zip)
  • v3.10.2(Mar 20, 2020)

  • v3.10.1(Mar 4, 2020)

    Enhancement

    • remove babel-polyfill, use core-js directly(#263)

    | file name | before size | after size | variance | etc | | --- | --- | --- | --- | --- | | tui-chart.js | 1.61MB | 1.65MB | 40KB ↗️ | include tui.code-snippet | | tui-chart-polyfill.js | 1.88MB | 1.73MB | 160KB ↘️ | use core-js directly | | tui-chart-all.js | 2.09MB | 1.82MB | 270KB ↘️ | decrease code-snippet size 70KB |

    Bugfixes

    • Fix group tooltip render properly with xAxis pointOnColumn option(#260)
    • Fix line-scatter combo chart mouse event detecting Bug(#254)
    Source code(tar.gz)
    Source code(zip)
  • v3.10.0(Feb 3, 2020)

    Features

    • destroy API
      • Destroys the chart instance.
      var chart = new LineChart({ ... });
      
      chart.destroy();
      

    Enhancement

    • add series animation duration options(#203)
      • except radial, map, box, dynamically line type chart
      • default: true
    const options = {
      series: {
        animation: false
      }
    }
    // or
    
    const options = {
      series: {
        animation: {
          duration: 0 // number
        }
      }
    }
    
    • add animation parameter to setData
    chart.setData(rawData, false); // off animation
    chart.setData(rawData, {duration: 1000}); // set animation duration
    
    • Improving tooltip(#255)
      • reduce tooltip animation duration
      • Fixed event detection on tooltips
      • Change bound area from 50 to chart tick interval

    Bugfixes

    • Fixed that YAxis is moved when set rotateLabel false(#245)
    Source code(tar.gz)
    Source code(zip)
This plugin for Chart.js that makes your bar chart to 100% stacked bar chart.

chartjs-plugin-stacked100 This plugin for Chart.js that makes your bar chart to 100% stacked bar chart. Requires Chart.js 3.x. Demo: https://y-takey.g

y-take 106 Jan 3, 2023
Timeline/Graph2D is an interactive visualization chart to visualize data in time.

vis-timeline The Timeline/Graph2D is an interactive visualization chart to visualize data in time. The data items can take place on a single date, or

vis.js 1.2k Jan 3, 2023
A Simple Dashboard Chart in Laravel Nova using Chart JS

A Simple Dashboard Chart in Laravel Nova using Chart JS. Starting create your own dashboard with Chart JS Integration can save your time and help you maintain consistency across standard elements such as Bar, Stacked, Line, Area, Doughnut and Pie Chart.

Kuncoro Wicaksono 177 Jan 4, 2023
Chart.js plugin to defer initial chart updates

Chart.js plugin to defer initial chart updates until the user scrolls and the canvas appears inside the viewport, and thus trigger the initial chart a

Chart.js 97 Nov 9, 2022
Bar Funnel Chart extension for Chart.js

Chart.BarFunnel.js Provides a Bar Funnel Chart for use with Chart.js Documentation To create a Bar Funnel Chart, include Chart.BarFunnel.js after Char

Chart.js 58 Nov 24, 2022
TradeX-chart is a trade chart written in plain (vanilla) JavaScript with minimal dependencies

TradeX-chart is a trade chart written in plain (vanilla) JavaScript with minimal dependencies; use it with any framework or backend.

null 24 Dec 12, 2022
Beautiful charts for Angular based on Chart.js

ng2-charts slack Beautiful charts for Angular based on Chart.js Usage & Demo Samples using ng2-charts https://valor-software.com/ng2-charts/ Installat

Valor Software 2.2k Jan 4, 2023
Apache Superset is a Data Visualization and Data Exploration Platform

Superset A modern, enterprise-ready business intelligence web application. Why Superset? | Supported Databases | Installation and Configuration | Rele

The Apache Software Foundation 49.9k Dec 31, 2022
DataSphereStudio is a one stop data application development& management portal, covering scenarios including data exchange, desensitization/cleansing, analysis/mining, quality measurement, visualization, and task scheduling.

English | 中文 Introduction DataSphere Studio (DSS for short) is WeDataSphere, a big data platform of WeBank, a self-developed one-stop data application

WeBankFinTech 2.4k Jan 2, 2023
API to generate candlestick chart data for any time period based on transactions data

candel-maker API to generate candlestick chart data for any time period based on transactions data Installation clone repo git clone https://github.co

null 2 Aug 18, 2022
Apache ECharts is a powerful, interactive charting and data visualization library for browser

Apache ECharts Apache ECharts is a free, powerful charting and visualization library offering an easy way of adding intuitive, interactive, and highly

The Apache Software Foundation 53.8k Jan 9, 2023
Data Visualization Components

react-vis | Demos | Docs A COMPOSABLE VISUALIZATION SYSTEM Overview A collection of react components to render common data visualization charts, such

Uber Open Source 8.4k Jan 2, 2023
📊 A highly interactive data-driven visualization grammar for statistical charts.

English | 简体中文 G2 A highly interactive data-driven visualization grammar for statistical charts. Website • Tutorial Docs • Blog • G2Plot G2 is a visua

AntV team 11.5k Dec 30, 2022
Data visualization library for depicting quantities as animated liquid blobs

liquidity.js A data visualization library for depicting quantities as animated liquid blobs. For a demonstration of what the final product can look li

N Halloran 91 Sep 20, 2022
Powerful data visualization library based on G2 and React.

BizCharts New charting and visualization library has been released: http://bizcharts.net/products/bizCharts. More details about BizCharts Features Rea

Alibaba 6k Jan 3, 2023
A data visualization framework combining React & D3

Semiotic is a data visualization framework combining React & D3 Interactive Documentation API Docs on the wiki Examples Installation npm i semiotic E

nteract 2.3k Dec 29, 2022
🌏 A Declarative 3D Globe Data Visualization Library built with Three.js

Gio.js English | 中文 React Version: react-giojs Wechat minigame: wechat usage Gio.js is an open source library for web 3D globe data visualization buil

syt123450 1.6k Dec 29, 2022
📊 Data visualization library for React based on D3

Data visualization library for React based on D3js REAVIZ is a modular chart component library that leverages React natively for rendering the compone

REAVIZ 740 Dec 31, 2022
Location Intelligence & Data Visualization tool

What is CARTO? CARTO is an open, powerful, and intuitive platform for discovering and predicting the key insights underlying the location data in our

CARTO 2.6k Dec 31, 2022