36 Repositories
JavaScript charting Libraries
A server-side-rendered charting library for Fresh
fresh_charts A server side rendered charting library for Fresh based on Chart.js. Usage There are two main ways to render a chart. There is the JSX/TS
An easy-to-use cross-framework JS charting library

Compact Chart Visualize your data under a minute, in any Javascript framework Table of Contents About How to use it Examples Demo Plain HTML Example w
📱📈An elegant, interactive and flexible charting library for mobile.

F2,一个专注于移动,开箱即用的可视化解决方案,完美支持 H5 环境同时兼容多种环境(node, 小程序,weex)。完备的图形语法理论,满足你的各种可视化需求。专业的移动设计指引为你带来最佳的移动端图表体验。英文 README 在此衷心感谢《The Grammar of Graphics》的作者
Highcharts JS, the JavaScript charting framework
Highcharts JS is a JavaScript charting library based on SVG, with fallbacks to VML and canvas for old browsers. Official website: www.highcharts.com D
Simple yet flexible JavaScript charting for designers & developers
Simple yet flexible JavaScript charting for designers & developers Documentation All the links point to the new version 3 of the lib. Introduction Get
An open-source visualization library specialized for authoring charts that facilitate data storytelling with a high-level action-driven grammar.

Narrative Chart Introduction Narrative Chart is an open-source visualization library specialized for authoring charts that facilitate data storytellin
Chart.js Box Plots and Violin Plot Charts

Chart.js Box and Violin Plot Chart.js module for charting box and violin plots. This is a maintained fork of @datavisyn/chartjs-chart-box-and-violin-p
Chart.js module for charting financial securities
Chart.js Financial Charting Chart.js module for Candlestick and OHLC charts Roadmap Chart.js 2.7.0 added our timeseries scale as new option called dis
Simple yet flexible charting Lightning Web Component using Chart.js for admins & developers
Lightning Web Chart.js Component Simple yet flexible charting Lightning Web Component using Chart.js for admins & developers Documentation Getting sta
React components for Chart.js, the most popular charting library
react-chartjs-2 React components for Chart.js, the most popular charting library. Supports Chart.js v3 and v2. Quickstart • Docs • Slack • Stack Overf
Liquify charting library

Liquify Liquify: fast, multi-threaded visualization of stream data with ChartJS & Angular. The aim of Liquify is to provide a fast, customizable and e
Free, open-source crypto trading bot, automated bitcoin / cryptocurrency trading software, algorithmic trading bots. Visually design your crypto trading bot, leveraging an integrated charting system, data-mining, backtesting, paper trading, and multi-server crypto bot deployments.

Free, open-source crypto trading bot, automated bitcoin / cryptocurrency trading software, algorithmic trading bots. Visually design your crypto trading bot, leveraging an integrated charting system, data-mining, backtesting, paper trading, and multi-server crypto bot deployments.
Smoothie Charts: smooooooth JavaScript charts for realtime streaming data
Smoothie Charts is a really small charting library designed for live streaming data. I built it to reduce the headaches I was getting from watching ch
Open-source JavaScript charting library behind Plotly and Dash
Plotly.js is a standalone Javascript data visualization library, and it also powers the Python and R modules named plotly in those respective ecosyste
Apache ECharts is a powerful, interactive charting and data visualization library for browser
Apache ECharts Apache ECharts is a free, powerful charting and visualization library offering an easy way of adding intuitive, interactive, and highly
Analytical Web Apps for Python, R, Julia, and Jupyter. No JavaScript Required.

Dash Dash is the most downloaded, trusted Python framework for building ML & data science web apps. Built on top of Plotly.js, React and Flask, Dash t
JavaScript library for HTML5 & CSS3 time sheets
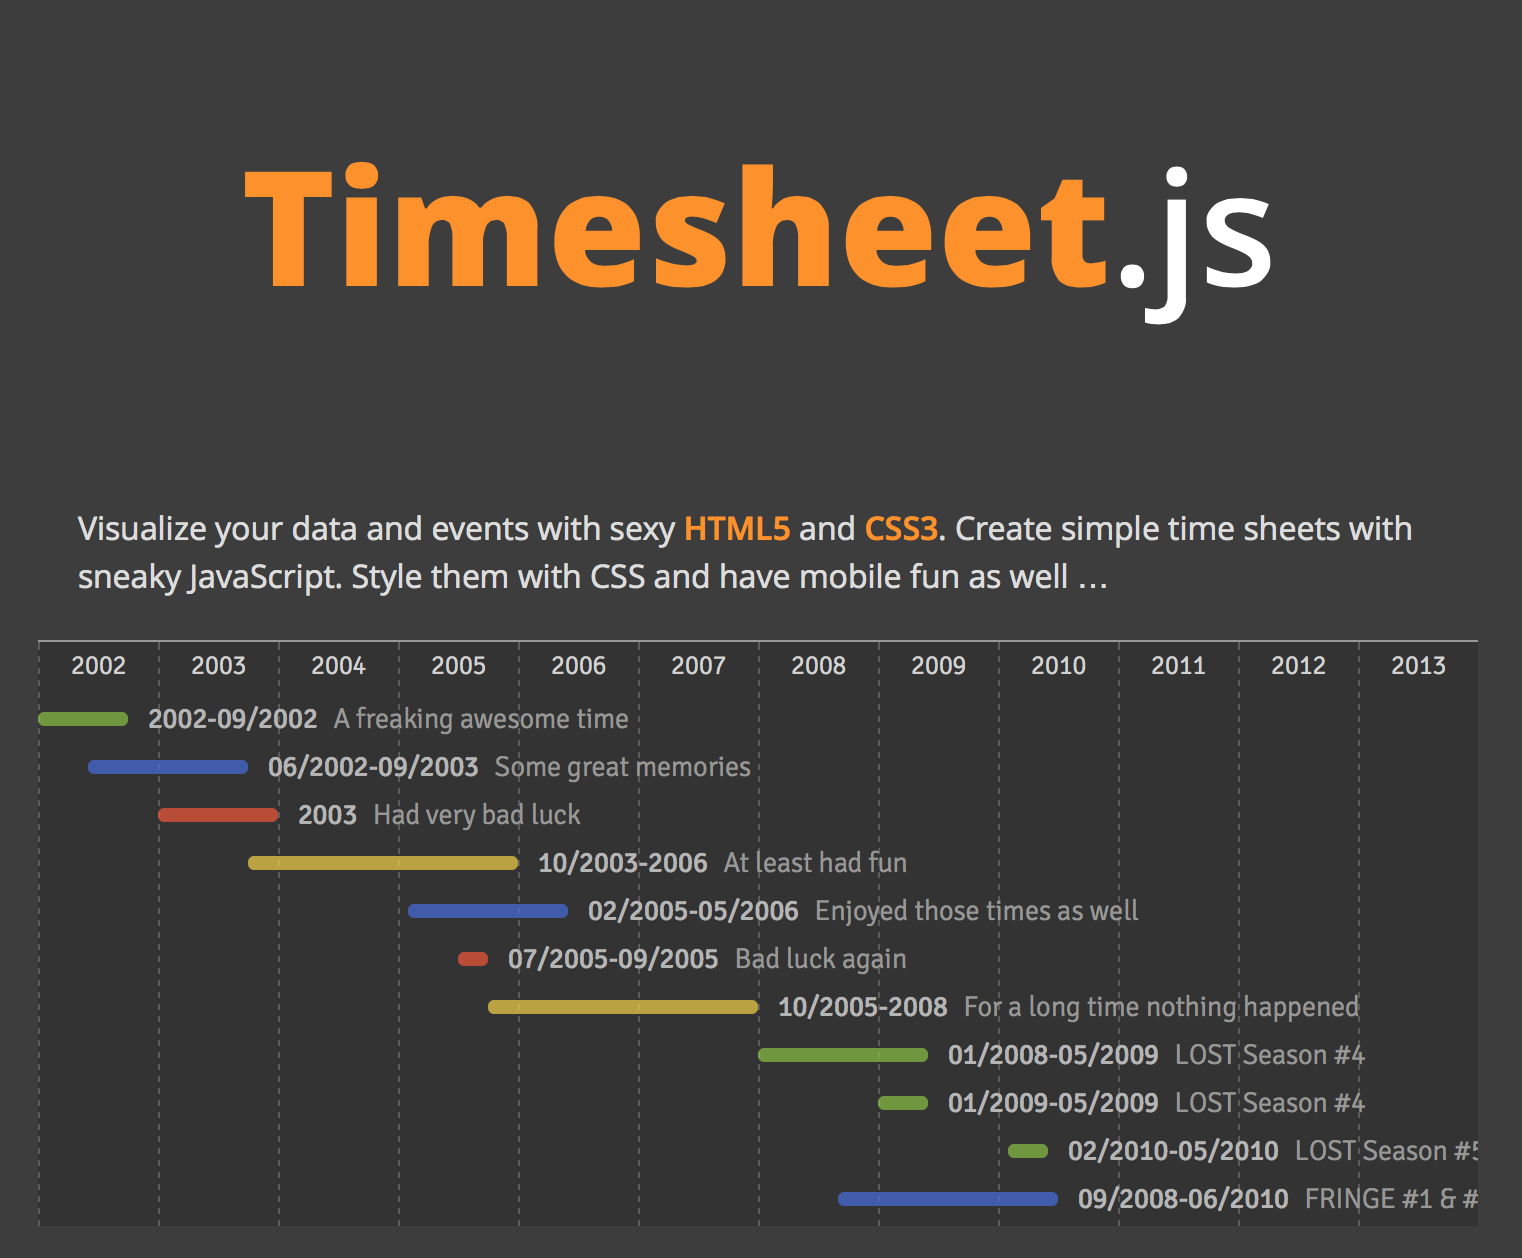
Timesheet.js Simple JavaScript library to create HTML time sheets. Wrapped in an example project using Middleman … You only have to include dist/times
📱📈An elegant, interactive and flexible charting library for mobile.

中文 README F2 is born for mobile, developed for developers as well as designers. It is Html5 Canvas-based, and is also compatible with Node.js, Weex an
The best JavaScript Data Table for building Enterprise Applications. Supports React / Angular / Vue / Plain JavaScript.

Module SonarCloud Status ag-grid-community ag-grid-enterprise AG Grid AG Grid is a fully-featured and highly customizable JavaScript data grid. It del
Data Visualization Components

react-vis | Demos | Docs A COMPOSABLE VISUALIZATION SYSTEM Overview A collection of react components to render common data visualization charts, such
Redefined chart library built with React and D3
Recharts Introduction Recharts is a Redefined chart library built with React and D3. The main purpose of this library is to help you to write charts i
:bar_chart: A library of modular chart components built on D3
Plottable Plottable is a library of chart components for creating flexible, custom charts for websites. It is built on top of D3.js and provides highe
Interactive visualizations of time series using JavaScript and the HTML canvas tag

dygraphs JavaScript charting library The dygraphs JavaScript library produces interactive, zoomable charts of time series: Learn more about it at dygr
Financial lightweight charts built with HTML5 canvas
Lightweight Charts Demos | Documentation | Discord community TradingView Lightweight Charts are one of the smallest and fastest financial HTML5 charts
:bar_chart: Declarative Charting Framework for Angular
ngx-charts Declarative Charting Framework for Angular! ngx-charts is unique because we don't merely wrap d3, nor any other chart engine for that matte
Reusable JavaScript library for creating sketchy/hand-drawn styled charts in the browser.

roughViz.js is a reusable JavaScript library for creating sketchy/hand-drawn styled charts in the browser, based on D3v5, roughjs, and handy. Why? Use
Simple yet powerful JavaScript Charting library built using d3.js
uvCharts Simple, robust, extensible JavaScript charting library built using d3 designed to help developers embed, build charts in less than couple of
Ember Charts 3.5 2.3 L2 JavaScript A powerful and easy to use charting library for Ember.js
Ember Charts A charting library built with the Ember.js and d3.js frameworks. It includes time series, bar, pie, and scatter charts which are easy to
:dango: An interactive and responsive charting library
English | 简体中文 G2Plot A charting library based on the Grammar of Graphics. G2Plot is an interactive and responsive charting library. Based on the gram
Multi-Dimensional charting built to work natively with crossfilter rendered with d3.js
dc.js Dimensional charting built to work natively with crossfilter rendered using d3.js. In dc.js, each chart displays an aggregation of some attribut
A reusable charting library written in d3.js
NVD3 - A reusable D3 charting library Inspired by the work of Mike Bostock's Towards Reusable Charts, and supported by a combined effort of Novus and
Data Visualization Components
react-vis | Demos | Docs A COMPOSABLE VISUALIZATION SYSTEM Overview A collection of react components to render common data visualization charts, such
Highcharts JS, the JavaScript charting framework
Highcharts JS is a JavaScript charting library based on SVG, with fallbacks to VML and canvas for old browsers. Official website: www.highcharts.com D
Redefined chart library built with React and D3
Recharts Introduction Recharts is a Redefined chart library built with React and D3. The main purpose of this library is to help you to write charts i
Simple responsive charts
Big welcome by the Chartist Guy Checkout the documentation site at http://gionkunz.github.io/chartist-js/ Checkout this lightning talk that gives you
Apache ECharts is a powerful, interactive charting and data visualization library for browser
Apache ECharts Apache ECharts is a free, powerful charting and visualization library offering an easy way of adding intuitive, interactive, and highly