16 Repositories
JavaScript diagrams Libraries
Random Fractals stash of Observable Data Tools 🛠️ and Notebooks 📚 in ES Modules .js, .nb.json, .ojs, .omd, .html and .qmd document formats for Data Previews

Random Fractals stash of Observable Data Tools 🛠️ and Notebooks 📚 in ES Modules .js, .nb.json, .ojs, .omd, .html and .qmd document formats for Data Previews in a browser and in VSCode IDE with Observable JS extension, Quarto extension, and new Quarto publishing tools.
The minimal javascript library to create flowcharts ✨
Flowy A javascript library to create pretty flowcharts with ease ✨ Dribbble | Twitter | Live demo Flowy makes creating WebApps with flowchart function
A lightweight SolidJS component for building interactive node-based diagrams and graphs.
Convert Your Ideas To A Simple And Excitig Journay With Odysea! Odysea A lightweight and minimal Solid component for building interactive graphs and n
A JavaScript library for visualizing Sankey diagrams.
SanKEY.js v1.0.0 last updated: 20.07.2022 Getting started SanKEY.js is a JavaScript data visualization library that provides a simple object-oriented
A lightweight SolidJS component for building interactive node-based diagrams and graphs.
Convert Your Ideas To Graphs With Solid Graph! Solid Graph A lightweight and minimal Solid component for building interactive graphs and node-based ed
A CLI tool to embed interactive PUML diagrams to your github markdown files.
puml-for-markdown Simple CLI Usage Just run puml-for-markdown in any directory where you have markdown files and it will render links to PlantUML file
Plugin that lets you create diagrams from textual representation (aka 'Diagrams as Code') within Logseq

Logseq - Diagrams as Code Plugin that lets you create diagrams (and other visualizations) from textual representation (aka 'Diagrams as Code') within
Action to Mermaid
Action to Mermaid ▶️ to 🧜♀️ About Now that GitHub renders Mermaid diagrams, here is a GitHub action that generates a Mermaid diagram out of an actio
Pintora is an extensible javascript text-to-diagrams library that works in both browser and Node.js.
Pintora Documentation | Live Editor Pintora is an extensible javascript text-to-diagrams library that works in both browser and Node.js. Expressing yo
Export Diagrams.net diagrams during Dendron site publishing
Export Diagrams.net diagrams during Dendron site publishing Node module for exporting Diagrams.net (Draw.io) diagrams embedded in a published Dendron
Chart.js module for creating sankey diagrams

chartjs-chart-sankey Chart.js v3.3.x module for creating sankey diagrams Browser support All modern and up-to-date browsers are supported, including,
Chart.js Venn and Euler Diagrams
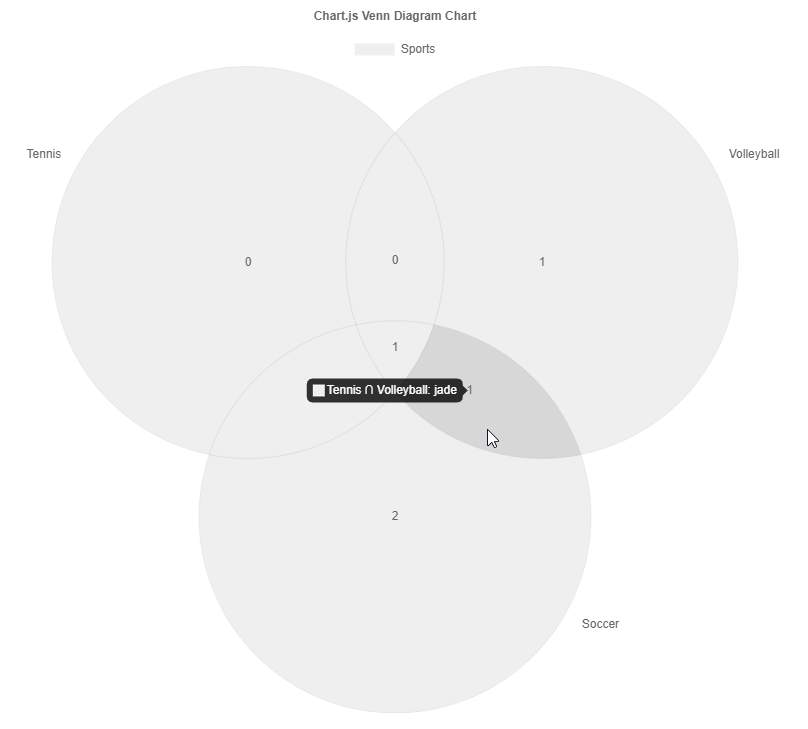
Chart.js Venn and Euler Diagram Chart Chart.js module for charting venn diagrams with up to five sets. Adding new chart type: venn and euler. Related
📊 Vue.js wrapper for Chart.js

vue-chartjs vue-chartjs is a wrapper for Chart.js in vue. You can easily create reuseable chart components. Demo & Docs 📺 Demo 📖 Docs Compatibility
Diagram-maker - A library to display an interactive editor for any graph-like data.

Diagram Maker Diagram Maker is a library to display an interactive editor for any graph-like data. Following is a screenshot from one of the consumers
a super simple, no-nonsense diagramming library written in react that just works
Introduction DEMO: http://projectstorm.cloud/react-diagrams DOCS (wip) https://projectstorm.gitbook.io/react-diagrams Docs are currently being worked
JavaScript diagramming library for interactive flowcharts, org charts, design tools, planning tools, visual languages.
GoJS, a JavaScript Library for HTML Diagrams GoJS is a JavaScript and TypeScript library for creating and manipulating diagrams, charts, and graphs. S