115 Repositories
JavaScript interactive-diagrams Libraries
🌈 React for interactive command-line apps
React for CLIs. Build and test your CLI output using components. Ink provides the same component-based UI building experience that React offers in the
An interactive git visualization and tutorial. Aspiring students of git can use this app to educate and challenge themselves towards mastery of git!

LearnGitBranching LearnGitBranching is a git repository visualizer, sandbox, and a series of educational tutorials and challenges. Its primary purpose
:fireworks:Interactive Online Platform that Visualizes Algorithms from Code
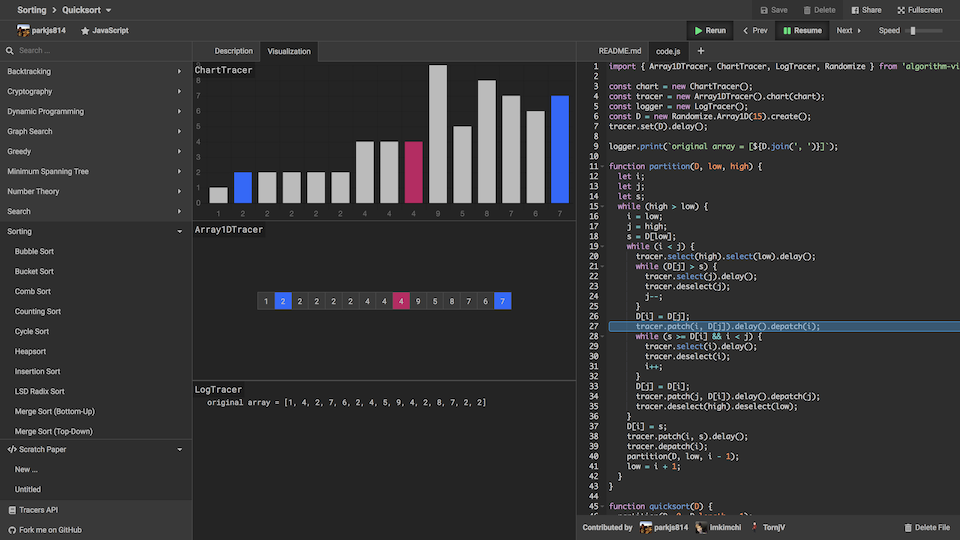
Algorithm Visualizer Algorithm Visualizer is an interactive online platform that visualizes algorithms from code. Learning an algorithm gets much easi
Composable data visualisation library for web with a data-first approach now powered by WebAssembly
What is Muze? Muze is a free data visualization library for creating exploratory data visualizations (like Tableau) in browser, using WebAssembly. It
Interactive visualizations of time series using JavaScript and the HTML canvas tag

dygraphs JavaScript charting library The dygraphs JavaScript library produces interactive, zoomable charts of time series: Learn more about it at dygr
a super simple, no-nonsense diagramming library written in react that just works
Introduction DEMO: http://projectstorm.cloud/react-diagrams DOCS (wip) https://projectstorm.gitbook.io/react-diagrams Docs are currently being worked
vizflow is an ES6 interactive visualization engine

Vizflow vizflow.js - a render-loop library written using EcmaScript.6 (ES6) with no other external dependencies. Vizflow is a relatively small library
:dango: An interactive and responsive charting library
English | 简体中文 G2Plot A charting library based on the Grammar of Graphics. G2Plot is an interactive and responsive charting library. Based on the gram
🔥 JavaScript Library for HTML5 canvas based heatmaps
heatmap.js Dynamic Heatmaps for the Web. How to get started The fastest way to get started is to install heatmap.js with bower. Just run the following
JavaScript toolkit for creating interactive real-time graphs
Rickshaw Rickshaw is a JavaScript toolkit for creating interactive time series graphs, developed at Shutterstock Table of Contents Getting Started Ins
JavaScript diagramming library for interactive flowcharts, org charts, design tools, planning tools, visual languages.
GoJS, a JavaScript Library for HTML Diagrams GoJS is a JavaScript and TypeScript library for creating and manipulating diagrams, charts, and graphs. S
:bar_chart: A D3-based reusable chart library
c3 c3 is a D3-based reusable chart library that enables deeper integration of charts into web applications. Follow the link for more information: http
📊 A highly interactive data-driven visualization grammar for statistical charts.

English | 简体中文 G2 A highly interactive data-driven visualization grammar for statistical charts. Website • Tutorial Docs • Blog • G2Plot G2 is a visua
Apache ECharts is a powerful, interactive charting and data visualization library for browser
Apache ECharts Apache ECharts is a free, powerful charting and visualization library offering an easy way of adding intuitive, interactive, and highly
Responsive, interactive and more accessible HTML5 canvas elements. Scrawl-canvas is a JavaScript library designed to make using the HTML5 canvas element a bit easier, and a bit more fun!
Scrawl-canvas Library Version: 8.5.2 - 11 Mar 2021 Scrawl-canvas website: scrawl-v8.rikweb.org.uk. Do you want to contribute? I've been developing thi