132 Repositories
JavaScript off-canvas Libraries
Javascript Canvas Library, SVG-to-Canvas (& canvas-to-SVG) Parser

Fabric.js Fabric.js is a framework that makes it easy to work with HTML5 canvas element. It is an interactive object model on top of canvas element. I
Luckysheet is an online spreadsheet like excel that is powerful, simple to configure, and completely open source.
English| 简体中文 Introduction 🚀 Luckysheet is an online spreadsheet like excel that is powerful, simple to configure, and completely open source. Links
The best javascript plugin for app look-alike on- and off-canvas menus with sliding submenus for your website and webapp.
mmenu.js The best javascript plugin for app look-alike on- and off-canvas menus with sliding submenus for your website and webapp. It is very customiz
:woman: Library for image processing
Lena.js Tiny library for image processing. Install via NPM npm install lena.js --save Install via yarn yarn add lena.js Run demo yarn demo Demo htt
🦍• [Work in Progress] React Renderer to build UI interfaces using canvas/WebGL
![🦍• [Work in Progress] React Renderer to build UI interfaces using canvas/WebGL](https://github.com/raphamorim/react-ape/raw/master/assets/demo-ps-vita.jpg)
React Ape React Ape is a react renderer to build UI interfaces using canvas/WebGL. React Ape was built to be an optional React-TV renderer. It's mainl
React + Canvas = Love. JavaScript library for drawing complex canvas graphics using React.
React Konva React Konva is a JavaScript library for drawing complex canvas graphics using React. It provides declarative and reactive bindings to the
🍞🎨 Full-featured photo image editor using canvas. It is really easy, and it comes with great filters.

Full featured image editor using HTML5 Canvas. It's easy to use and provides powerful filters. Packages toast-ui.image-editor - Plain JavaScript compo
A library for visualization and creative-coding

Pts Pts is a typescript/javascript library for visualization and creative-coding. Get started at ptsjs.org. Please give it a try, file issues, and sen
A cross platform high-performance graphics system.
spritejs.org Spritejs is a cross platform high-performance graphics system, which can render graphics on web, node, desktop applications and mini-prog
Konva.js is an HTML5 Canvas JavaScript framework that extends the 2d context by enabling canvas interactivity for desktop and mobile applications.
Konva Konva is an HTML5 Canvas JavaScript framework that enables high performance animations, transitions, node nesting, layering, filtering, caching,
📱📈An elegant, interactive and flexible charting library for mobile.

中文 README F2 is born for mobile, developed for developers as well as designers. It is Html5 Canvas-based, and is also compatible with Node.js, Weex an
Flat, round, designer-friendly pseudo-3D engine for canvas & SVG
Zdog Round, flat, designer-friendly pseudo-3D engine View complete documentation and live demos at zzz.dog. Install Download zdog.dist.min.js minified
Create graphics with a hand-drawn, sketchy, appearance
Rough.js Rough.js is a small (9 kB) graphics library that lets you draw in a sketchy, hand-drawn-like, style. The library defines primitives to draw
nivo provides a rich set of dataviz components, built on top of the awesome d3 and Reactjs libraries

nivo provides supercharged React components to easily build dataviz apps, it's built on top of d3. Several libraries already exist for React d3 integr
HTML5 Canvas Gauge. Tiny implementation of highly configurable gauge using pure JavaScript and HTML5 canvas. No dependencies. Suitable for IoT devices because of minimum code base.
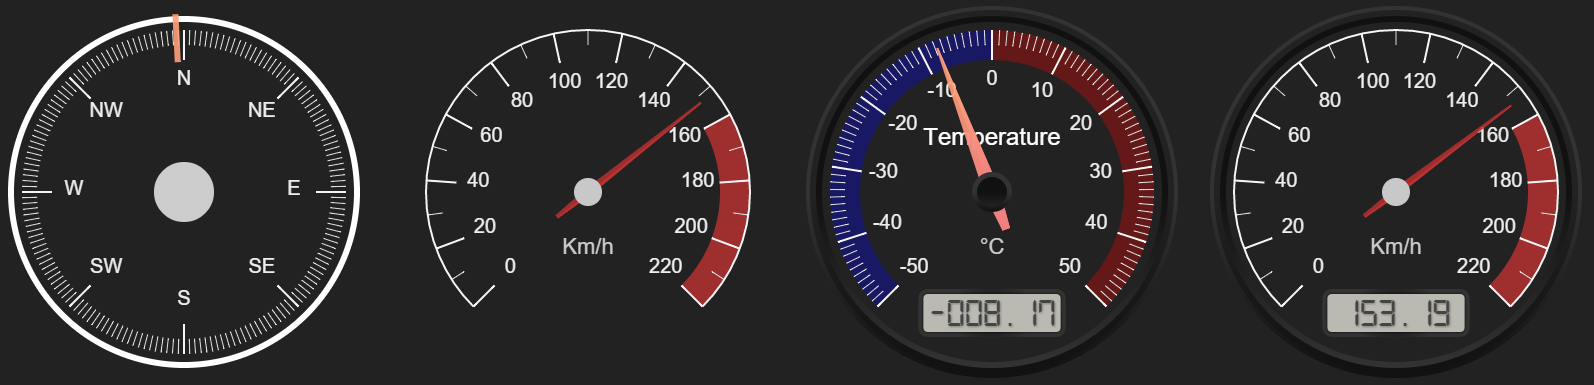
HTML Canvas Gauges v2.1 Installation Documentation Add-Ons Special Thanks License This is tiny implementation of highly configurable gauge using pure
Interactive visualizations of time series using JavaScript and the HTML canvas tag

dygraphs JavaScript charting library The dygraphs JavaScript library produces interactive, zoomable charts of time series: Learn more about it at dygr
Financial lightweight charts built with HTML5 canvas
Lightweight Charts Demos | Documentation | Discord community TradingView Lightweight Charts are one of the smallest and fastest financial HTML5 charts
🍞📊 Beautiful chart for data visualization.

🍞 📈 Spread your data on TOAST UI Chart. TOAST UI Chart is Beautiful Statistical Data Visualization library. 📦 Packages The functionality of TOAST U
Powerful data visualization library based on G2 and React.

BizCharts New charting and visualization library has been released: http://bizcharts.net/products/bizCharts. More details about BizCharts Features Rea
a super simple, no-nonsense diagramming library written in react that just works
Introduction DEMO: http://projectstorm.cloud/react-diagrams DOCS (wip) https://projectstorm.gitbook.io/react-diagrams Docs are currently being worked
A renderer agnostic two-dimensional drawing api for the web.
Two.js A two-dimensional drawing api meant for modern browsers. It is renderer agnostic enabling the same api to render in multiple contexts: webgl, c
🔥 JavaScript Library for HTML5 canvas based heatmaps
heatmap.js Dynamic Heatmaps for the Web. How to get started The fastest way to get started is to install heatmap.js with bower. Just run the following
A visualization grammar.
Vega: A Visualization Grammar Vega is a visualization grammar, a declarative format for creating, saving, and sharing interactive visualization design
📊 A highly interactive data-driven visualization grammar for statistical charts.

English | 简体中文 G2 A highly interactive data-driven visualization grammar for statistical charts. Website • Tutorial Docs • Blog • G2Plot G2 is a visua
The Swiss Army Knife of Vector Graphics Scripting – Scriptographer ported to JavaScript and the browser, using HTML5 Canvas. Created by @lehni & @puckey
Paper.js - The Swiss Army Knife of Vector Graphics Scripting If you want to work with Paper.js, simply download the latest "stable" version from http:
Javascript Canvas Library, SVG-to-Canvas (& canvas-to-SVG) Parser
Fabric.js Fabric.js is a framework that makes it easy to work with HTML5 canvas element. It is an interactive object model on top of canvas element. I
Simple HTML5 Charts using the canvas tag
Simple yet flexible JavaScript charting for designers & developers Documentation Currently, there are two versions of the library (2.9.4 and 3.x.x). V
Apache ECharts is a powerful, interactive charting and data visualization library for browser
Apache ECharts Apache ECharts is a free, powerful charting and visualization library offering an easy way of adding intuitive, interactive, and highly
JavaScript 3D library.
three.js JavaScript 3D library The aim of the project is to create an easy to use, lightweight, cross-browser, general purpose 3D library. The current
Bring data to life with SVG, Canvas and HTML. :bar_chart::chart_with_upwards_trend::tada:
D3: Data-Driven Documents D3 (or D3.js) is a JavaScript library for visualizing data using web standards. D3 helps you bring data to life using SVG, C
Responsive, interactive and more accessible HTML5 canvas elements. Scrawl-canvas is a JavaScript library designed to make using the HTML5 canvas element a bit easier, and a bit more fun!
Scrawl-canvas Library Version: 8.5.2 - 11 Mar 2021 Scrawl-canvas website: scrawl-v8.rikweb.org.uk. Do you want to contribute? I've been developing thi
JavaScript animation engine

anime.js JavaScript animation engine | animejs.com Anime.js (/ˈæn.ə.meɪ/) is a lightweight JavaScript animation library with a simple, yet powerful AP