Redefined chart library built with React and D3

Overview

Recharts

Sponsors on Open Collective Backers on Open Collective Build Status Coverage Status npm version npm downloads MIT License

Introduction

Recharts is a Redefined chart library built with React and D3.

The main purpose of this library is to help you to write charts in React applications without any pain. Main principles of Recharts are:

  1. Simply deploy with React components.
  2. Native SVG support, lightweight depending only on some D3 submodules.
  3. Declarative components, components of charts are purely presentational.

Examples

<LineChart
  width={400}
  height={400}
  data={data}
  margin={{ top: 5, right: 20, left: 10, bottom: 5 }}
>
  <XAxis dataKey="name" />
  <Tooltip />
  <CartesianGrid stroke="#f5f5f5" />
  <Line type="monotone" dataKey="uv" stroke="#ff7300" yAxisId={0} />
  <Line type="monotone" dataKey="pv" stroke="#387908" yAxisId={1} />
</LineChart>

All the components of Recharts are clearly separated. The lineChart is composed of x axis, tooltip, grid, and line items, and each of them is an independent React Component. The clear separation and composition of components is one of the principle Recharts follows.

Installation

npm

NPM is the easiest and fastest way to get started using Recharts. It is also the recommended installation method when building single-page applications (SPAs). It pairs nicely with a CommonJS module bundler such as Webpack.

# latest stable
$ npm install recharts

umd

The UMD build is also available on unpkg.com:

 <script src="https://unpkg.com/react/umd/react.production.min.js"></script>
 <script src="https://unpkg.com/react-dom/umd/react-dom.production.min.js"></script>
 <script src="https://unpkg.com/recharts/umd/Recharts.min.js"></script>

Then you can find the library on window.Recharts.

dev build

$ git clone https://github.com/recharts/recharts.git
$ cd recharts
$ npm install
$ npm run build

Demo

To examine the demos in your local build, execute:

$ npm run[-script] demo

and then browse to http://localhost:3000.

Module Formats

Contribution

We'd love ❤️ to hear what you think we should build. Please create an issue to write your usage or ideas.

We are looking for like-minded people who share the same idea about Recharts. The goal of this project is to create a more flexible charting library for the React community.

Backers

Become a backer and get your image on our README on Github with a link to your site.

Sponsoring

Most of the core team members do this open source work in their free time. If you use recharts for a important work, and you'd like us to invest more time on it, please donate. Thanks!

License

MIT

Copyright (c) 2015-2021 Recharts Group.

Comments
  • LineChart: add custom tooltip just above a point

    LineChart: add custom tooltip just above a point

    Hi everyone, in my project I'm trying to achieve something like in the image below, where the tooltip is rendered just above the point it refers to.

    image

    Looking at the props the custom tooltip receives, coordinates follow the mouse cursor. Is there a way to have coordinates fixed to the point in the graph?

    enhancement 
    opened by veej 60
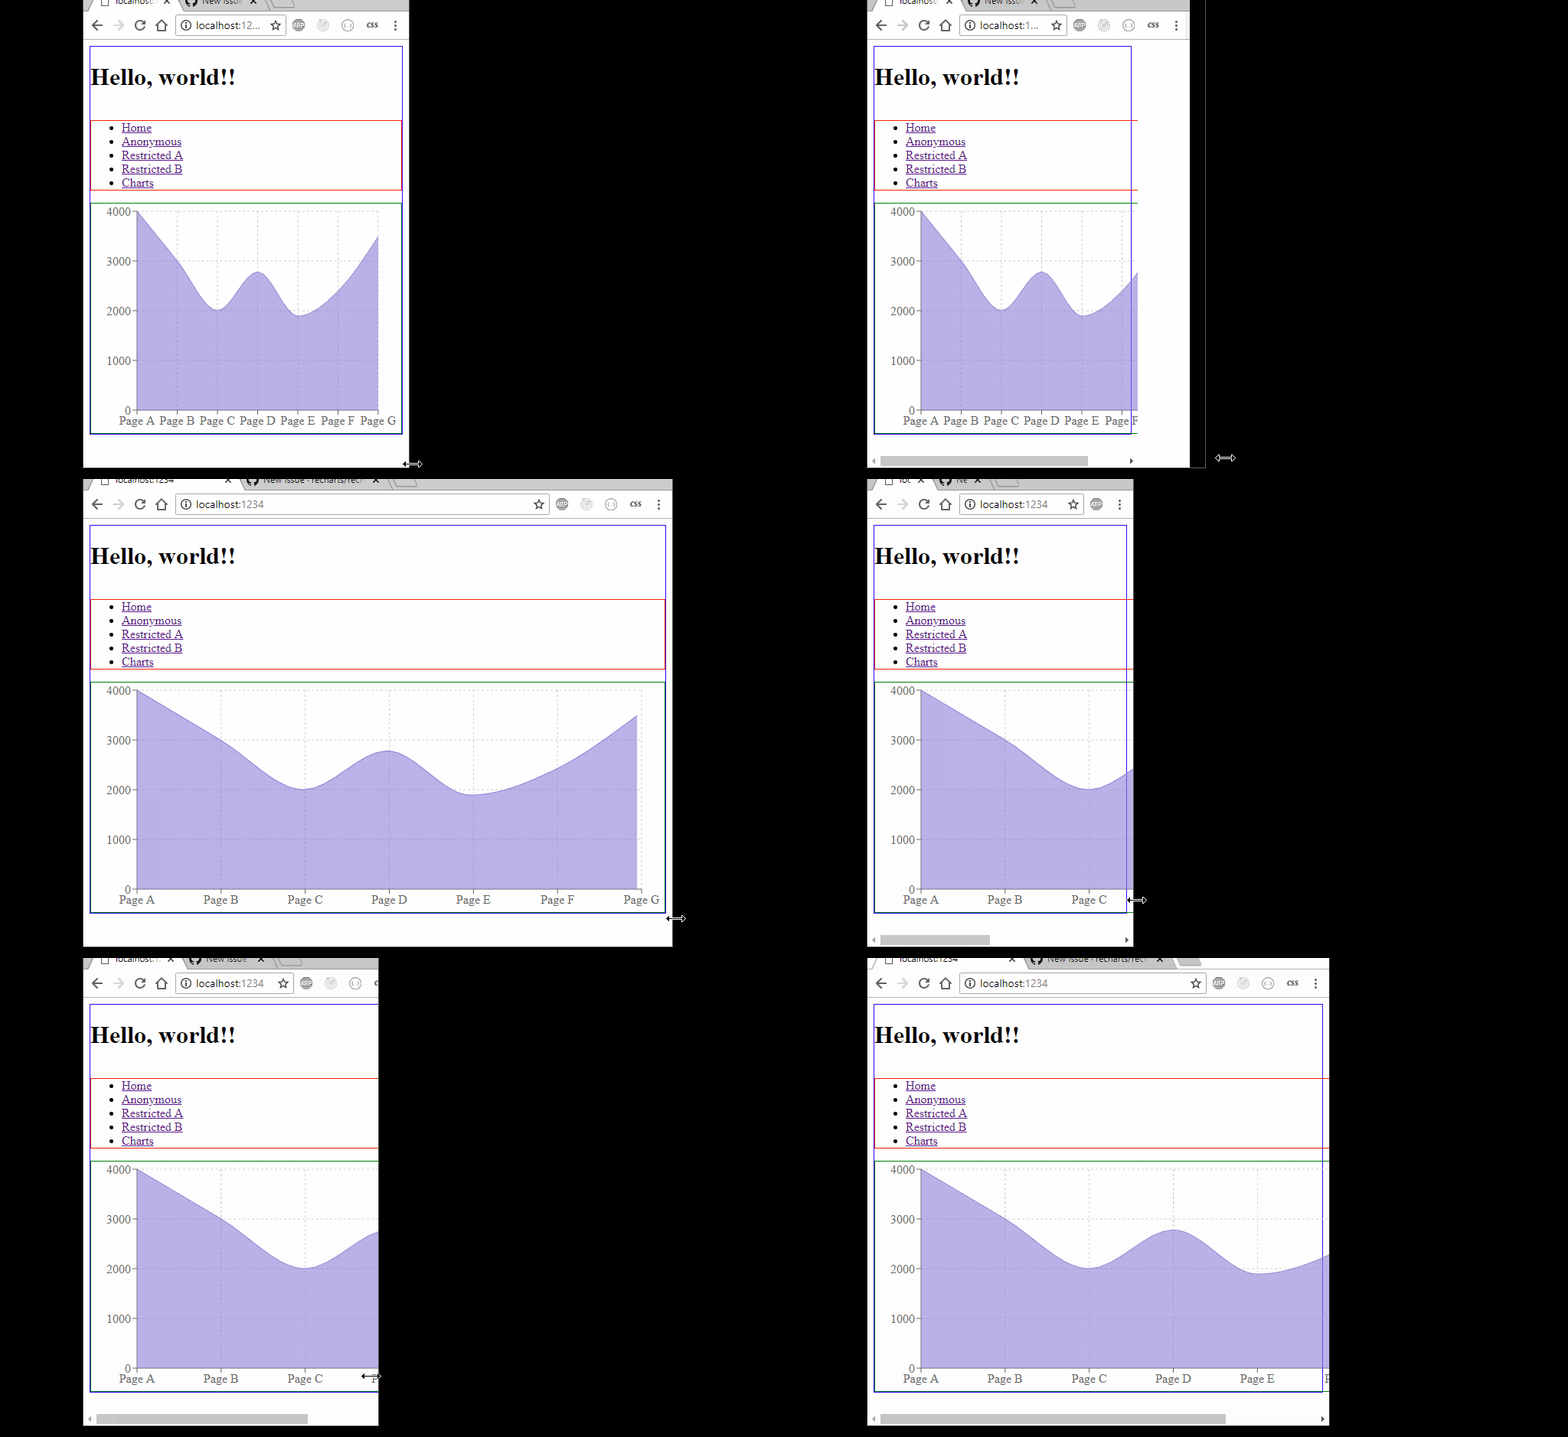
  • Recharts Responsive Chart not responsive inside a CSS grid

    Recharts Responsive Chart not responsive inside a CSS grid

    Do you want to request a feature or report a bug?

    What is the current behavior?

    Responsive Charts are do not resize when resizing windows if it's inside a CSS grid.

    example

    .home {
      border: 1px solid blue;
      display: grid;
    
      grid-template-areas:
        'hello'
        'links'
        'main';
     }
    
    .charts {
      border: 1px solid green;
      grid-area: main;
    }
    

    If the current behavior is a bug, please provide the steps to reproduce and if possible a minimal demo of the problem via https://jsfiddle.net or similar (template: http://jsfiddle.net/ndLhnegs/).

    What is the expected behavior?

    It should resize when window is resizing.

    Which versions of Recharts, and which browser / OS are affected by this issue? Did this work in previous versions of Recharts?

    https://github.com/rodoabad/automatic-palm-tree/tree/e557ebf246078c418da0678cba5b43c7abb41357

    "recharts": "^1.1.0"

    opened by rodoabad 51
  • ResponsiveContainer does not respond to resizing from large to small

    ResponsiveContainer does not respond to resizing from large to small

    ResponsiveContainer computes the size of the chart based on the current window size. It also seems to respond when you make the browser window larger, however if you make the browser window smaller, the chart stays large. Tested on chrome.

    opened by marchaos 50
  • Labels shomtimes not show

    Labels shomtimes not show

    Do you want to request a feature or report a bug?

    bug

    What is the current behavior?

    Some times i dont see label

    2017-08-11 15-25-51 2017-08-11 15-26-13

    If the current behavior is a bug, please provide the steps to reproduce and if possible a minimal demo of the problem via https://jsfiddle.net or similar (template: http://jsfiddle.net/qbmg1567/).

    const _dataTypesMap = {
        "0": () => <Bar dataKey="clientQuestions" fill="#6aafff" minPointSize={1} />,
        "1": () => <Bar dataKey="arPercent" fill="#b8e986" minPointSize={1} label={{ fill: 'red', fontSize: 20, dataKey: "nps" }}/>,
        "2": () => <Bar dataKey="awsPercent" fill="#f16c97" minPointSize={1} />
    };
    
    const _getCharts = (dataTypes) => {
        return dataTypes.map(t => _dataTypesMap[t]())
    };
    
    const DashboardChart = ({ stats, dataTypes }) => {
      return (
          <BarChart width={1008} height={200} data={stats}
              margin={{ top: 5, right: 5, left: 5, bottom: 5 }}>
              <Tooltip content={<_Tooltip/>} payload={stats}/>
              { _getCharts(dataTypes) }
          </BarChart>
      )
    };
    

    What is the expected behavior?

    I want see all times label

    Which versions of Recharts, and which browser / OS are affected by this issue? Did this work in previous versions of Recharts?

    rechart - 1.0.0-alpha.1 OS Ubuntu 16.04 - 64x Browser Firefox 56.0b1 (64-бит)

    opened by totaki 43
  • Pie Chart - No Label Shown

    Pie Chart - No Label Shown

    Trying to get a label shown on a simple pie chart. No lines or anything are shown.

    var COLORS = ['#3DCC91', '#FFB366', '#FF7373', '#FFCC00', '#3B22FF'];
    
            <PieChart width={300} height={200}>
              <Pie data={data} cx="50%" cy="50%" dataKey="value" label={true} labelLine={true}>
                {
                  data.map((entry, index) => (
                    <Cell key={index} fill={COLORS[index % COLORS.length]}  />
                  ))
                }
              </Pie>
              <Tooltip />
              <Legend />
            </PieChart>
    

    Why do none of the examples work on jsFiddle or on the main site? It just renders blank page.

    UPDATE So, I dropped back to version 0.22.4 and it shows the label. The latest version doesn't show it.

    opened by quangas 41
  • Failed to compile :

    Failed to compile : "export 'Props' (reexported as 'AreaProps') was not found in './cartesian/Area'

    • [x] I have searched the issues of this repository and believe that this is not a duplicate.

    Steps to reproduce

    1. update package.json from "recharts": "^2.0.0-beta.8" to "recharts": "^2.0.0".
    2. npm build

    What is expected?

    Build successfull

    What is actually happening?

    Creating an optimized production build... Failed to compile.

    ./node_modules/recharts/es6/index.js "export 'Props' (reexported as 'AreaProps') was not found in './cartesian/Area'

    | Environment | Info | |---|---| | Recharts | v2.0.0 | | React | 16.14.0 | | System | Ubuntu 20.04 | | Browser | Chrome |


    I had the issue both on Linux and Windows. Re-updating to "recharts": "^2.0.0-beta.8" worked on my windows instance (not on linux one)

    opened by bisnard29 38
  • ResponsiveContainer doesn't render

    ResponsiveContainer doesn't render

    On IOS 8.3 the AreaChart does not render if it is within a ResponsiveContainer. Used the example from the docs. http://jsfiddle.net/znqLLdev/1/

    Removing ResponsiveContainer and adding width/height props to AreaChart renders successfully.

    opened by nickstanish 36
  • Legend overlapping when data from server

    Legend overlapping when data from server

    image

    It occurs at the first time when I get data from server side. But when I get data from server side again, the line chart is right.

    How can I make it right at the first time when I get data from server side.

    opened by YangZhouChaoFan 33
  • Change Line color depending on value

    Change Line color depending on value

    Hello,

    First of all thank you for this great library!

    I was looking for the ability to change the color of a Line in a LineChart depending on the value of the current point (for example a price history chart becomes green when it's cheaper than initial price and red when it's more expensive than initial price)

    Is it possible with the actual state of the library ? If not is someone already working on this ?

    opened by belgac 31
  • Error in nextjs with recharts

    Error in nextjs with recharts

    Server Error Error: require() of ES Module /home/l10006blr/Development/Nextjs/plants-shop/node_modules/d3-shape/src/index.js from /home/l10006blr/Development/Nextjs/plants-shop/node_modules/recharts/lib/shape/Symbols.js not supported. Instead change the require of index.js in /home/l10006blr/Development/Nextjs/plants-shop/node_modules/recharts/lib/shape/Symbols.js to a dynamic import() which is available in all CommonJS modules.

    opened by harshmangalam 30
  • Accepting function instead of dataKey

    Accepting function instead of dataKey

    It would be great if it were possible to pass a function that evaluates to a data points value instead of passing a dataKey

    i.e.

    <Line dataKey="uv" />
    

    could be equivalent to

    <Line value={ (data, index) => data[index]["uv"] } />
    

    That would allow Recharts to make less assumptions about the passed datas format and would enable more use cases like computing values

    enhancement 
    opened by tarrencev 28
  • [Jest Migration] ComposedChart.spec.js ->ComposedChart.spec.tsx

    [Jest Migration] ComposedChart.spec.js ->ComposedChart.spec.tsx

    As part of the jest migration we want to move all current jest tests to typescript. Issues will be made to encourage small chunks of refactoring done at once.

    Refactor ComposedChart.spec.js ->ComposedChart.spec.tsx and any existing bar chart tests from karma

    Acceptance criteria:

    • All bar chart tests are in TS + RTL + Jest at ComposedChart.spec.tsx
    • ComposedChart.spec.js is deleted
    • All tests pass
    P0 good first issue refactor 
    opened by ckifer 0
  • [Jest Migration] FunnelChart.spec.jsx ->FunnelChart.spec.tsx

    [Jest Migration] FunnelChart.spec.jsx ->FunnelChart.spec.tsx

    As part of the jest migration we want to move all current jest tests to typescript. Issues will be made to encourage small chunks of refactoring done at once.

    Refactor FunnelChart.spec.jsx ->FunnelChart.spec.tsx and any existing bar chart tests from karma

    Acceptance criteria:

    • All bar chart tests are in TS + RTL + Jest at FunnelChart.spec.tsx
    • FunnelChart.spec.jsx is deleted
    • All tests pass
    P0 good first issue refactor 
    opened by ckifer 0
  • [Jest Migration] AreaChart.spec.jsx -> AreaChart.spec.tsx

    [Jest Migration] AreaChart.spec.jsx -> AreaChart.spec.tsx

    As part of the jest migration we want to move all current jest tests to typescript. Issues will be made to encourage small chunks of refactoring done at once.

    Refactor AreaChart.spec.jsx -> AreaChart.spec.tsx and any existing bar chart tests from karma

    Acceptance criteria:

    • All bar chart tests are in TS + RTL + Jest at AreaChart.spec.tsx
    • AreaChart.spec.jsx is deleted
    • All tests pass
    P0 good first issue refactor 
    opened by ckifer 0
  • [Jest Migration] LineChart.spec.js -> LineChart.spec.tsx

    [Jest Migration] LineChart.spec.js -> LineChart.spec.tsx

    As part of the jest migration we want to move all current jest tests to typescript. Issues will be made to encourage small chunks of refactoring done at once.

    Refactor LineChart.spec.js -> LineChart.spec.tsx and any existing bar chart tests from karma

    Acceptance criteria:

    • All bar chart tests are in TS + RTL + Jest at LineChart.spec.tsx
    • LineChart.spec.js is deleted
    • All tests pass
    P0 good first issue refactor 
    opened by ckifer 2
  • fix: patch d3 libraries with victory-vendor to fix security vulnerability

    fix: patch d3 libraries with victory-vendor to fix security vulnerability

    Description

    D3 moved to vending ESM only. Our consumers use jest, next, etc. which requires cjs - if we patch d3 security vulnerability in a patch fix we break our consumers. In order for v2.x.x to be secure we need a cjs version of patched d3.

    victory-vendor does this for us as per blog post https://formidable.com/blog/2022/victory-esm/

    change d3 references to victory-vendor, remove direct d3 dependencies

    Related Issue

    #3012 #3009, more

    Motivation and Context

    Fix dependency vulnerability that will not go away in 2.x.x due to d3 not wanting to upgrade

    How Has This Been Tested?

    See comment here https://github.com/recharts/recharts/issues/3012#issuecomment-1366152741

    Created two duplicate branches. One I upgraded the dependencies directly, this one I replaced with victory-vendor. Due to adding jest tests to our test suite we now have a failing build when directly upgrading the deps.

    Many references are also in our demo project - these continue to work as well. Tested manually. npm run test npm run build npm run demo

    Screenshots (if appropriate): N/A

    Types of changes

    • [x] Bug fix (non-breaking change which fixes an issue)
    • [ ] New feature (non-breaking change which adds functionality)
    • [ ] Breaking change (fix or feature that would cause existing functionality to change)

    Checklist:

    • [x] My code follows the code style of this project.
    • [ ] My change requires a change to the documentation.
    • [ ] I have updated the documentation accordingly.
    • [ ] I have added tests to cover my changes.
    • [x] All new and existing tests passed.
    P0 refactor 
    opened by ckifer 5
  • WIP: Treemap: use provided node values

    WIP: Treemap: use provided node values

    Description

    Compatible with current API, if no value is given for parent nodes. If a value is given for a parent node, the current API would ignore that value, while the API in this patch would adopt it.

    Work In Progress - I still need to figure out how to only show the parent names. As it is, the parent and all child names are superimposed into an unreadable mess. I plan to get to that over the holiday break, but I'm publishing now in hopes of avoiding wasted work in case this whole approach is wrong.

    Related Issue

    #3114

    Motivation and Context

    When calculating the size of a parent node, the current code adds up the values of all children. I sometimes want to do something different, for example to size the parents according to the max/min/mean or other aggregate of the children's values.

    How Has This Been Tested?

    I've created a demo with pre-calculated parent values. I generated that demo with random data many times and observed it to show sizes that match up with parent values as different from the normal Treemap demo that shows parent sizes according to the sum of all child sizes.

    Note that this level of detail is not explained in the docs, so I made no changes there.

    Screenshots (if appropriate):

    Types of changes

    • [ ] Bug fix (non-breaking change which fixes an issue)
    • [x] New feature (non-breaking change which adds functionality)
    • [ ] Breaking change (fix or feature that would cause existing functionality to change)

    Checklist:

    • [x] My code follows the code style of this project.
    • [ ] My change requires a change to the documentation.
    • [ ] I have updated the documentation accordingly.
    • [ ] I have added tests to cover my changes.
    • [x] All new and existing tests passed.
    opened by mariodsantana 0
Owner
recharts
Redefined chart library built with React and D3
recharts
A Simple Dashboard Chart in Laravel Nova using Chart JS

A Simple Dashboard Chart in Laravel Nova using Chart JS. Starting create your own dashboard with Chart JS Integration can save your time and help you maintain consistency across standard elements such as Bar, Stacked, Line, Area, Doughnut and Pie Chart.

Kuncoro Wicaksono 177 Jan 4, 2023
Chart.js plugin to defer initial chart updates

Chart.js plugin to defer initial chart updates until the user scrolls and the canvas appears inside the viewport, and thus trigger the initial chart a

Chart.js 97 Nov 9, 2022
Bar Funnel Chart extension for Chart.js

Chart.BarFunnel.js Provides a Bar Funnel Chart for use with Chart.js Documentation To create a Bar Funnel Chart, include Chart.BarFunnel.js after Char

Chart.js 58 Nov 24, 2022
TradeX-chart is a trade chart written in plain (vanilla) JavaScript with minimal dependencies

TradeX-chart is a trade chart written in plain (vanilla) JavaScript with minimal dependencies; use it with any framework or backend.

null 24 Dec 12, 2022
:bar_chart: A library of modular chart components built on D3

Plottable Plottable is a library of chart components for creating flexible, custom charts for websites. It is built on top of D3.js and provides highe

Palantir Technologies 2.9k Dec 31, 2022
React components for Chart.js, the most popular charting library

react-chartjs-2 React components for Chart.js, the most popular charting library. Supports Chart.js v3 and v2. Quickstart • Docs • Slack • Stack Overf

null 5.6k Jan 4, 2023
Java library for use with Chart.js javascript library

Chart.java Chart.java enables integration with the excellent Chart.js library from within a Java application. Usage example In Java: BarDataset datase

Marceau Dewilde 102 Dec 16, 2022
IBM Gantt Chart Component, integrable in Vanilla, jQuery, or React Framework.

@ibm/gantt-chart IBM Gantt Chart Component, integrable in Vanilla, jQuery, or React Framework. Getting started Documentation and Examples are availabl

International Business Machines 169 Dec 20, 2022
TChart.js - simple and configurable Bar and Line Chart library in Javascript

TChart.js Simple and configurable Bar and Line Chart library in Javascript Description TChart.js is a canvas-based simple Javascript Bar and Line Char

null 4 Mar 3, 2021
J2CL and GWT Charts library based on CHART.JS

Charba - J2CL and GWT Charts library based on CHART.JS What's Charba GWT Web toolkit doesn't have charting library available out of the box. There are

Pepstock.org 56 Dec 17, 2022
:bar_chart: A D3-based reusable chart library

c3 c3 is a D3-based reusable chart library that enables deeper integration of charts into web applications. Follow the link for more information: http

C3.js 9.2k Jan 2, 2023
:bar_chart: Re-usable, easy interface JavaScript chart library based on D3.js

billboard.js is a re-usable, easy interface JavaScript chart library, based on D3 v4+. The name "billboard" comes from the famous billboard chart whic

NAVER 5.4k Jan 1, 2023
Chart.js plugin to calculate and draw statistical linear, exponential, power, logarithmic, and polynomial regressions.

chartjs-plugin-regression Chart.js plugin to calculate and draw statistical linear, exponential, power, logarithmic, and polynomial regressions using

Wilfredo Pomier 14 Dec 18, 2022
Chart image and QR code web API

QuickChart QuickChart is a service that generates images of charts from a URL. Because these charts are simple images, they are very easy to embed in

Ian Webster 1.3k Dec 25, 2022
Zoom and pan plugin for Chart.js

chartjs-plugin-zoom A zoom and pan plugin for Chart.js >= 3.0.0 For Chart.js 2.6.0 to 2.9.x support, use version 0.7.7 of this plugin. Panning can be

Chart.js 510 Jan 2, 2023
Chart.js Venn and Euler Diagrams

Chart.js Venn and Euler Diagram Chart Chart.js module for charting venn diagrams with up to five sets. Adding new chart type: venn and euler. Related

UpSet.js 23 Dec 6, 2022
Chart.js Choropleth and Bubble Maps

Chart.js Geo Chart.js module for charting maps with legends. Adding new chart types: choropleth and bubbleMap. works great with https://github.com/cha

Samuel Gratzl 224 Dec 28, 2022
Chart.js Box Plots and Violin Plot Charts

Chart.js Box and Violin Plot Chart.js module for charting box and violin plots. This is a maintained fork of @datavisyn/chartjs-chart-box-and-violin-p

Samuel Gratzl 61 Dec 14, 2022
GPL version of Javascript Gantt Chart

dhtmlxGantt Getting started | Features | Follow us | License | Useful links dhtmlxGantt is an open source JavaScript Gantt chart that helps you illust

null 952 Dec 29, 2022