125 Repositories
JavaScript chartjs-chart-matrix Libraries
JQuery plugin for creating charts
JQuery Linechart JQuery plugin for building a linechart. Chart ruler completely on HTML/CSS/JS. Bar chart, calendar view visualisation. Diagram, graph
Progressive svg pie, donut, bar and line charts
Peity Peity (sounds like deity) is a jQuery plugin that converts an element's content into a mini svg pie, donut, line or bar chart. Basic Usage HTM
🍞📝 Markdown WYSIWYG Editor. GFM Standard + Chart & UML Extensible.
TOAST UI Editor v3 major update planning 🏃 🏃 🏃 TOAST UI Editor is planning a v3 major update for 2021. You can see our detail RoadMap here! GFM Mar
JavaScript library for HTML5 & CSS3 time sheets
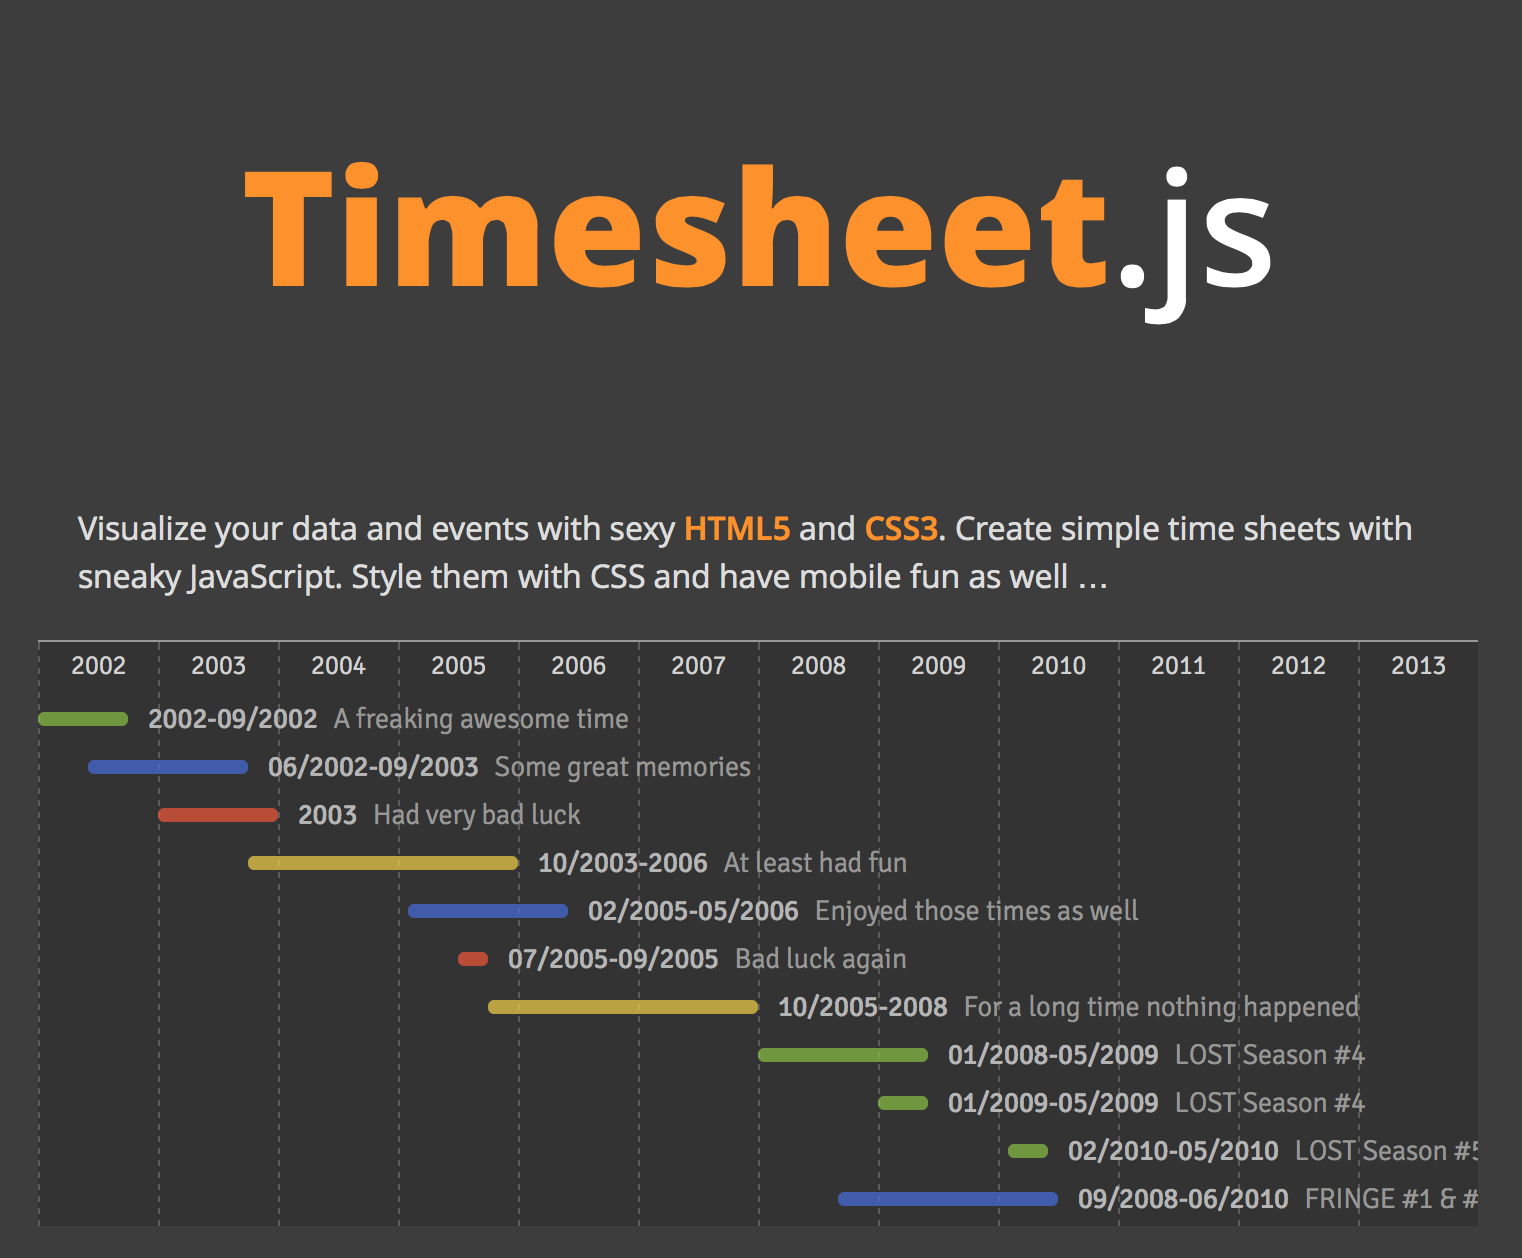
Timesheet.js Simple JavaScript library to create HTML time sheets. Wrapped in an example project using Middleman … You only have to include dist/times
Luckysheet is an online spreadsheet like excel that is powerful, simple to configure, and completely open source.
English| 简体中文 Introduction 🚀 Luckysheet is an online spreadsheet like excel that is powerful, simple to configure, and completely open source. Links
Data Visualization Components

react-vis | Demos | Docs A COMPOSABLE VISUALIZATION SYSTEM Overview A collection of react components to render common data visualization charts, such
🐯 visx | visualization components

visx visx is a collection of reusable low-level visualization components. visx combines the power of d3 to generate your visualization with the benefi
Redefined chart library built with React and D3
Recharts Introduction Recharts is a Redefined chart library built with React and D3. The main purpose of this library is to help you to write charts i
📊 Data visualization library for React based on D3
Data visualization library for React based on D3js REAVIZ is a modular chart component library that leverages React natively for rendering the compone
Composable data visualisation library for web with a data-first approach now powered by WebAssembly
What is Muze? Muze is a free data visualization library for creating exploratory data visualizations (like Tableau) in browser, using WebAssembly. It
:bar_chart: A library of modular chart components built on D3
Plottable Plottable is a library of chart components for creating flexible, custom charts for websites. It is built on top of D3.js and provides highe
:bar_chart: Declarative Charting Framework for Angular
ngx-charts Declarative Charting Framework for Angular! ngx-charts is unique because we don't merely wrap d3, nor any other chart engine for that matte
:bar_chart: Re-usable, easy interface JavaScript chart library based on D3.js
billboard.js is a re-usable, easy interface JavaScript chart library, based on D3 v4+. The name "billboard" comes from the famous billboard chart whic
🍞📊 Beautiful chart for data visualization.

🍞 📈 Spread your data on TOAST UI Chart. TOAST UI Chart is Beautiful Statistical Data Visualization library. 📦 Packages The functionality of TOAST U
Powerful data visualization library based on G2 and React.

BizCharts New charting and visualization library has been released: http://bizcharts.net/products/bizCharts. More details about BizCharts Features Rea
GPL version of Javascript Gantt Chart
dhtmlxGantt Getting started | Features | Follow us | License | Useful links dhtmlxGantt is an open source JavaScript Gantt chart that helps you illust
Awesome charts for AngularJS.

n3-line-chart v2 n3-line-chart is an easy-to-use JavaScript library for creating beautiful charts in AngularJS applications and it is built on top of
Open Source Javascript Gantt

Frappe Gantt A simple, interactive, modern gantt chart library for the web View the demo » Install npm install frappe-gantt Usage Include it in your
Progressive svg pie, donut, bar and line charts
Peity Peity (sounds like deity) is a jQuery plugin that converts an element's content into a mini svg pie, donut, line or bar chart. Basic Usage HTM
JavaScript diagramming library for interactive flowcharts, org charts, design tools, planning tools, visual languages.
GoJS, a JavaScript Library for HTML Diagrams GoJS is a JavaScript and TypeScript library for creating and manipulating diagrams, charts, and graphs. S
:bar_chart: A D3-based reusable chart library
c3 c3 is a D3-based reusable chart library that enables deeper integration of charts into web applications. Follow the link for more information: http
Data Visualization Components
react-vis | Demos | Docs A COMPOSABLE VISUALIZATION SYSTEM Overview A collection of react components to render common data visualization charts, such
Simple, responsive, modern SVG Charts with zero dependencies

Frappe Charts GitHub-inspired modern, intuitive and responsive charts with zero dependencies Explore Demos » Edit at CodePen » Contents Installation U
Redefined chart library built with React and D3
Recharts Introduction Recharts is a Redefined chart library built with React and D3. The main purpose of this library is to help you to write charts i
Simple HTML5 Charts using the canvas tag
Simple yet flexible JavaScript charting for designers & developers Documentation Currently, there are two versions of the library (2.9.4 and 3.x.x). V