198 Repositories
JavaScript svg-chart Libraries
Automatic chart generator from user input using CharGPT.
Chart GPT A platorm for generate chart with ChatGPT 🛠️ ChatGPT Generator is under development. Features Light/dark mode toggle Live previews Fullscre
Easy-to-use js library for building graphs using svg.
LineChart Easy-to-use js library for building graphs using svg. Examples How to use Just add linechart.js from 'src' directory to your project. And ad
A library for panning and zooming elements using CSS transforms :mag:
Panzoom Examples Panzoom is a small library (~3.7kb gzipped) to add panning and zooming functionality to an element. Rather than using absolute positi
Login of app to remind to drink water, using Firebase tools like Firebase Auth and Firebase Firestore

Water Reminder Login App Menu Contents Motivation Final Images How to download the project and run it? Technologies utilized Dev 📌 Motivation This ap
Open source CSS framework for data visualization.
Charts.css Charts.css is an open source CSS framework for data visualization. Visualization help end-users understand data. Charts.css help frontend d
IBM Gantt Chart Component, integrable in Vanilla, jQuery, or React Framework.

@ibm/gantt-chart IBM Gantt Chart Component, integrable in Vanilla, jQuery, or React Framework. Getting started Documentation and Examples are availabl
svgMap is a JavaScript library that lets you easily create an interactable world map comparing customizable data for each country.
svgMap svgMap is a JavaScript library that lets you easily create an interactable world map comparing customizable data for each country. Live demo: h
A Javascript library to export svg charts from the DOM and download them as an SVG file, PDF, or raster image (JPEG, PNG) format. Can be done all in client-side.
svg-exportJS An easy-to-use client-side Javascript library to export SVG graphics from web pages and download them as an SVG file, PDF, or raster imag
A script that combines a folder of SVG files into a single sprites file and generates type definitions for safe usage.
remix-sprites-example A script that combines a folder of .svg files into a single sprites.svg file and type definitions for safe usage. Technical Over
An easy-to-use JavaScript library aimed at making it easier to draw on SVG elements.
svg-pen-sketch An easy-to-use JavaScript library aimed at making it easier to draw on SVG elements when using a digital pen (such as the Surface Pen).
A jsPlumb-based tree chart implementation for jQuery.
jsPlumbTree A jQuery plugin for generating a tree structure using jsPlumb. The tree is drawn from left to right, top to bottom. Please note that only
A vanilla-js module for adding zoom-on-wheel and pan-on-drag behavior to inline SVG elements.
svg-pan-zoom-container A vanilla-js module for adding zoom-on-wheel and pan-on-drag behavior to inline SVG elements. No need to write scripts. Just ma
A lightweight JavaScript library for creating interactive maps and pretty data visualization.

Jsvectormap A lightweight Javascript library for creating interactive maps and pretty data visualization. Explore docs . Report bug · View demo · Down
A JavaScript library for visualizing Sankey diagrams.
SanKEY.js v1.0.0 last updated: 20.07.2022 Getting started SanKEY.js is a JavaScript data visualization library that provides a simple object-oriented
Colr Pickr, a vanilla JavaScript color picker component built with SVGs, with features like saving colors. Similar design to the chrome-dev-tools color picker.

Colr Pickr Colr Pickr, a vanilla JavaScript color picking component built with SVGs, with features like saving colors. Similar design to the chrome-de
An easy-to-use cross-framework JS charting library

Compact Chart Visualize your data under a minute, in any Javascript framework Table of Contents About How to use it Examples Demo Plain HTML Example w
Demonstration of liquid effect on HTML Canvas using Matter.js and SVG Filters (Blur + Contrast)
Canvas Liquid Effect Demonstration of liquid (or gooey) effect on HTML Canvas using Matter.js and SVG Filters (feGaussianBlur and feColorMatrix). DEMO
TradeX-chart is a trade chart written in plain (vanilla) JavaScript with minimal dependencies

TradeX-chart is a trade chart written in plain (vanilla) JavaScript with minimal dependencies; use it with any framework or backend.
This JavaScript class generates a placeholder image or default profile image as SVG or PNG

This JavaScript class generates a placeholder image or default profile image as SVG or PNG. You can use the following parameters in the constructor:
Simple yet flexible JavaScript charting for designers & developers
Simple yet flexible JavaScript charting for designers & developers Documentation All the links point to the new version 3 of the lib. Introduction Get
D3 (or D3.js) is a JavaScript library for visualizing data using web standards
D3 (or D3.js) is a JavaScript library for visualizing data using web standards. D3 helps you bring data to life using SVG, Canvas and HTML. D3 combines powerful visualization and interaction techniques with a data-driven approach to DOM manipulation, giving you the full capabilities of modern browsers and the freedom to design the right visual interface for your data.
Interactive Javascript Chart for Data Visualziations
Forio Contour Interactive Javascript Chart for Data Visualziations Forio Contour provides a core set of common visualizations that you can see in the
A lightweight graphic library providing 2d draw for Apache ECharts
ZRender A lightweight graphic library which provides 2d draw for Apache ECharts. Documentation https://ecomfe.github.io/zrender-doc/public/ License BS
JavaScript SVG parser and renderer on Canvas
canvg JavaScript SVG parser and renderer on Canvas. It takes the URL to the SVG file or the text of the SVG file, parses it in JavaScript and renders
Holder renders image placeholders in browser using SVG
Holder Holder renders image placeholders in browser using SVG. Used by thousands of open source projects (including Bootstrap v3) and many other sites
Generates an image from a DOM node using HTML5 canvas
DOM to Image What is it dom-to-image is a library which can turn arbitrary DOM node into a vector (SVG) or raster (PNG or JPEG) image, written in Java
🍎Transform an SVG icon into multiple themes, and generate React icons,Vue icons,svg icons
IconPark English | 简体中文 Introduction IconPark gives access to more than 2000 high-quality icons, and introduces an interface for customizing your icon
The iconic SVG, font, and CSS toolkit
Version 6 Font Awesome is the Internet's icon library and toolkit, used by millions of designers, developers, and content creators. Documentation Lear
SVG icons for popular brands
Simple Icons Over 2200 Free SVG icons for popular brands. See them all on one page at SimpleIcons.org. Contributions, corrections & requests can be ma
A curated collection of all country flags in SVG — plus the CSS for easier integration
flag-icons A curated collection of all country flags in SVG — plus the CSS for easier integration. See the demo. Install You can either download the w
A collection of CSS3 powered hover effects to be applied to links, buttons, logos, SVG, featured images and so on
A collection of CSS3 powered hover effects to be applied to links, buttons, logos, SVG, featured images and so on. Easily apply to your own elements, modify or just use for inspiration. Available in CSS, Sass, and LESS.
A html・css・svg version of the Roland TR-909 (no sound)

VECTOR-909 Roland TR-909 drum-machine with only hand-made html, svg & css. 100% vector graphics. No textures. No sound engine ... just yet! Credits Lo
Smoothly interpolate between variations of SVG paths.
svg-path-morph A simple library for morphing between variations of SVG paths. Use svg-path-morph to smoothly morph between X variations of the same SV
📸 Generate image using HTML5 canvas and SVG
egami → image README | 中文文档 Generate image using HTML5 canvas and SVG Fork from html-to-image Installation pnpm pnpm add egami npm npm i egami Usage i
A html・css・svg version of the Roland TR-909 (no sound)
VECTOR-909 Roland TR-909 drum-machine with only hand-made html, svg & css. 100% vector graphics. No textures. No sound engine ... just yet! Credits Lo
An open-source visualization library specialized for authoring charts that facilitate data storytelling with a high-level action-driven grammar.

Narrative Chart Introduction Narrative Chart is an open-source visualization library specialized for authoring charts that facilitate data storytellin
Timeline/Graph2D is an interactive visualization chart to visualize data in time.

vis-timeline The Timeline/Graph2D is an interactive visualization chart to visualize data in time. The data items can take place on a single date, or
Convert your SVG file directly to Flutter paths and prevent all the messing with bezier curves.
svg-to-flutter-path-converter Convert your SVG file directly to Flutter paths and prevent all the messing with bezier curves. Flutter Clutter The tool
A Hackable Markdown Note Application for Programmers. Version control, AI completion, mind map, documents encryption, code snippet running, integrated terminal, chart embedding, HTML applets, plug-in, and macro replacement.

Yank Note A hackable markdown note application for programmers Download | Try it Online Not ecommended English | 中文说明 [toc]{level: [2]} Highlights
A zero-dependencies script to generate sponsors SVG from Patreon
sponsors A zero-dependencies script to generate sponsors SVG from Patreon. Usage Go to https://www.patreon.com/portal/registration/register-clients to
Pebble - A free funky formalicious icon set for React (& plain ol' SVG & PNG)

A free funky formalicious icon set for React (& plain ol' SVG & PNG) Pebble is an icon set that aims for a friendly character. There's no real
Generate colorful and temporarily identifiable SVGs with unique urls.

reptiles.dev Generate colorful and temporarily identifiable SVGs with unique urls.
📦 SVGs, fast and developer friendly in Angular

View settings all icons fixed size e.g. 30px button to align all icons distributes button to align all icons onscreen button to align all icons offscr
📦 SVGs, fast and developer friendly in Angular
View settings all icons fixed size e.g. 30px button to align all icons distributes button to align all icons onscreen button to align all icons offscr
🎧 Get json type billboard hot 100 chart
Billboard json Get json type billboard hot 100 chart, Data update every day !! Url Hot 100 : https://raw.githubusercontent.com/KoreanThinker/billboard
🎉 Sensoro Design SVG Icons
Sensoro Design Icons 语义化矢量图形库,提供了描述图标的抽象节点来满足对各种框架的适配。 ✨ 特性 📦 内置了丰富的图标资源 🎉 支持对 React、Vue、React Native、Angular 各种框架的适配 💻 使用 TypeScript 开发,提供完整的类型定义文
Landscape Generator is An open Source web application that generates landscape drawings randomly, then gives you the ability to edit it and export it as SVG or PNG.
Landscape Generator ## About Landscape Generator is An open Source web application that generates landscape drawings randomly, then gives you the abil
A recreation of a startpage posted on Reddit without the source, so I rewrote it in Next.js + Tailwind for the open source community.
Startpage "Figma Balls" Rewrite Why Did I Make This I saw a startpage posted on the subreddit r/startpages that I thought looked nice, but when I look
A Cloudflare Worker that translates TeX to SVG
TeX SVG Worker A Cloudflare Worker that translates TeX to SVG.
Highly customizable, animated, responsive, and dependency-free Evolution Graph implementation
Highly customizable, animated, responsive, and dependency-free Evolution Graph implementation. The package is built with Vanilla JavaScript and is used to create flexible data visualizations and present evolution relationships between entities.
ChelseaJS - a Javascript library for creative, generative Coding
ChelseaJS is a Javascript library for creative, generative Coding. It's simple and intuitive syntax makes it easy for everyone (including non-coders)
API to generate candlestick chart data for any time period based on transactions data
candel-maker API to generate candlestick chart data for any time period based on transactions data Installation clone repo git clone https://github.co
Github action generates dynamic image URL for contributor list to display it!
github-action-contributors Github action generates dynamic image URL for contributor list to display it! Contributors Usage - run: mkdir -p build - na
Simple library to custom waveforms🎶
waveform-path LIVE DEMO WITH EXAMPLES Simple library to custom waveforms. Install NPM npm install waveform-path -s Download Download the last realease
Lightweight, interactive planning tool that visualizes a series of tasks using an HTML canvas

Planner Lightweight, interactive planning tool that visualizes a series of tasks using an HTML canvas. Try it yourself at plannerjs.dev Plans created
A huge collection of SVG cryptocurrency logos
SVG Cryptocurrency Logos A collection of SVG (vector) logos of crytocurrency projects. Free logo API We also offer these logos via a free API. Our fre
Lightweight, Material Design inspired go to top button. No dependencies. Pure Angular!

Angular ScrollTop Button Lightweight, Material Design inspired button for scroll-to-top of the page. No dependencies. Pure Angular! ✓ Angular 13, Ivy
Fallback for SVG images by automatically creating PNG versions on-the-fly
SVGMagic - Cross browser SVG This repository is no longer actively mainted. It has proven to be very usefull back in 2013, but these days SVGs are sup
JavaScript library to make drawing animation on SVG
vivus.js Demo available on http://maxwellito.github.io/vivus Play with it on Vivus Instant Vivus is a lightweight JavaScript class (with no dependenci
An easy way to animate SVG elements.
Walkway I loved the animations for the polygon ps4 review a few months back and decided to create a small library to re-create them (simple demo). It
Animate Plus is a JavaScript animation library focusing on performance and authoring flexibility
Animate Plus Animate Plus is a JavaScript animation library focusing on performance and authoring flexibility. It aims to deliver a steady 60 FPS and
Making Animation Simple
Just Animate 2 Making Animation Simple Main Features Animate a group of things as easily as a single thing Staggering and delays Chainable sequencing
Animator Core is the runtime and rendering engine for Haiku Animator and the components you create with Animator
Animator Core is the runtime and rendering engine for Haiku Animator and the components you create with Animator. This engine is a dependency for any Haiku Animator components that are run on the web.
Generate an image of all your Github contributions

GitHub Contribution Chart Generator Generates an image of all your GitHub contributions since you have signed up, so you can use it in social media. T
Synchro Charts is a front-end component library that provides a collection of components to visualize time-series data.
Synchro Charts Synchro Charts is a front-end component library that provides a collection of components to visualize time-series data. You can learn m
Bar Funnel Chart extension for Chart.js

Chart.BarFunnel.js Provides a Bar Funnel Chart for use with Chart.js Documentation To create a Bar Funnel Chart, include Chart.BarFunnel.js after Char
Chart.js Box Plots and Violin Plot Charts

Chart.js Box and Violin Plot Chart.js module for charting box and violin plots. This is a maintained fork of @datavisyn/chartjs-chart-box-and-violin-p
Chart.js Plugin for showing error bars for various chart types

Chart.js Error Bars Chart.js module for charting error bars plots. This plugin extends the several char types (bar, horizontalBar, line, scatter, pola
Chart.js module for charting financial securities
Chart.js Financial Charting Chart.js module for Candlestick and OHLC charts Roadmap Chart.js 2.7.0 added our timeseries scale as new option called dis
Chart.js Choropleth and Bubble Maps
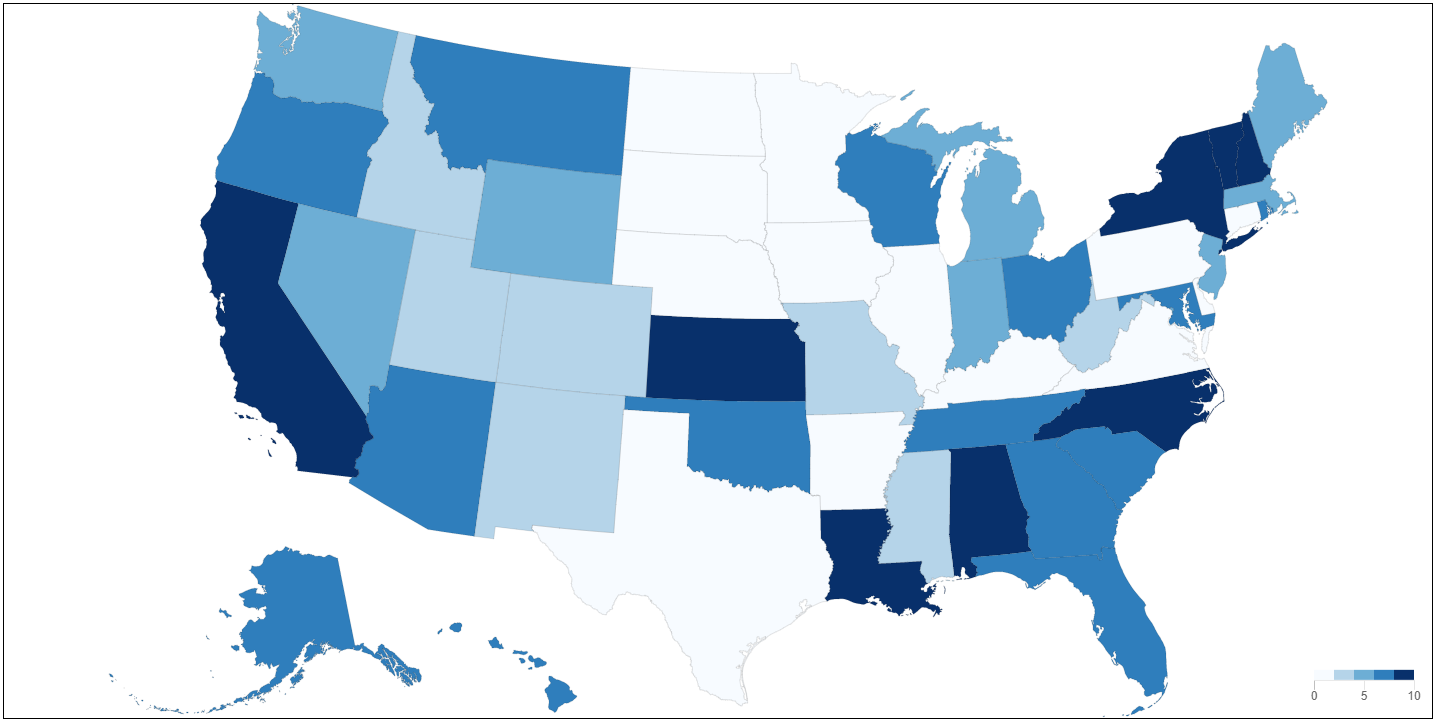
Chart.js Geo Chart.js module for charting maps with legends. Adding new chart types: choropleth and bubbleMap. works great with https://github.com/cha
Chart.js Graph-like Charts (tree, force directed)

Chart.js Graphs Chart.js module for charting graphs. Adding new chart types: graph, forceDirectedGraph, dendogram, and tree. Works great with https://
Chart.js module for creating matrix charts

chartjs-chart-matrix Chart.js v3.0.0 module for creating matrix charts Example Documentation You can find documentation for chartjs-chart-treemap at h
Chart.js Parallel Coordinates Plot
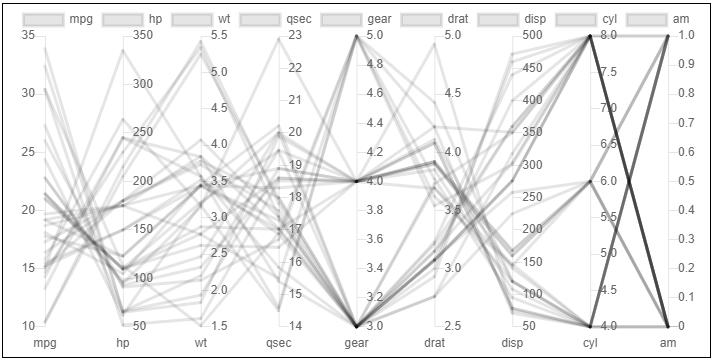
Chart.js Parallel Coordinate Plots Chart.js module for charting parallel coordinate plots (PCPs). Adding new chart type: pcp. Related Plugins Check ou
Chart.js module for creating sankey diagrams

chartjs-chart-sankey Chart.js v3.3.x module for creating sankey diagrams Browser support All modern and up-to-date browsers are supported, including,
Chart.js module for creating treemap charts

chartjs-chart-treemap Chart.js v3.6.0 module for creating treemap charts. Implementation for Chart.js v2 is in 2.x branch Documentation You can find d
Chart.js Venn and Euler Diagrams
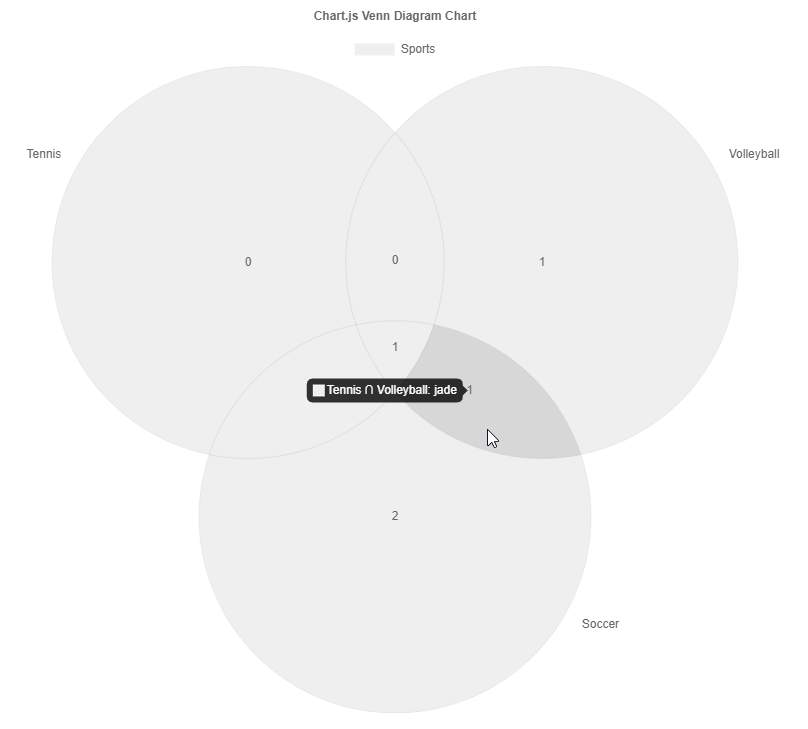
Chart.js Venn and Euler Diagram Chart Chart.js module for charting venn diagrams with up to five sets. Adding new chart type: venn and euler. Related
Chart.js Word Clouds

Chart.js Word Clouds Chart.js module for charting word or tag clouds. Adding new chart type: wordCloud. Related Plugins Check out also my other chart.
Annotation plugin for Chart.js

chartjs-plugin-annotation.js An annotation plugin for Chart.js = 3.0.0 This plugin needs to be registered. It does not function as inline plugin. For
Automatic color generation for Chart.js

chartjs-plugin-autocolors Automatic color generation for Chart.js The generation is based on Janus Troelsen's answer at Stack Overflow. This plugin re
Predefined color schemes for Chart.js
chartjs-plugin-colorschemes Predefined color schemes for Chart.js You can pick the perfect color combination for your charts from the predefined color
Chart.js plugin to display labels on data elements
Overview Highly customizable Chart.js plugin that displays labels on data for any type of charts. Requires Chart.js 3.x. Documentation Introduction Ge
Chart.js plugin for Prometheus data loading

Welcome to chartjs-plugin-datasource-prometheus 👋 A Prometheus datasource for ChartJS. Dependencies: requires chart.js 2.7 or later. requires moment.
Chart.js plugin to defer initial chart updates

Chart.js plugin to defer initial chart updates until the user scrolls and the canvas appears inside the viewport, and thus trigger the initial chart a
Draggable data points plugin for Chart.js

chartjs-plugin-dragdata.js Now compatible with Chart.js v3 🎉 Looking for a version compatible to Chart.js 2.9.x? Then visit the v2 branch! A plugin
Easy gradients for Chart.js

chartjs-plugin-gradient Easy gradients for Chart.js This plugin requires Chart.js 3.0.0 or later. Could work with v2, but it is not supported. NOTE th
Chart.js scale for hierarchical tree-like data structure
Chart.js Hierarchical Scale Plugin Chart.js module for adding a new categorical scale which mimics a hierarchical tree. Related Plugins Check out also
Chart.js plugin to calculate and draw statistical linear, exponential, power, logarithmic, and polynomial regressions.
chartjs-plugin-regression Chart.js plugin to calculate and draw statistical linear, exponential, power, logarithmic, and polynomial regressions using
Chart.js plugin to create charts with a hand-drawn, sketchy, appearance
chartjs-plugin-rough Chart.js plugin to create charts with a hand-drawn, sketchy, appearance Version 0.2 requires Chart.js 2.7.0 or later, and Rough.j
This plugin for Chart.js that makes your bar chart to 100% stacked bar chart.

chartjs-plugin-stacked100 This plugin for Chart.js that makes your bar chart to 100% stacked bar chart. Requires Chart.js 3.x. Demo: https://y-takey.g
Chart.js plugin for live streaming data
chartjs-plugin-streaming Chart.js plugin for live streaming data chartjs-plugin-streaming 2.x requires Chart.js 3.0.0 or later. If you need Chart.js 2
Chart.js plugin for more styling options
chartjs-plugin-style Chart.js plugin for more styling options This plugin requires Chart.js 2.6.0 or later. Installation You can download the latest v
Zoom and pan plugin for Chart.js
chartjs-plugin-zoom A zoom and pan plugin for Chart.js = 3.0.0 For Chart.js 2.6.0 to 2.9.x support, use version 0.7.7 of this plugin. Panning can be
date-fns adapter for Chart.js
chartjs-adapter-date-fns Overview This adapter allows the use of date-fns with Chart.js. Requires Chart.js 2.8.0 or later and date-fns 2.0.0 or later.
Luxon adapter for Chart.js
chartjs-adapter-luxon Overview This adapter allows the use of Luxon with Chart.js. Luxon provides built-in support for time zones and internationaliza
This adapter allows the use of Moment.js with Chart.js
chartjs-adapter-moment Overview This adapter allows the use of Moment.js with Chart.js. Moment.js is a very heavy library and thus not recommended for
A simple ember component for adding Charts
Ember Chart This Ember CLI addon is a simple wrapper for ChartJS (v2.9). Compatibility Ember.js v3.12 or above Ember CLI v2.13 or above Node.js v10 or
Simple yet flexible charting Lightning Web Component using Chart.js for admins & developers
Lightning Web Chart.js Component Simple yet flexible charting Lightning Web Component using Chart.js for admins & developers Documentation Getting sta
Beautiful charts for Angular based on Chart.js
ng2-charts slack Beautiful charts for Angular based on Chart.js Usage & Demo Samples using ng2-charts https://valor-software.com/ng2-charts/ Installat
React components for Chart.js, the most popular charting library
react-chartjs-2 React components for Chart.js, the most popular charting library. Supports Chart.js v3 and v2. Quickstart • Docs • Slack • Stack Overf