529 Repositories
JavaScript data-flow Libraries
React Hooks library for remote data fetching
Introduction swr.vercel.app SWR is a React Hooks library for remote data fetching. The name “SWR” is derived from stale-while-revalidate, a cache inva
⚛️ Hooks for fetching, caching and updating asynchronous data in React

Hooks for fetching, caching and updating asynchronous data in React Enjoy this library? Try the entire TanStack! React Table, React Form, React Charts
React components for efficiently rendering large lists and tabular data

React components for efficiently rendering large lists and tabular data. Check out the demo for some examples. Sponsors The following wonderful compan
🥞Data Structures and Algorithms explained and implemented in JavaScript + eBook

Data Structures and Algorithms in JavaScript This is the coding implementations of the DSA.js book and the repo for the NPM package. In this repositor
A free book that talks about design patterns/techniques used while developing with React.
React in patterns 📚 A free book that talks about design patterns/techniques used while developing with React. Book GitBook Web PDF Mobi ePub Translat
:fireworks:Interactive Online Platform that Visualizes Algorithms from Code
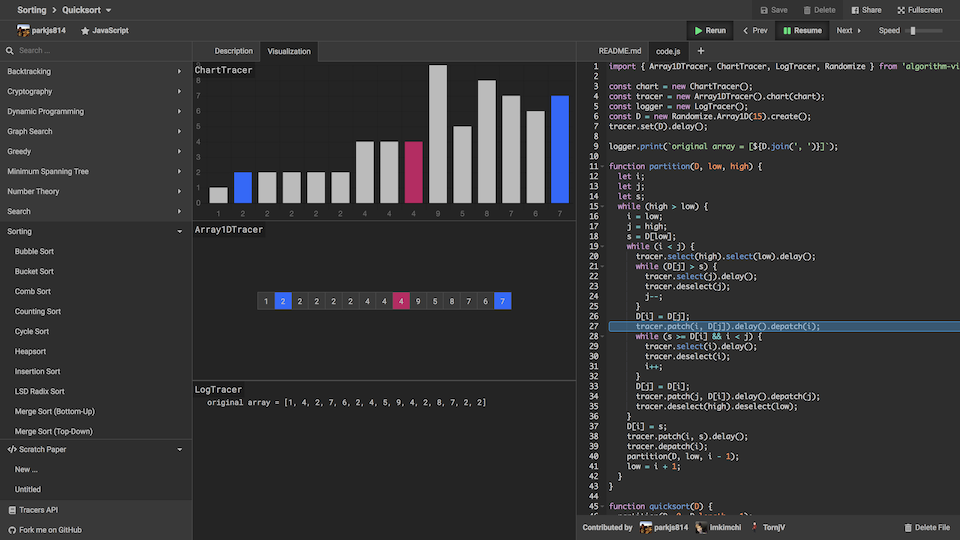
Algorithm Visualizer Algorithm Visualizer is an interactive online platform that visualizes algorithms from code. Learning an algorithm gets much easi
Knockout makes it easier to create rich, responsive UIs with JavaScript
Knockout Knockout is a JavaScript MVVM (a modern variant of MVC) library that makes it easier to create rich, desktop-like user interfaces with JavaSc
Relay is a JavaScript framework for building data-driven React applications.
Relay · Relay is a JavaScript framework for building data-driven React applications. Declarative: Never again communicate with your data store using a
📊 Data visualization library for React based on D3
Data visualization library for React based on D3js REAVIZ is a modular chart component library that leverages React natively for rendering the compone
Composable data visualisation library for web with a data-first approach now powered by WebAssembly
What is Muze? Muze is a free data visualization library for creating exploratory data visualizations (like Tableau) in browser, using WebAssembly. It
danfo.js is an open source, JavaScript library providing high performance, intuitive, and easy to use data structures for manipulating and processing structured data.
Danfojs: powerful javascript data analysis toolkit What is it? Danfo.js is a javascript package that provides fast, flexible, and expressive data stru
🌏 A Declarative 3D Globe Data Visualization Library built with Three.js
Gio.js English | 中文 React Version: react-giojs Wechat minigame: wechat usage Gio.js is an open source library for web 3D globe data visualization buil
A data visualization framework combining React & D3
Semiotic is a data visualization framework combining React & D3 Interactive Documentation API Docs on the wiki Examples Installation npm i semiotic E
:bar_chart: Re-usable, easy interface JavaScript chart library based on D3.js
billboard.js is a re-usable, easy interface JavaScript chart library, based on D3 v4+. The name "billboard" comes from the famous billboard chart whic
🍞📊 Beautiful chart for data visualization.

🍞 📈 Spread your data on TOAST UI Chart. TOAST UI Chart is Beautiful Statistical Data Visualization library. 📦 Packages The functionality of TOAST U
Powerful data visualization library based on G2 and React.

BizCharts New charting and visualization library has been released: http://bizcharts.net/products/bizCharts. More details about BizCharts Features Rea
Reusable JavaScript library for creating sketchy/hand-drawn styled charts in the browser.

roughViz.js is a reusable JavaScript library for creating sketchy/hand-drawn styled charts in the browser, based on D3v5, roughjs, and handy. Why? Use
Data visualization library for depicting quantities as animated liquid blobs
liquidity.js A data visualization library for depicting quantities as animated liquid blobs. For a demonstration of what the final product can look li
Keshif - Data Made Explorable (Prototype)
Keshif This repostory is not actively maintained. To access the most recent version and the online platform, visit www.keshif.me Keshif is a web-based
🔥 JavaScript Library for HTML5 canvas based heatmaps
heatmap.js Dynamic Heatmaps for the Web. How to get started The fastest way to get started is to install heatmap.js with bower. Just run the following
A library optimized for concise and principled data graphics and layouts.

MetricsGraphics is a library built for visualizing and laying out time-series data. At around 15kB (gzipped), it provides a simple way to produce comm
JavaScript diagramming library for interactive flowcharts, org charts, design tools, planning tools, visual languages.
GoJS, a JavaScript Library for HTML Diagrams GoJS is a JavaScript and TypeScript library for creating and manipulating diagrams, charts, and graphs. S
:bar_chart: A D3-based reusable chart library
c3 c3 is a D3-based reusable chart library that enables deeper integration of charts into web applications. Follow the link for more information: http
📊 A highly interactive data-driven visualization grammar for statistical charts.

English | 简体中文 G2 A highly interactive data-driven visualization grammar for statistical charts. Website • Tutorial Docs • Blog • G2Plot G2 is a visua
Data Visualization Components

react-vis | Demos | Docs A COMPOSABLE VISUALIZATION SYSTEM Overview A collection of react components to render common data visualization charts, such
Apache ECharts is a powerful, interactive charting and data visualization library for browser
Apache ECharts Apache ECharts is a free, powerful charting and visualization library offering an easy way of adding intuitive, interactive, and highly
Bring data to life with SVG, Canvas and HTML. :bar_chart::chart_with_upwards_trend::tada:
D3: Data-Driven Documents D3 (or D3.js) is a JavaScript library for visualizing data using web standards. D3 helps you bring data to life using SVG, C
A guard that represents a central point of control in your application
Refraction A guard that represents a central point of control in your application. Modern javascript applications are often organized into modules, wh
📝 Algorithms and data structures implemented in JavaScript with explanations and links to further readings

📝 Algorithms and data structures implemented in JavaScript with explanations and links to further readings