340 Repositories
JavaScript time-series-visualization Libraries
React friendly API wrapper around MapboxGL JS
react-map-gl | Docs react-map-gl is a suite of React components designed to provide a React API for Mapbox GL JS-compatible libraries. More informatio
Data Visualization Components

react-vis | Demos | Docs A COMPOSABLE VISUALIZATION SYSTEM Overview A collection of react components to render common data visualization charts, such
A collection of composable React components for building interactive data visualizations

an ecosystem of composable React components for building interactive data visualizations. Victory Contents Getting Started Victory Native API Document
Tweak React components in real time. (Deprecated: use Fast Refresh instead.)
React Hot Loader Tweak React components in real time ⚛️ ⚡️ Watch Dan Abramov's talk on Hot Reloading with Time Travel. Moving towards next step React-
🐯 visx | visualization components

visx visx is a collection of reusable low-level visualization components. visx combines the power of d3 to generate your visualization with the benefi
🏊 Dive into ES6 and the future of JavaScript
Practical Modern JavaScript Dive into ES6 and the future of JavaScript 🏊 Modular JavaScript is a book series with the mission of improving our collec
An interactive git visualization and tutorial. Aspiring students of git can use this app to educate and challenge themselves towards mastery of git!

LearnGitBranching LearnGitBranching is a git repository visualizer, sandbox, and a series of educational tutorials and challenges. Its primary purpose
:fireworks:Interactive Online Platform that Visualizes Algorithms from Code
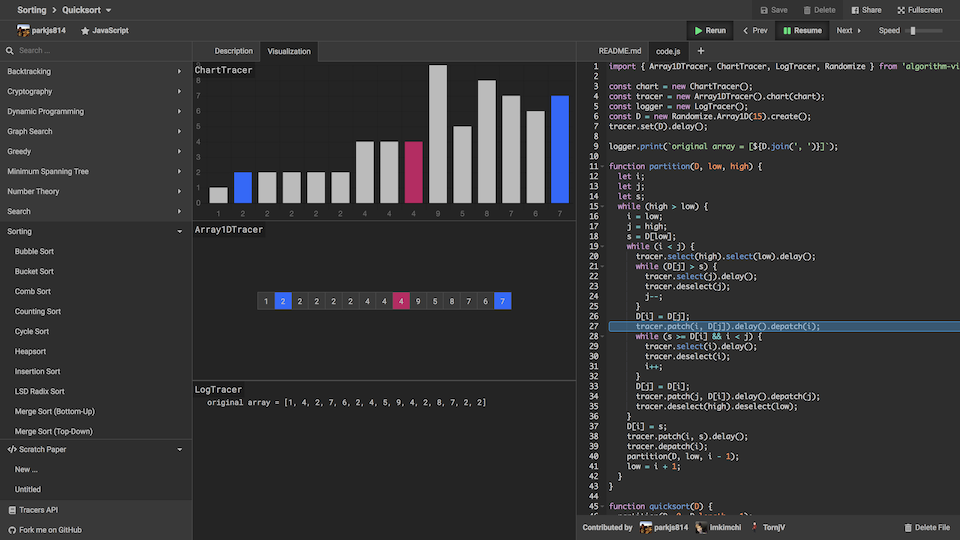
Algorithm Visualizer Algorithm Visualizer is an interactive online platform that visualizes algorithms from code. Learning an algorithm gets much easi
A book series on JavaScript. @YDKJS on twitter.

You Don't Know JS Yet (book series) - 2nd Edition This is a series of books diving deep into the core mechanisms of the JavaScript language. This is t
📊 Data visualization library for React based on D3
Data visualization library for React based on D3js REAVIZ is a modular chart component library that leverages React natively for rendering the compone
A React toolkit for graph visualization based on G6
Graphin A React toolkit for graph analysis based on G6 English | 简体中文 ✨ Features 🎨 Good-looking elements, standardized style configuration Graphin st
Composable data visualisation library for web with a data-first approach now powered by WebAssembly
What is Muze? Muze is a free data visualization library for creating exploratory data visualizations (like Tableau) in browser, using WebAssembly. It
🌏 A Declarative 3D Globe Data Visualization Library built with Three.js
Gio.js English | 中文 React Version: react-giojs Wechat minigame: wechat usage Gio.js is an open source library for web 3D globe data visualization buil
A data visualization framework combining React & D3
Semiotic is a data visualization framework combining React & D3 Interactive Documentation API Docs on the wiki Examples Installation npm i semiotic E
Interactive visualizations of time series using JavaScript and the HTML canvas tag

dygraphs JavaScript charting library The dygraphs JavaScript library produces interactive, zoomable charts of time series: Learn more about it at dygr
🍞📊 Beautiful chart for data visualization.

🍞 📈 Spread your data on TOAST UI Chart. TOAST UI Chart is Beautiful Statistical Data Visualization library. 📦 Packages The functionality of TOAST U
Powerful data visualization library based on G2 and React.

BizCharts New charting and visualization library has been released: http://bizcharts.net/products/bizCharts. More details about BizCharts Features Rea
Reusable JavaScript library for creating sketchy/hand-drawn styled charts in the browser.

roughViz.js is a reusable JavaScript library for creating sketchy/hand-drawn styled charts in the browser, based on D3v5, roughjs, and handy. Why? Use
a super simple, no-nonsense diagramming library written in react that just works
Introduction DEMO: http://projectstorm.cloud/react-diagrams DOCS (wip) https://projectstorm.gitbook.io/react-diagrams Docs are currently being worked
Data visualization library for depicting quantities as animated liquid blobs
liquidity.js A data visualization library for depicting quantities as animated liquid blobs. For a demonstration of what the final product can look li
vizflow is an ES6 interactive visualization engine

Vizflow vizflow.js - a render-loop library written using EcmaScript.6 (ES6) with no other external dependencies. Vizflow is a relatively small library
Dynamic HTML5 visualization
Envision.js Fast interactive HTML5 charts. http://groups.google.com/group/envisionjs/ Features Modern Browsers, IE 6+ Mobile / Touch Support Pre-built
:dango: An interactive and responsive charting library
English | 简体中文 G2Plot A charting library based on the Grammar of Graphics. G2Plot is an interactive and responsive charting library. Based on the gram
Beautiful React SVG maps with d3-geo and topojson using a declarative api.
react-simple-maps Create beautiful SVG maps in react with d3-geo and topojson using a declarative api. Read the docs, or check out the examples. Why R
a graph visualization library using web workers and jQuery
arbor.js -------- Arbor is a graph visualization library built with web workers and jQuery. Rather than trying to be an all-encompassing framework, a
A port of the Processing visualization language to JavaScript.
⚠️ This project has been archived ⚠️ With the development of p5js and the API advances in Processing itself, as well as Processing.js itself having be
A general purpose, real-time visualization library.
Epoch By Ryan Sandor Richards Epoch is a general purpose charting library for application developers and visualization designers. It focuses on two di
Cubism.js: A JavaScript library for time series visualization.
Cubism.js Cubism.js is a D3 plugin for visualizing time series. Use Cubism to construct better realtime dashboards, pulling data from Graphite, Cube a
🔥 JavaScript Library for HTML5 canvas based heatmaps
heatmap.js Dynamic Heatmaps for the Web. How to get started The fastest way to get started is to install heatmap.js with bower. Just run the following
JavaScript toolkit for creating interactive real-time graphs
Rickshaw Rickshaw is a JavaScript toolkit for creating interactive time series graphs, developed at Shutterstock Table of Contents Getting Started Ins
Pretty time-series line graphs
Morris.js - pretty time-series line graphs Morris.js is the library that powers the graphs on http://howmanyleft.co.uk/. It's a very simple API for dr
JavaScript diagramming library for interactive flowcharts, org charts, design tools, planning tools, visual languages.
GoJS, a JavaScript Library for HTML Diagrams GoJS is a JavaScript and TypeScript library for creating and manipulating diagrams, charts, and graphs. S
Multi-Dimensional charting built to work natively with crossfilter rendered with d3.js
dc.js Dimensional charting built to work natively with crossfilter rendered using d3.js. In dc.js, each chart displays an aggregation of some attribut
A visualization grammar.
Vega: A Visualization Grammar Vega is a visualization grammar, a declarative format for creating, saving, and sharing interactive visualization design
:bar_chart: A D3-based reusable chart library
c3 c3 is a D3-based reusable chart library that enables deeper integration of charts into web applications. Follow the link for more information: http
📊 A highly interactive data-driven visualization grammar for statistical charts.

English | 简体中文 G2 A highly interactive data-driven visualization grammar for statistical charts. Website • Tutorial Docs • Blog • G2Plot G2 is a visua
Data Visualization Components
react-vis | Demos | Docs A COMPOSABLE VISUALIZATION SYSTEM Overview A collection of react components to render common data visualization charts, such
Apache ECharts is a powerful, interactive charting and data visualization library for browser
Apache ECharts Apache ECharts is a free, powerful charting and visualization library offering an easy way of adding intuitive, interactive, and highly
Bring data to life with SVG, Canvas and HTML. :bar_chart::chart_with_upwards_trend::tada:
D3: Data-Driven Documents D3 (or D3.js) is a JavaScript library for visualizing data using web standards. D3 helps you bring data to life using SVG, C
Create beautiful CSS3 powered animations in no time.
Bounce.js Bounce.js is a tool and JS library for generating beautiful CSS3 powered keyframe animations. The tool on bouncejs.com allows you to generat