96 Repositories
JavaScript echarts-provinces-map Libraries
Experiments with overlaying time-series satellite imagery on a map
Videomap.earth Experiments with overlaying time-series satellite imagery as video over maps. TODO: Add instructions on generating video files using st
This project is a web application that allows the user to select a location on a map, display the selected region, and capture an image of that region. The captured image is then applied as a texture to a 3D cuboid using BabylonJS.
Map-Babylon Client repo commit details https://github.com/hashmat-noorani/mapbox-babylon-client Server repo commit details https://github.com/hashmat
Cross-platform 2D editor that saves scenes to json
Webber's Map Editor 2D Load or create a new map Select your sprites' folder (recursively). Drag your sprites to the canvas to create instances. On the
Generate a Map Tile from a GeoTIFF File.
geotiff-tile Generate a Map Tile from a GeoTIFF File. install npm install geotiff-tile usage import { createTile } from "geotiff-tile"; createTile({
ALU Map is a web-based platform that will help students move around ALU Rwanda Campus.
ALU-MAP ALU Map is a web-based platform that will help students move around ALU Rwanda Campus. Introduction Please refer to CONTRIBUTING.md for contri
The Hacktoberfest World Map - From where are you contributing?

🗺 The Hacktoberfest World Map 🐱💻 How can I add my country? 🤔 Fork the repository. Clone the forked repository: [email protected]:YOUR_USERNAME/hackt
Iterables, streams for typescript
Iterable for Typescript Similar to what we know from C#, Dart or any other language which supports them, we use Iterables to stream over collections.
This is a demo of updating a map to show air quality data for the user’s current location using Next.js Advanced Middleware, powered by Netlify Edge Functions.
Show Local Air Quality Based on the User's Location Use AQI data to show the air quality near the current user. This is built using Next.js Advanced M
Front-End mentor project for rest maps API😊👍

REST Countries API with color theme switcher Live | Solution | Challenge Solution for a challenge from frontendmentor.io. About The Project If you're
Berlin subway map, animated

Ubähnchen ubähnchen.vercel.app An animated live map of the Berlin U-Bahn. How it works Planned mode Schedules are extracted from the GTFS data of the
svgMap is a JavaScript library that lets you easily create an interactable world map comparing customizable data for each country.
svgMap svgMap is a JavaScript library that lets you easily create an interactable world map comparing customizable data for each country. Live demo: h
Simple location picker on Leaflet map
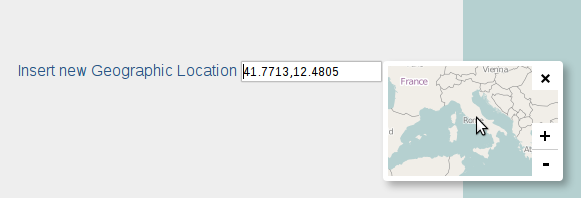
Leaflet Location Picker Simple location picker with Leaflet map Usage: labelInsert a Geo Location input id="geoloc" type="text" value="" / /lab
A lightweight JavaScript library for creating interactive maps and pretty data visualization.

Jsvectormap A lightweight Javascript library for creating interactive maps and pretty data visualization. Explore docs . Report bug · View demo · Down
A visual, interactive outline map that combines the clarity of the outline with the intuitive overview of the minimap. Alternative Minimap.

Outline Map EN | 中文 A visual, interactive outline map that combines the clarity of the outline with the intuitive overview of the minimap. Alternative
Cross provider map drawing library, supporting Mapbox, Google Maps and Leaflet out the box
Terra Draw Frictionless map drawing across mapping providers. TerraDraw centralises map drawing logic and provides a host of out the box drawing modes
Colr Pickr, a vanilla JavaScript color picker component built with SVGs, with features like saving colors. Similar design to the chrome-dev-tools color picker.

Colr Pickr Colr Pickr, a vanilla JavaScript color picking component built with SVGs, with features like saving colors. Similar design to the chrome-de
Apache ECharts Panel plugin for Grafana

Apache ECharts Panel plugin for Grafana Introduction The ECharts Panel is a plugin for Grafana that allows to visualize Apache ECharts on your Grafana
A lightweight graphic library providing 2d draw for Apache ECharts
ZRender A lightweight graphic library which provides 2d draw for Apache ECharts. Documentation https://ecomfe.github.io/zrender-doc/public/ License BS
Interactive, thoroughly customizable maps in the browser, powered by vector tiles and WebGL
Mapbox GL JS is a JavaScript library for interactive, customizable vector maps on the web. It takes map styles that conform to the Mapbox Style Specif
A map for 1337 Khouribga's new labs clusters. This tool will help 1337 students find available posts, and search for other students in the cluster by name or login.
1337KH Labs Clusters Map Hellow. This tool is made by 1337 Khouribga students for 1337 Khouribga students to help make their lives at the school easie
An extension of the Map class with more Array-like features.
BetterMap An extension of the Map class with more Array-like features. Installation There ain't no installation. It's a Deno module. Usage import { Be
Render echarts in obsidian,Apache ECharts,An Open Source JavaScript Visualization Library

obsidian-echarts Render echarts in obsidian,Apache ECharts,An Open Source JavaScript Visualization Library
Typesafe API for processing iterable data in TypeScript and JavaScript.
Stream API Type-safe API for processing iterable data in TypeScript and JavaScript similarly to Java 8 Stream API, LINQ or Kotlin Sequences. Unlike Rx
A remote nodejs Cache Server, for you to have your perfect MAP Cache Saved and useable remotely. Easy Server and Client Creations, fast, stores the Cache before stopping and restores it again!
remote-map-cache A remote nodejs Cache Server, for you to have your perfect MAP Cache Saved and useable remotely. Easy Server and Client Creations, fa
Explore Alveus Sanctuary with an interactive map and find out more about the different buildings on the property.
Alveus Sanctuary Interactive Map Explore Alveus Sanctuary with an interactive map and find out more about the different buildings on the property. htt
A remote nodejs Cached sqlite Database Server, for you to have your perfect MAP Cache Saved and useable remotely.
A remote nodejs Cached sqlite Database Server, for you to have your perfect MAP Cache Saved and useable remotely. Easy Server and Client Creations, fast, stores the Cache before stopping and restores it again! it uses ENMAP
This is the backend of Wherechat, which is a chat application that allows users to find and meet each other through their location on the map.

wherechat-backend About the project This is the backend of Wherechat, which is a chat application that allows users to find and meet each other throug
Map over an object in a preorder or postoder depth-first manner

obj-walker Walk objects like this guy. Map over an object in a preorder or postoder depth-first manner. Also, provides functions for serializing and d
🤠 Object property paths with wildcards and regexps 🌵
🤠 Object property paths with wildcards and regexps. 🌵 Get/set object properties using: ⛏️ Dot-delimited paths: foo.bar.0.baz ⭐ Wildcards: foo.*, **.
Generates an embeddable map that displays business info from an OSM object id.
# OSM Business Card Generates an embeddable map that displays business info from an OSM object id. Loads object type (n/w/r) and id from url parameter
🤠 Functional utilities using object property paths with wildcards and regexps 🌵
🤠 Functional utilities using object property paths with wildcards and regexps. 🌵 Available functional methods include: 🗺️ Mapping: map() 🚂 Merging
Userland module that implements the module path mapping that Node.js does with "exports" in package.json
exports-map Userland module that implements the module path mapping that Node.js does with "exports" in package.json npm install exports-map Usage co
A Hackable Markdown Note Application for Programmers. Version control, AI completion, mind map, documents encryption, code snippet running, integrated terminal, chart embedding, HTML applets, plug-in, and macro replacement.

Yank Note A hackable markdown note application for programmers Download | Try it Online Not ecommended English | 中文说明 [toc]{level: [2]} Highlights
An application to map out game reserves using aerial photography, intelligent image stitching and AI driven recognition focus.
Map Out Game Reserves Using Aerial Photographs An application to map out game reserves using aerial photography, intelligent image stitching and AI dr
[ThatProject] ESP32 LoRa GPS Data Viewer
![[ThatProject] ESP32 LoRa GPS Data Viewer](https://github.com/0015/LoRa_GPS_Viewer/raw/main/misc/demo.gif)
Map Viewer for MCU with LoRa & GPS Data ThatProject Channel LoRa module has caught the attention of many people for a number of reasons. Being able to
View maps, graphs, and tables of your save and compete in a casual, evergreen leaderboard of EU4 achievement speed runs. Upload and share your save with the world.

PDX Tools PDX Tools is a modern EU4 save file analyzer that allow users to view maps, graphs, and data tables of their save all within the browser. If
Map of reception points for refugees near Polish-Ukrainian border
ua-2022-map Map of reception points for refugees near Polish-Ukrainian border work in progress... Development We provide a docker-based dev environmen
An experimental hover effect, where a content preview is shown while a mini map indicates the position of the cursor.
Hover Preview Effect with Mini Map An experimental hover effect, where a content preview is shown while a mini map indicates the position of the curso
:ukraine: A self-hosted app for keeping track of employee wellbeing and dislocation during the Russo-Ukrainian war, with an interactive map.
Helping organizations stay together and help their members in times of disaster On February 24th, 2022, the lives of the entire Ukrainian nation were
🗺 A map of OSINT tools.

🕵 ️ Malfrat's OSINT Map 🗺 Available here ! Malfrat's OSINT Map is an online tree of selected useful tools made for OSINT purposes, made to help you
A JavaScript library for querying administrative regions in Cambodia including Provinces, Districts, Communes and Villages.
pumi A JavaScript library for querying administrative regions in Cambodia including Provinces, Districts, Communes and Villages. Supports Node.js, Bro
A command-line tool to convert Project Zomboid map data into Deep Zoom format

pzmap2dzi pzmap2dzi is a command-line tool running on Windows to convert Project Zomboid map data into Deep Zoom format. Features Supports both python
🖼️ Create beautiful maps from OpenStreetMap data in a webapp

prettymapp 🖼️ Prettymapp is a webapp to create beautiful maps from OpenStreetMap data (based on prettymaps) 🎈 Try it out here: prettymapp on streaml
⭐️ Auto create alias map for vite config
vite-plugin-tspaths2alias This plugin is create alias map for vite config, default use project root tsconfig.json file compilerOptions.paths value Ins
Front-end for FireNearby service. View recent fires and sign up to receive alerts: caseymm.github.io/fire-nearby
fire-nearby (firenearby service front-end) This application is composed of three pages: Map of recent fires Sign up form to receive alerts About this
Interactive map overlay for finding secrets hidden around the world of Lost Ark.

Lostark Map Overlay This is an interactive map overlay which is resizable, movable and can be kept up during gameplay for finding secrets hidden aroun
Greasemonkey script to allow marking items on the interactive map of Elden Ring as completed.
Greasemonkey script (or Tampermonkey) to allow marking items on the interactive map of Elden Ring as completed. The interactive map is a Fextralife-project, all credits for the map go to them.
A library that makes Image Map Area responsive
A library that makes Image Map Area responsive
A javascript standard data structure library which benchmark against C++ STL.
js-sdsl A javascript standard data structure library which benchmark against C++ STL. Note Note that our official version starts from 2.0.0. In order
🚏 Routes for Next.js

next-route-map 🚏 next-route-map allows you to define a route map. It automatically generates page modules that forward original modules in build time
An All-in-one Visualization Framework for TiddlyWiki5 based on ECharts
ECharts for TiddlyWiki5 When I first started using TiddlyWiki a long time ago, I wanted TiddlyWiki to be able to visualize data. I wanted to generate
Fast Map built for keys that are always fixed size uniformly distributed buffers.
turbo-hash-map Fast Map built for keys that are always fixed size uniformly distributed buffers. npm install turbo-hash-map Uses a prefix trie to map
MERN stack travel app using mapbox API, Travel and drop pin , share reviews and rate the location
MERN-Travel-Map Travel Map Pin A single page application built with MERN Stack from scratch (MongoDB + Mongoose, Express, React & NodeJs) Table of Con
Look up a city and get back weather forecast for searched city and top News headline related to that city and an interactive map which shows the location of that city.

WeatheredVibes Description As a user I want to look up a city to get the current weather and suggested current news articles based on the location sea
Use real-time computing technology and web technology to build a big data Kanban l to solve the problem. Among them, practical technologies include MySQL, Kafka, Flink, Redis, Flask and Echarts

实时计算(English Version) 运用实时计算技术、Web 技术构建一个大数据看板来解决问题。其中实用技术包括Mysql、Kafka、Flink、Redis、Flask和Echarts 目录 1.问题需求 2.方案分析 3.安装环境 4.环境启动命令和运行代码的方法 5.代码目录结构说明
Chart.js Choropleth and Bubble Maps
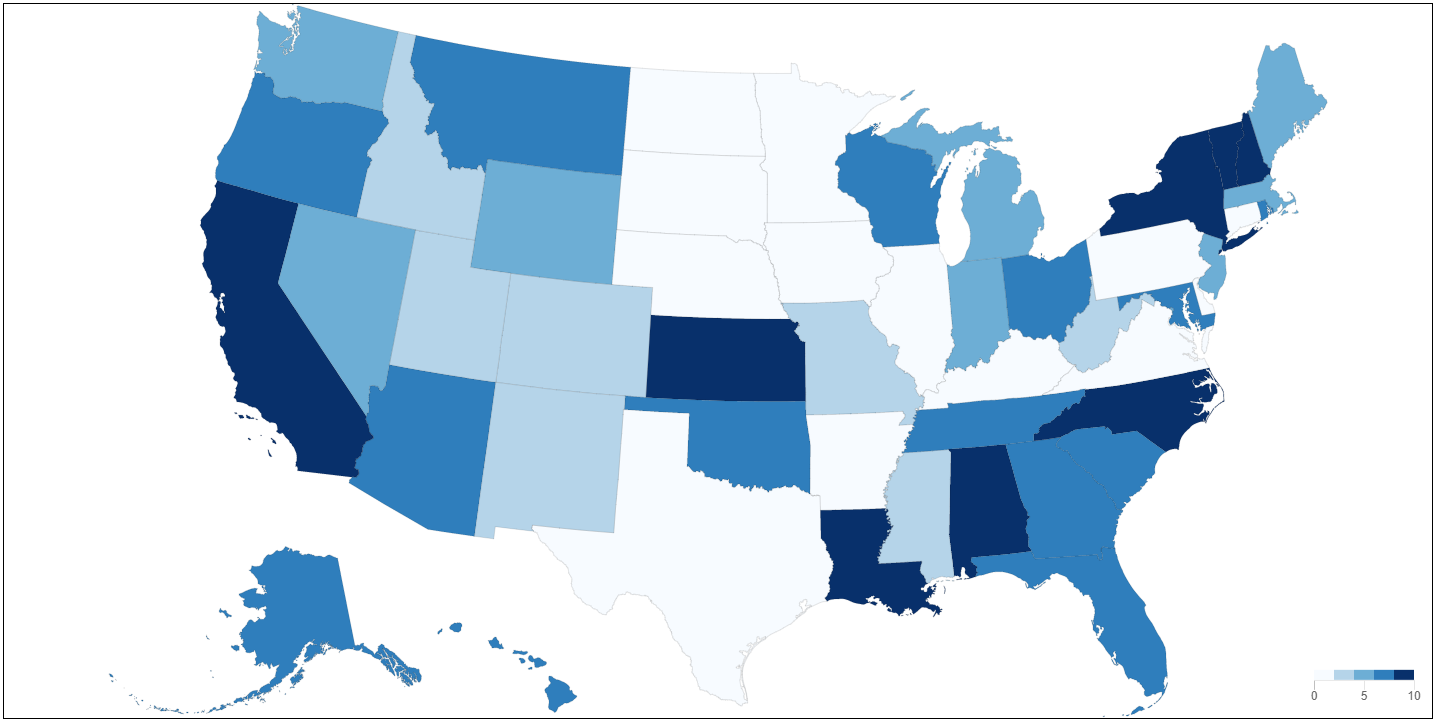
Chart.js Geo Chart.js module for charting maps with legends. Adding new chart types: choropleth and bubbleMap. works great with https://github.com/cha
generate a map server side and save/return it as png image
NFT map generator Request a new map to be generated with latitude and longitude params, for example http://localhost:3000/maps?lat=45.3579&lng=9.4427
MERN stack application which serves as an online map journal where users can mark and rate the places they've been to.

PlaceRate PlaceRate is a MERN stack application which serves as an online map journal where users can mark and rate the places they've been to. You ca
Demo of Singapore buildings 3D tiles from OneMap on Mapbox GL JS.

Singapore buildings 3D Tiles from OneMap 3D on Mapbox GL JS This is a demo of Singapore buildings 3D tiles from OneMap 3D on Mapbox GL JS. Development
Mind elixir is a free open source mind map core.
Mind-elixir is a framework agnostic mind map core
This map is tracking the position of ISS(international space setallite) at every 1 second. I use Nasa's "where the iss" API and "Leaflet.js" for the map.
ISS-tracking-map About This map is tracking the position of ISS(international space setallite) at every 1 second. I use Nasa's "where the iss" API and
3D web map rendering engine written in TypeScript using three.js

3D web map rendering engine written in TypeScript using three.js
100套大数据可视化炫酷大屏Html5模板;包含行业:社区、物业、政务、交通、金融银行等,全网最新、最多,最全、最酷、最炫大数据可视化模板。陆续更新中
100套大数据可视化模板 项目背景 #####由于自己公司项目里面用到一个数据可视化大屏页面,自己网上各种谷歌百度,发现资源良莠不齐,而且大多数都是收费的,甚至一个页面一收费的那种,前前后后自己不管是付费的还是免费的收集了不少,于是自己打算整理下,免费分享给大家,以免大家再走冤枉路。如果大家有珍藏的
This API can be use to all developers to get location details of Sri Lanka 🇱🇰 including major cities, sub areas, districts and Provinces. ⛳️
Location Data API - Sri Lanka Table of Contents Introduction Technologies Implemantations Hosting Use Cases Getting Started Project Setup Contributing
A map tool with real-time collaboration 🗺️
Mapus Maps with real-time collaboration 🗺️ Mapus is a tool to explore and annotate collaboratively on a map. You can draw, add markers, lines, areas,
Echarts画中国地图所使用的各省份地图数据。包含最新的行政规划。如,西藏那曲地区改为那曲市,山东济南合并莱芜。 后续会根据最新的区域行政规划,及时更新。
echarts-provinces-map 本项目是Echarts画中国地图所使用的各省份地图数据。包含最新的行政规划。如,西藏那曲地区改为那曲市,山东济南合并莱芜。 后续会根据最新的区域行政规划,及时更新。 因为Echarts5.0及以后的版本将不在维护省份地图数据,所以新的行政区域调整将不会在老
🎉 基于 reactjs 开发的可视化项目实战【https://wuli-admin.gitee.io/react-wuli-admin/#/workspace/fullscreen】
react-visual-data 介绍 🎉 基于 reactjs 开发的可视化项目实战 亮点 大屏设计器:自由拖拽大屏 报表设计器:自适应排列布局 动态表单:schema 设计模式 vue版本尝鲜:vue版本尝鲜 issues,欢迎提交~ 调试 git clone https://githu
aka Scaletor, take screenshots of a piece of a map and scale/compare with other parts of the map
scale-a-tron A quick-and-dirty map that lets you compare one area to another. Draw a shape around a region, zoom in to another place on the map, and c
Abstracts execution of tasks in parallel using Node.js cluster.
cluster-map Abstracts execution of tasks in parallel using Node.js cluster. It is a high level abstraction around a common pattern used to delegate a
Pipeable javascript. Quickly filter, map, and reduce from the terminal
Pipeable JavaScript - another utility like sed/awk/wc... but with JS! Quickly filter, map and reduce from the command line. Features a streaming API.
Map over promises concurrently
p-map Map over promises concurrently Useful when you need to run promise-returning & async functions multiple times with different inputs concurrently
Apache ECharts is a powerful, interactive charting and data visualization library for browser
Apache ECharts Apache ECharts is a free, powerful charting and visualization library offering an easy way of adding intuitive, interactive, and highly
Cool tips to design UI/UX on Leaflet maps.

Map Effects 100 Map Effects 100 has cool tips to design UI/UX on your Map. Map? Leaflet Quick Start git clone https://github.com/muxlab/map-effects-10
地理坐标系转换工具
Gcoord gcoord(geographic coordinates)是一个处理地理坐标系的JS库,用来修正百度地图、高德地图及其它互联网地图坐标系不统一的问题。 支持转换坐标数组和GeoJSON数据,能在node环境以及所有现代浏览器(IE8+)中运行,gzip后仅3kb。 更多信息可以阅读地
A pluggable Node.js map tile server.
TileStrata TileStrata is a pluggable "slippy map" tile server that emphasizes code-as-configuration. The primary goal is painless extendability. It's
Lightweight Node.js isochrone map server
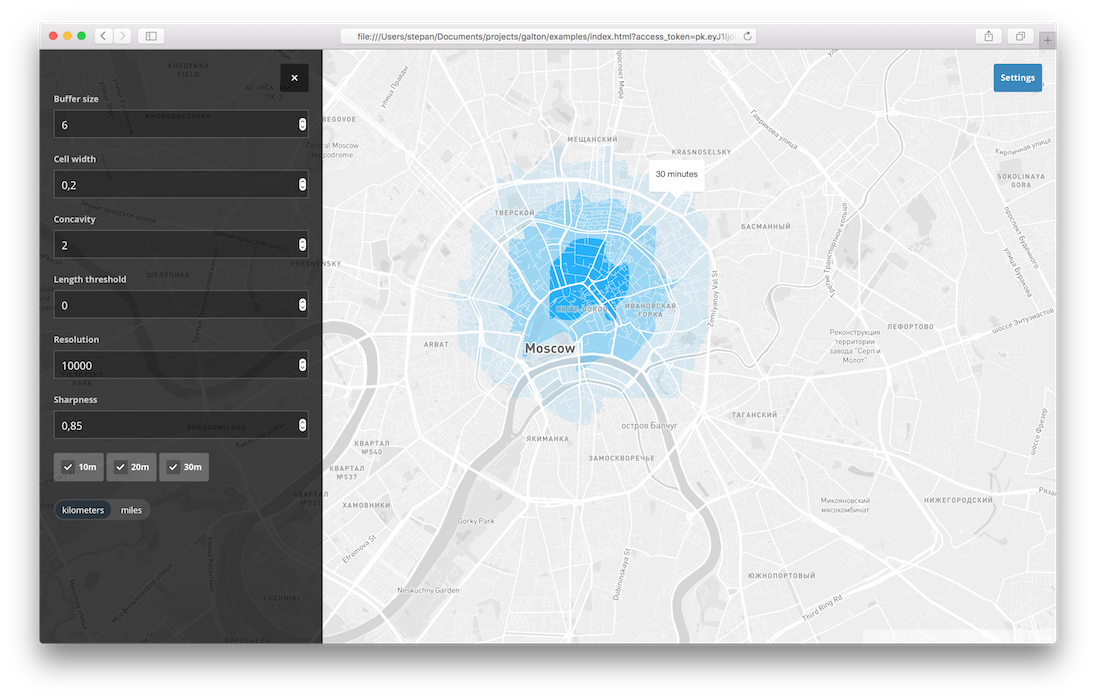
Galton Lightweight Node.js isochrone server. Build isochrones using OSRM, Turf and concaveman. Francis Galton is the author of the first known isochro
Serverless raster and vector map tile generation using Mapnik and AWS Lambda
tilegarden 🗺️ 🌻 Contents About Usage Deployment to AWS Additional Configuration Options Required AWS Permissions Features Configuration Selection an
AngularJS directive to embed an interact with maps managed by Leaflet library
Angular Leaflet Why the fork? While we are grateful for all the original work at tombatossals/angular-leaflet-directive. We need to be able to operate
Add time dimension capabilities on a Leaflet map.
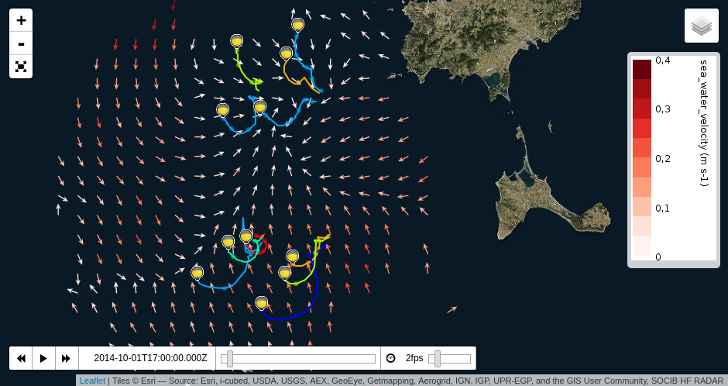
Leaflet TimeDimension Add time dimension capabilities on a Leaflet map. Examples and basic usage API L.Map L.TimeDimension L.TimeDimension.Layer L.Tim
A Node.js map tile library for PostGIS and torque.js, with CartoCSS styling

Windshaft A Node.js map tile library for PostGIS and torque.js, with CartoCSS styling. Can render arbitrary SQL queries Generates image and UTFGrid in
Converts geojson to svg string given svg viewport size and maps extent.
geojson2svg Converts geojson to svg string given svg viewport size and maps extent. Check world map, SVG scaled map and color coded map examples to de
Mapbox Visual for Power BI - High performance, custom map visuals for Power BI dashboards
Mapbox Visual for Microsoft Power BI Make sense of your big & dynamic location data with the Mapbox Visual for Power BI. Quickly design high-performan
Vue 2 components for Leaflet maps

Vue2Leaflet Vue2Leaflet is a JavaScript library for the Vue framework that wraps Leaflet making it easy to create reactive maps. How to install npm in
React components for Leaflet maps
React Leaflet React components for Leaflet maps. Documentation Getting started API reference Changes See the CHANGELOG file. Contributing See the CONT
React friendly API wrapper around MapboxGL JS
react-map-gl | Docs react-map-gl is a suite of React components designed to provide a React API for Mapbox GL JS-compatible libraries. More informatio
jQuery plugin based on raphael.js that allows you to display dynamic vector maps
jQuery Mapael - Dynamic vector maps The complete documentation is available on Mapael website (repository: 'neveldo/mapael-documentation'). Additional
JavaScript WebGL 3D map rendering engine

VTS Browser JS is a powerful JavaScript 3D map rendering engine with a very small footprint (about 163 kB of gziped JS code). It provides almost all f
jQuery Vector Map Library
This project is a heavily modified version of jVectorMap as it was in April of 2012. I chose to start fresh rather than fork their project as my inten
HashMap JavaScript class for Node.js and the browser. The keys can be anything and won't be stringified
HashMap Class for JavaScript Installation Using npm: $ npm install hashmap Using bower: $ bower install hashmap You can download the last stable ver
A complete, fully tested and documented data structure library written in pure JavaScript.
Buckets A JavaScript Data Structure Library Buckets is a complete, fully tested and documented data structure library written in pure JavaScript. Incl
jQuery Vector Map Library
This project is a heavily modified version of jVectorMap as it was in April of 2012. I chose to start fresh rather than fork their project as my inten
Mapbox JavaScript API, a Leaflet Plugin
mapbox.js A Mapbox plugin for Leaflet, a lightweight JavaScript library for traditional raster maps. For the state-of-the-art Mapbox vector maps libra
TypeScript ORM for Node.js based on Data Mapper, Unit of Work and Identity Map patterns. Supports MongoDB, MySQL, MariaDB, PostgreSQL and SQLite databases.
TypeScript ORM for Node.js based on Data Mapper, Unit of Work and Identity Map patterns. Supports MongoDB, MySQL, MariaDB, PostgreSQL and SQLite datab
Mini map for web pages.
pagemap Mini map for web pages. Example usage add a canvas tag to your HTML page: canvas id='map'/canvas fix it's position on the screen: #map {
React friendly API wrapper around MapboxGL JS
react-map-gl | Docs react-map-gl is a suite of React components designed to provide a React API for Mapbox GL JS-compatible libraries. More informatio
Apache ECharts is a powerful, interactive charting and data visualization library for browser
Apache ECharts Apache ECharts is a free, powerful charting and visualization library offering an easy way of adding intuitive, interactive, and highly