105 Repositories
JavaScript graph-algorithms Libraries
Beautiful Visualizations For Your App's Dependencies 🧭
Beautiful Visualizations For Your App's Dependencies 🪱 Outputs SVGs Powered by D3 Overlays security vulnerabilities Works with npm & yarn Made by the
Minimize the amount of walls necessary by graph theory!

minCutWall Minimize the amount of walls necessary by graph theory! I've tried my best to make the code as easy as possible to understand. Feel free to
Easy-to-use js library for building graphs using svg.
LineChart Easy-to-use js library for building graphs using svg. Examples How to use Just add linechart.js from 'src' directory to your project. And ad
Algorithms and Data Structures implemented in TypeScript for beginners, following best practices.

The Algorithms - TypeScript TypeScript Repository of TheAlgorithms, which implements various algorithms and data structures in TypeScript. These imple
This Repo Contains projects that demonstrate some concepts / algorithms / implemetation in some form of digital visualisation
Hacktoberfest 2022 OPEN FIRST Pull Request - GET STARTED WITH OPENSOURCE AND WIN SOME AWWSOME SWAGS 🎉 Contributors of Hacktoberfest 2022 This project
👓 A 3D graph for Obsidian!
Obsidian 3D Graph A 3D Graph for Obsidian! Showcase: 3d-graph-full.mp4 ⬇️ Installation This plugin is not in the official community plugin list yet, s
It will be contain many algorithms about js for job interviews.
Algortihms with Javascript 📌 📗 TR: Bu projenin temel amacı, işe girerken yapılan mülakatlar için bizlere sunulan algoritma soruları ve çözümlerini i
COVID-19 Graph
COVID-19 Tracker Live Site Stay up to date with new projects New major projects coming soon, subscribe to the mailing list to stay up to date https://
GPU supercharged attraction-graph visualizations built on top of Three.js
Force Directed Graph GPU supercharged attraction-graph visualizations for the web built on top of Three.js. Importable as an ES6 module. Simulation co
Open, extensible, small and simple behaviour-graph execution engine
Behave-Graph Behave-Graph is a standalone library that implements the concept of "behavior graphs" as a portable TypeScript library with no external r
Full stack app to journal and keep track of your overall mood each day of the year, inspired by GitHub's contribution graph.
Mood Tracker Mood tracker to journal and keep track of your overall mood each day of the year. How It's Made: Tech used: EJS, CSS, JavaScript, Node.js
Automatically construct, traverse and visualize graphs generated from your Node.js project

skott is a minimalist developer tool that can be used to efficiently generate directed graphs from your JavaScript/Node.js project. It can automatical
A GitHub action to generate a stackaid.json file based on your repository's dependency graph
generate-stackaid-json A GitHub action to generate a stackaid.json file based on your repository's dependency graph This action is primarily intended
CancerDB: A public domain knowledge graph about cancer treatments that compiles to a CSV file.
CancerDB: A public domain csv file to help build the next great cure CancerDB is a public domain database and website containing facts about all types
An open-source knowledge management app.

Cuby Text What Cuby Text is: An experimental knowledge management app An app focused on writing An open source app A personal project Cuby Text is NOT
Шпаргалка по алгоритмам и структурам данных js на русском. Алгоритмы: Линейный поиск, Бинарный поиск, Сортировка выбором, Пузыкрьковая сортировка итд.
Алгоритмы и структуры данных в javascript Алгоритм линейного поиска в массиве(Linear Search): const array = [1, 4, 5, 8, 5, 1, 2, 7, 5, 2, 11]; let c
A high-resolution local database that uses precise algorithms to easily record data in local files within a project with persistent JSON and YAML support designed to be easy to set up and use
About A high-resolution local database that uses precise algorithms to easily record data in local files within a project with persistent JSON and YML
Successor of the flowchart-fun syntax. Store tabular data and graph information in the same document.
graph-selector-syntax A syntax for storing graphs and tabular data in plain text View Examples Installation npm install graph-selector Usage import {
Implementing various sorting algorithms in Typescript's type system

Sorta Cool I was on a 10 hour flight with no WiFi, and, bored out of my mind, I thought it would be fun to implement some sorting algorithms in the Ty
Science! Testing various image matching algorithms' performance on the Pinecone vector DB
Image Matching Algorithms For Use With KNN Search As part of the development of alt-text.org, it's necessary to perform large-scale fuzzy matching of
The self-building, hot-reloading subgraph. The quickest way to start indexing your shit.
npx autographed The self-building, hot-reloading subgraph. The quickest way to start indexing your shit. 🚀 getting started Okay, so there's a lot tha
A robust, minimal-server-interaction API for peer routing in the browser

Robust, minimal-server-interaction peer routing in the browser What is this? Membrane takes signalling to the browser, creating living peer networks.
Build Schema.org graphs for JavaScript Runtimes (Browser, Node, etc). Improve your sites SEO with quick and easy Rich Results.
schema-org-graph-js The quickest and easiest way to build Schema.org graphs for JavaScript Runtimes (Browser, Node, etc). Status: 🔨 In Development Pl
A JavaScript library for visualizing Sankey diagrams.
SanKEY.js v1.0.0 last updated: 20.07.2022 Getting started SanKEY.js is a JavaScript data visualization library that provides a simple object-oriented
A GitHub action to submit your dependency graph from your Mill build to GitHub.
Mill Dependency Submission A GitHub action to submit your dependency graph from your Mill build to GitHub via their Dependency Submission API. The mai
A lightweight SolidJS component for building interactive node-based diagrams and graphs.
Convert Your Ideas To Graphs With Solid Graph! Solid Graph A lightweight and minimal Solid component for building interactive graphs and node-based ed
The friendly way to accept tips in ETH.
💸 cryptip.me The friendly way to accept tips in ETH. It's free, and no setup required. cryptip.me/your-ens-or-wallet-address Getting Started Project
Notes, challenge resolutions, and applications of the Grokking Algorithms book content with unit tests
Grokking Algorithms Statements Branches Functions Lines Notes, challenge resolutions, and applications of the Grokking Algorithms book content Index F
Simple yet flexible JavaScript charting for designers & developers
Simple yet flexible JavaScript charting for designers & developers Documentation All the links point to the new version 3 of the lib. Introduction Get
Compress program that uses H264,VP9 and Vorbis algorithms with ffmpeg to compress anime videos and audios

Vaniply Compress tool to compress videos and audios using H264,VP9 and Vorbis algorithms Installation and running Just clone the repository and open a
Write something on your contribution graph!
GitWrite Write something on your contribution graph! What is GitWrite? GitWrite is a little tool I developed that lets you add a short message to a ye
ClickCat is a firendly user interface that lets you search,explore and visualize your ClickHouse Data.

ClickCat is a firendly user interface that lets you search,explore and visualize your ClickHouse Data. We provides the following features,you can acce
Perform queries on the current graph and batch process on the results.

logseq-plugin-batch-op 对当前库进行查询并对查询结果进行批量操作。 Perform queries on the current graph and batch process on the results. 使用展示 (Usage) 批量删除 (Batch Delete) 批
Ace your next Javascript coding interview by mastering data structures and algorithms.
The Coding Interview: Algorithms + Data Structures Ace your next Javascript coding interview by mastering data structures and algorithms. Problem 1: S
API dot Open Sauced is NestJS and SupaBase powered OAS3 backend designed to remove client complexity and provide a structured graph of all @open-sauced integrations
🍕 Open Sauced Nest Supabase API 🍕 The path to your next Open Source contribution 📖 Prerequisites In order to run the project we need the following
FrontEnd Master algorithms!
next-course-starter A NextJS starter to get you started creating educational materials using Markdown Get Started Set up Node.js v14+ Clone this repo
Drag-and-drop editor for Docassemble interviews

GraphDoc Introduction GraphDoc is a web-application that has been developed on behalf of the Maastricht Law & Tech Lab, which is part of Maastricht Un
For some realizations of the title and thinking of the book Introduction to Algorithms, if there is something wrong, please correct me.
Introduction-to-Algorithms Introduce Origin of this library Some implementations of the topics in Introduction to Algorithms and some reflections on t
A personal school project to model the behaviour of the human immune system as a network graph with interactive visualisation.

An educational tool designed to help users understand the immune system. Made using Processing 5 for Java Script
A Multi-Agent Path Finding visualization website.

MAPF Visualizer A visualization tool for multi-agent path finding algorithms. About The Project This project provides a visualization tool for Multi-A
Generate static open graph images for Next.js at build time
next-static-og-images Generate static Open Graph images for Next.js at build time Getting started Installation npm i -D next-static-og-images or yarn
Toolkit for building scalable web applications with TypeScript, React, Redux and Apollo-Client
TsToolbox Toolkit for building scalable web applications with TypeScript, React, Redux and Apollo-Client (inspired by ReKit) ⚠ ⚠ ⚠ Work in Progress ⚠
A obsidian.md plugin for rendering maths graphs.

obsidian-functionplot A plugin for displaying mathematical graphs in obsidian.md. Remember to star this plugin on Github if you like it. How to use Ty
Path-finding & Sorting algorithms Visualizer
Update - Changelog 📋 09.05.2022 AlgoVision is now fully mobile-responsive for all its features ! On mobile, the 'Mouse Chase' option in Dynamic Mode
Compress program that uses H264,VP9 and Vorbis algorithms with ffmpeg to compress anime videos and audios
Vaniply Compress tool to compress videos and audios using H264,VP9 and Vorbis algorithms Installation and running Just clone the repository and open a
neo4j graph visualization using d3.js

neo4jd3.js 基于d3.js的封装的图数据库的可视化界面,不依赖任何外部框架如: vue, react等;内部实现了节点的展示 Code structure ├── core # core 核心功能 │ └── neo4jToolsIcon
Sorting visualizer to introduce students to different sorting algorithms, how they work, and how to apply them
sorting-visualizer Sorting visualizer to introduce students to different sorting algorithms, how they work, and how to apply them Iteration 1 Demo: ht
A Typescript companion to the book A Common-Sense Guide to Data Structures and Algorithms by Jay Wengrow

This repository aims to be a companion to the book A Common-Sense Guide to Data Structures and Algorithms by Jay Wengrow. I rewrote most of the data s
Data structures & algorithms implementations and coding problem solutions. Written in Typescript and tested with Jest. Coding problems are pulled from LeetCode and Daily Coding Problem.
technical-interview-prep Data structures & algorithms implementations and coding problem solutions. Written in Typescript and tested with Jest. Coding
k-means algorithm module for n-dimensional data
K-Means Algorithm This module allows you to compute the k-Means algorithm with n-dimensional data. You simply put in your data as a list and the k you
Lenster is a decentralized, and permissionless social media app built with Lens Protocol 🌿
Lenster Decentralized, and permissionless social media app 🌿 lenster.xyz » Discord • Issues 🌿 About Lenster Lenster is a decentralized, and permissi
JSON Visio is data visualization tool for your json data which seamlessly illustrates your data on graphs without having to restructure anything, paste directly or import file.
JSON Visio is data visualization tool for your json data which seamlessly illustrates your data on graphs without having to restructure anything, paste directly or import file.
Desktop App for mdSilo: Tiny Knowledge silo on your desktop.
mdSilo A mind silo for storing ideas, thought, knowledge with a powerful writing tool. built with React and Tauri. Demo Discord This is desktop app, a
An implementation of Interaction Nets in JavaScript.
Interaction Nets An implementation of Interaction Nets in JavaScript. Use S-expression as overall syntax. Use Forth-like postfix stack-based syntax to
Subgraph to query Doodles NFT tokens along with the traits and owners.
Doodles Subgraph API Subgraph to query Doodles NFT tokens along with the traits and owners. How to use the API Try it out here Example query: { toke
Decompose algorithms in commutator notation.
Commutator Decompose algorithms in commutator notation. Let be any group. If , then the commutator of and is the element . The expression denotes the
CyberGraph is a 3D-graph based, user based social connection explorer

CyberGraph is a 3D-graph based, user based social connection explorer. It has some cool features like 3d node graph, dynamic loading bar, immersive user experience, cyber mode(10-hops friendship network display) and focus mode(aggregated connection display).
A simple To-do list page, build with Webpack, HTML, CSS, and mostly JavaScript

This is a simple To-do list page, build with Webpack, HTML, CSS, and mostly JavaScript. You can add, remove, edit and complete tasks, then clear all completed.
Highly customizable, animated, responsive, and dependency-free Evolution Graph implementation
Highly customizable, animated, responsive, and dependency-free Evolution Graph implementation. The package is built with Vanilla JavaScript and is used to create flexible data visualizations and present evolution relationships between entities.
Build a blog site using Nextjs, Tailwind css, GraphQL, Graph CMS

NextJs-GraphQL-blog-site 1. Key Features 2. Technologies I've used Key Features: 🟢 In Graph-CMS side we can create post, categories, check the commen
Visualize the Directed Acyclic Graph that Git creates to connect Commit, Tree and Blob objects internally.

Git Graph Visualize the Directed Acyclic Graph that Git creates to connect Commit, Tree and Blob objects. Hosted at HarshKapadia2.github.io/git-graph.
Code accompanying my illustrated Data structures video series on YouTube
Code accompanying my illustrated Data structures video series on YouTube
Typescript based monte-carlo acyclic graph search algorithm for multiplayer games
Typescript based monte-carlo acyclic graph search algorithm for multiplayer games. It can be used in any turn-based strategic multiplayer games.
Clustering algorithms implemented in Javascript for Node.js and the browser
Clustering.js ####Clustering algorithms implemented in Javascript for Node.js and the browser Examples License Copyright (c) 2013 Emil Bay github@tixz
Run XGBoost model and make predictions in Node.js
XGBoost-Node eXtreme Gradient Boosting Package in Node.js XGBoost-Node is a Node.js interface of XGBoost. XGBoost is a library from DMLC. It is design
Tushar Nankani's blog - Undirected Graph

The overload of ideas has pushed me to connect the dots, analogous to my directionless, although somehow connected thoughts forming a data structure.
Chart.js Graph-like Charts (tree, force directed)

Chart.js Graphs Chart.js module for charting graphs. Adding new chart types: graph, forceDirectedGraph, dendogram, and tree. Works great with https://
Chart.js plugin for Prometheus data loading

Welcome to chartjs-plugin-datasource-prometheus 👋 A Prometheus datasource for ChartJS. Dependencies: requires chart.js 2.7 or later. requires moment.
This app helps you keep track of your expenses in months and years. Also, it shows a graph representing those expenses.
Expenses Tracker This app helps you keep track of your expenses in months and years. Also, it shows a graph representing those expenses. Built With Ma
Diagram-maker - A library to display an interactive editor for any graph-like data.

Diagram Maker Diagram Maker is a library to display an interactive editor for any graph-like data. Following is a screenshot from one of the consumers
Drawflow - Simple flow library 🖥️🖱️

Drawflow Simple flow library. Drawflow allows you to create data flows easily and quickly. Installing only a javascript library and with four lines of
Venni backend - The backend of the Venni client apps implementing the credit card payments, matching algorithms, bank transfers, trip rating system, and more.
Cloud Functions Description This repository contains the cloud functions used in the Firebase backend of the Venni apps. Local Development Setup For t
don't use ml if graph is there
This is a Next.js project bootstrapped with create-next-app. Getting Started First, run the development server: npm run dev # or yarn dev Open http://
Sorting Arrays as simple as it gets.
Sort Sorting Arrays as simple as it gets. This module is published at: https://deno.land/x/sort. Simple Usage Example import { SortService, Direction
Algorithm visualizer made with React, Material UI and P5JS.
Made with React, P5JS and Material UI. Link https://andresrodriguez55.github.io/algorithmsVisualizer/#/ Description The purpose of doing this was to l
Free Bootstrap 5 Admin and Dashboard Template that comes with all essential dashboard components, elements, charts, graph and application pages. Download now for free and use with personal or commercial projects.
PlainAdmin - Free Bootstrap 5 Dashboard Template PlainAdmin is a free and open-source Bootstrap 5 admin and dashboard template that comes with - all e
A web app that shows visualizations of the most used graphs algorithms such as BFS, DFS, Dijsktra, Minimum spanning tree, etc. It allows you to draw your own graph.
Graph Visualizer Draw your own graphs and visualize the most common graph algorithms This web application allows you to draw a graph from zero, with p
An example repository on how to start building graph applications on streaming data. Just clone and start building 💻 💪
Example Streaming App 🚀 🚀 This repository serves as a point of reference when developing a streaming application with Memgraph and a message broker
Presentation and materials for The Graph developers taking their first space-walk 🧑🚀
Welcome to thegraph-hacker-kit 👋 Presentation and materials for The Graph developers taking their first space-walk 🧑🚀 Are you ready to learn how t
A knowledge management garden for https://obsidian.md, in which to grow your ideas

🪨 🌱 The Obsidian Garden Welcome to your Knowledge Garden The Obsidian Garden is both guide in helping you create your own knowledge system, and a kn
Bringing an all Open-Source Platform to study Data Structures and Algorithms ⚡
NeoAlgo-Docs Bringing an all Open-Source Platform to study Data Structures and Algorithms ⚡ 🔧 Installation You will need to have NodeJS and Yarn inst
Simple tiny dependency graph engine, MobX inspired
🜉 Quarx Simple tiny dependency graph engine, MobX inspired Introduction In less than 200 lines of code and zero dependencies Quarx supports most of M
Created with CodeSandbox
Complete Intro to Computer Science: Algorithms and Data Structures As taught by Brian Holt for Frontend Masters Learn computer science with Brian Holt
Graph theory (network) library for visualisation and analysis
Cytoscape.js Graph theory (network) library for visualisation and analysis : https://js.cytoscape.org Description Cytoscape.js is a fully featured gra
Free, open-source crypto trading bot, automated bitcoin / cryptocurrency trading software, algorithmic trading bots. Visually design your crypto trading bot, leveraging an integrated charting system, data-mining, backtesting, paper trading, and multi-server crypto bot deployments.

Free, open-source crypto trading bot, automated bitcoin / cryptocurrency trading software, algorithmic trading bots. Visually design your crypto trading bot, leveraging an integrated charting system, data-mining, backtesting, paper trading, and multi-server crypto bot deployments.
📈 A small, fast chart for time series, lines, areas, ohlc & bars

📈 μPlot A small (~35 KB min), fast chart for time series, lines, areas, ohlc & bars (MIT Licensed) Introduction μPlot is a fast, memory-efficient Can
3D graph viewer powered by WebGL (three.js)
Graphosaurus A three-dimensional static graph viewer. (click the image to try it out) Demos EVE Online map Add nodes incrementally Documentation JSDoc
Gephi - The Open Graph Viz Platform
Gephi - The Open Graph Viz Platform Gephi is an award-winning open-source platform for visualizing and manipulating large graphs. It runs on Windows,
🌅 Content-aware image resizer based on Seam Carving algorithm

Content-aware image resizing might be applied when it comes to changing the image proportions (i.e. reducing the width while keeping the height) and when losing some parts of the image is not desirable.
📝 Algorithms and data structures implemented in JavaScript with explanations and links to further readings

JavaScript Algorithms and Data Structures This repository contains JavaScript based examples of many popular algorithms and data structures. Each algo
An open source cybersecurity protocol for syncing decentralized graph data.
GUN is an ecosystem of tools that let you build community run and encrypted applications. Currently, Internet Archive and HackerNoon run GUN in produc
🥞Data Structures and Algorithms explained and implemented in JavaScript + eBook
Data Structures and Algorithms in JavaScript This is the coding implementations of the DSA.js book and the repo for the NPM package. In this repositor
:fireworks:Interactive Online Platform that Visualizes Algorithms from Code
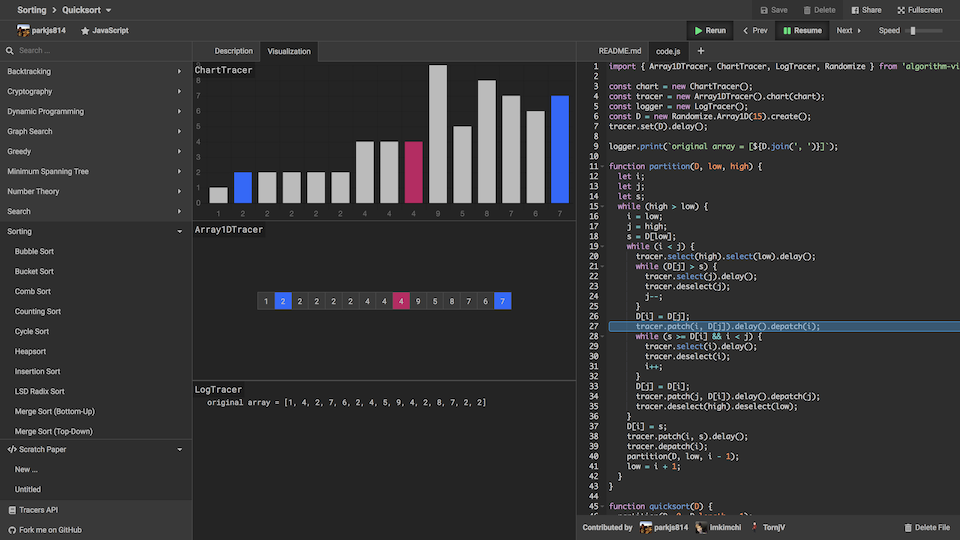
Algorithm Visualizer Algorithm Visualizer is an interactive online platform that visualizes algorithms from code. Learning an algorithm gets much easi
💯 Materials to help you rock your next coding interview
Tech Interview Handbook Credits: Illustration by @leftaligned Read on the website Black Lives Matter. Support the Equal Justice Initiative What is thi
A React toolkit for graph visualization based on G6
Graphin A React toolkit for graph analysis based on G6 English | 简体中文 ✨ Features 🎨 Good-looking elements, standardized style configuration Graphin st
:bar_chart: Re-usable, easy interface JavaScript chart library based on D3.js
billboard.js is a re-usable, easy interface JavaScript chart library, based on D3 v4+. The name "billboard" comes from the famous billboard chart whic
a graph visualization library using web workers and jQuery
arbor.js -------- Arbor is a graph visualization library built with web workers and jQuery. Rather than trying to be an all-encompassing framework, a
JavaScript toolkit for creating interactive real-time graphs
Rickshaw Rickshaw is a JavaScript toolkit for creating interactive time series graphs, developed at Shutterstock Table of Contents Getting Started Ins
JavaScript diagramming library for interactive flowcharts, org charts, design tools, planning tools, visual languages.
GoJS, a JavaScript Library for HTML Diagrams GoJS is a JavaScript and TypeScript library for creating and manipulating diagrams, charts, and graphs. S
:bar_chart: A D3-based reusable chart library
c3 c3 is a D3-based reusable chart library that enables deeper integration of charts into web applications. Follow the link for more information: http