198 Repositories
JavaScript svg-chart Libraries
📊 Vue.js wrapper for Chart.js

vue-chartjs vue-chartjs is a wrapper for Chart.js in vue. You can easily create reuseable chart components. Demo & Docs 📺 Demo 📖 Docs Compatibility
J2CL and GWT Charts library based on CHART.JS

Charba - J2CL and GWT Charts library based on CHART.JS What's Charba GWT Web toolkit doesn't have charting library available out of the box. There are
Java library for use with Chart.js javascript library
Chart.java Chart.java enables integration with the excellent Chart.js library from within a Java application. Usage example In Java: BarDataset datase
Chart.js bindings for OCaml
chartjs-ocaml: OCaml bindings for Chart.js This library provides OCaml bindings for the Chart.js charting library and some popular plugins. Following
The power of Chart.js in Jupyter !

The power of Chart.js in Jupyter Notebooks Installation You can install ipychart from your terminal using pip or conda: # using pip $ pip install ipyc
Simple package to facilitate and automate the use of charts in Laravel 5.x using Chartjs v2 library
laravel-chartjs - Chart.js v2 wrapper for Laravel 5.x Simple package to facilitate and automate the use of charts in Laravel 5.x using the Chart.js v2
A Simple Dashboard Chart in Laravel Nova using Chart JS
A Simple Dashboard Chart in Laravel Nova using Chart JS. Starting create your own dashboard with Chart JS Integration can save your time and help you maintain consistency across standard elements such as Bar, Stacked, Line, Area, Doughnut and Pie Chart.
🍞📊 Beautiful chart for data visualization.

🍞 📈 Spread your data on TOAST UI Chart. TOAST UI Chart is Beautiful Statistical Data Visualization library. 📦 Packages The functionality of TOAST U
TChart.js - simple and configurable Bar and Line Chart library in Javascript

TChart.js Simple and configurable Bar and Line Chart library in Javascript Description TChart.js is a canvas-based simple Javascript Bar and Line Char
Vue-hero-icons - A set of free MIT-licensed high-quality SVG icons, sourced from @tailwindlabs/heroicons, as Vue 2 functional components.
vue-hero-icons For Vue3, install the official package @heroicons/vue A set of free MIT-licensed high-quality SVG icons, sourced from @tailwindlabs/her
Vue-crypto-dashboard - Cryptocurrency Dashboard made with Vue

Vue Crypto Dashboard A Cryptocurrency Dashboard build with Vue JS, PWA enabled, Binance Websocket API for realtime price, amChart for displaying histo
Renders and SVG schema of SARS-CoV-2 clade as defined by Neststrain
ncov-clade-schema https://ncov-clades-schema.vercel.app/ Visualizes current tree of SARS-CoV-2 clades. Allows to generate an SVG image of this tree. C
A simple interactive web page for your Gantt Chart (build with Vue.js)

Web Gantt A simple interactive web page for your Gantt Chart (build with Vue.js) No dependency required, no command line, just download the repo and l
A simple little WordPress block that allows you add an SVG icon or graphic to your website.
A simple little WordPress block that allows you add an SVG icon or graphic to your website.
TryShape is an open-source platform to create shapes of your choice using a simple, easy-to-use interface. You can create banners, circles, polygonal shapes, export them as SVG, PNG, and even as CSS.

Create, Export, Share, and Use any Shapes of your choice. View Demo · Report Bug · Request Feature 👋 Introducing TryShape TryShape is an opensource p
A daily print-and-play roguelike adventure you can play offline.
Chronicles of Stampadia A print-and-play roguelike with a new adventure every day! Play today's adventure | Read the manual | Learn how to play | Disc
Reduce the size of SVGs

Oh My SVG Reduce the size of SVGs About Oh My SVG let you export unoptimized SVG files into smaller versions. Under the hood, it uses SVGO to remove o
Demo of the tutorial on how to craft a fullscreen SVG crosshair mouse cursor with a special distortion effect on hover.
Crosshair Mouse Cursor Distortion Demo of the tutorial on how to craft a fullscreen SVG crosshair mouse cursor with a special distortion effect on hov
JQuery plugin for creating charts
JQuery Linechart JQuery plugin for building a linechart. Chart ruler completely on HTML/CSS/JS. Bar chart, calendar view visualisation. Diagram, graph
📈 A small, fast chart for time series, lines, areas, ohlc & bars

📈 μPlot A small (~35 KB min), fast chart for time series, lines, areas, ohlc & bars (MIT Licensed) Introduction μPlot is a fast, memory-efficient Can
Smoothie Charts: smooooooth JavaScript charts for realtime streaming data
Smoothie Charts is a really small charting library designed for live streaming data. I built it to reduce the headaches I was getting from watching ch
Chart image and QR code web API
QuickChart QuickChart is a service that generates images of charts from a URL. Because these charts are simple images, they are very easy to embed in
📊 Interactive JavaScript Charts built on SVG
A modern JavaScript charting library to build interactive charts and visualizations with simple API. Our Partner ApexCharts is now a partner of Fusion
Apache ECharts is a powerful, interactive charting and data visualization library for browser
Apache ECharts Apache ECharts is a free, powerful charting and visualization library offering an easy way of adding intuitive, interactive, and highly
A lightweight 3D game engine for the web.

A lightweight 3D game engine for the web. Built with three.js and cannon-es.
700+ Pure CSS, SVG & Figma UI Icons Available in SVG Sprite, styled-components, NPM & API
700+ Pure CSS, SVG & Figma UI Icons Available in SVG Sprite, styled-components, NPM & API
Create cool animated SVG spinners, loaders and other looped animations in seconds
SVG Circus SVG Circus enables you to create cool animated SVG spinners, loaders and other looped animations in seconds. Developing To run a local SVG
The Illusion of Life: An SVG Animation Case Study
svgAnimation.js is a Snap.svg plugin used to create complex animations from simple SVGs svgAnimation takes the complexity out of creating Snap.svg ani
Lightweight, simple to use jQuery plugin to animate SVG paths
jQuery DrawSVG This plugin uses the jQuery built-in animation engine to transition the stroke on every path inside the selected svg element, using
Lazy Line Painter - A Modern JS library for SVG path animation
Lazy Line Painter lazylinepainter.info A Modern JS library for SVG path animation Getting Started | Documentation | Examples | Lazy Line Composer Gett
An experimental SVG letter animation inspired by the Dribbble shot ["Shading Letters in Illustrator"](https://dribbble.com/shots/2943049-Shading-Letters-in-Illustrator) by Jake Bartlett's. Powered by Julian Garnier's [anime.js](http://anime-js.com/).
Fancy SVG Letter Animation An experimental SVG letter animation inspired by the Dribbble shot "Shading Letters in Illustrator" by Jake Bartlett's. Pow
Some shape morphing hover effects on images using SVG clipPath.
Organic Shape Animations with SVG clipPath Some shape morphing hover effects using SVG clipPath on an image. Article on Codrops Demo Credits Anime.js
circle-svg-animation
Circle SVG Animation Plug css, js and just add short code in your html. Change the custom attribute data-percent and data-time for setting your percen
Some ideas for decorative link distortion effects using SVG filters.
Distorted Link Effects A couple of ideas for decorative link distortion effects using SVG filters on lines, circles and squares. Article on Codrops De
Javascript and SVG odometer effect library with motion blur

SVG library for transitioning numbers with motion blur JavaScript odometer or slot machine effect library for smoothly transitioning numbers with moti
Modern ways of revealing new content using SVG animations.
Page Loading Effects Modern ways of revealing new content using SVG animations. Article on Codrops Demo Integrate or build upon it for free in your pe
The slides in this slideshow wobble as they move. The effect is based on Sergey Valiukh's Dribbble shot and was made using Snap.svg and morphing SVG paths.
Wobbly Slideshow Effect The slides in this slideshow wobble as they move. The effect is based on Sergey Valiukh's Dribbble shot and was made using Sna
A decorative website background effect where SVG shapes morph and transform on scroll.
Morphing Background Shapes A decorative website background effect where SVG shapes morph and transform on scroll. Article on Codrops Demo This demo is
Tools for editing Shapefile, GeoJSON, TopoJSON and CSV files
Mapshaper Introduction Mapshaper is software for editing Shapefile, GeoJSON, TopoJSON, CSV and several other data formats, written in JavaScript. Maps
Converts geojson to svg string given svg viewport size and maps extent.
geojson2svg Converts geojson to svg string given svg viewport size and maps extent. Check world map, SVG scaled map and color coded map examples to de
JQuery plugin for creating charts
JQuery Linechart JQuery plugin for building a linechart. Chart ruler completely on HTML/CSS/JS. Bar chart, calendar view visualisation. Diagram, graph
Progressive svg pie, donut, bar and line charts
Peity Peity (sounds like deity) is a jQuery plugin that converts an element's content into a mini svg pie, donut, line or bar chart. Basic Usage HTM
jQuery plugin based on raphael.js that allows you to display dynamic vector maps
jQuery Mapael - Dynamic vector maps The complete documentation is available on Mapael website (repository: 'neveldo/mapael-documentation'). Additional
🍞📝 Markdown WYSIWYG Editor. GFM Standard + Chart & UML Extensible.
TOAST UI Editor v3 major update planning 🏃 🏃 🏃 TOAST UI Editor is planning a v3 major update for 2021. You can see our detail RoadMap here! GFM Mar
A lightweight JavaScript graphics library with the intuitive API, based on SVG/VML technology.
GraphicsJS GraphicsJS is a lightweight JavaScript graphics library with the intuitive API, based on SVG/VML technology. Overview Quick Start Articles
The lightweight library for manipulating and animating SVG
SVG.js A lightweight library for manipulating and animating SVG, without any dependencies. SVG.js is licensed under the terms of the MIT License. Inst
Javascript Canvas Library, SVG-to-Canvas (& canvas-to-SVG) Parser

Fabric.js Fabric.js is a framework that makes it easy to work with HTML5 canvas element. It is an interactive object model on top of canvas element. I
JavaScript library for HTML5 & CSS3 time sheets
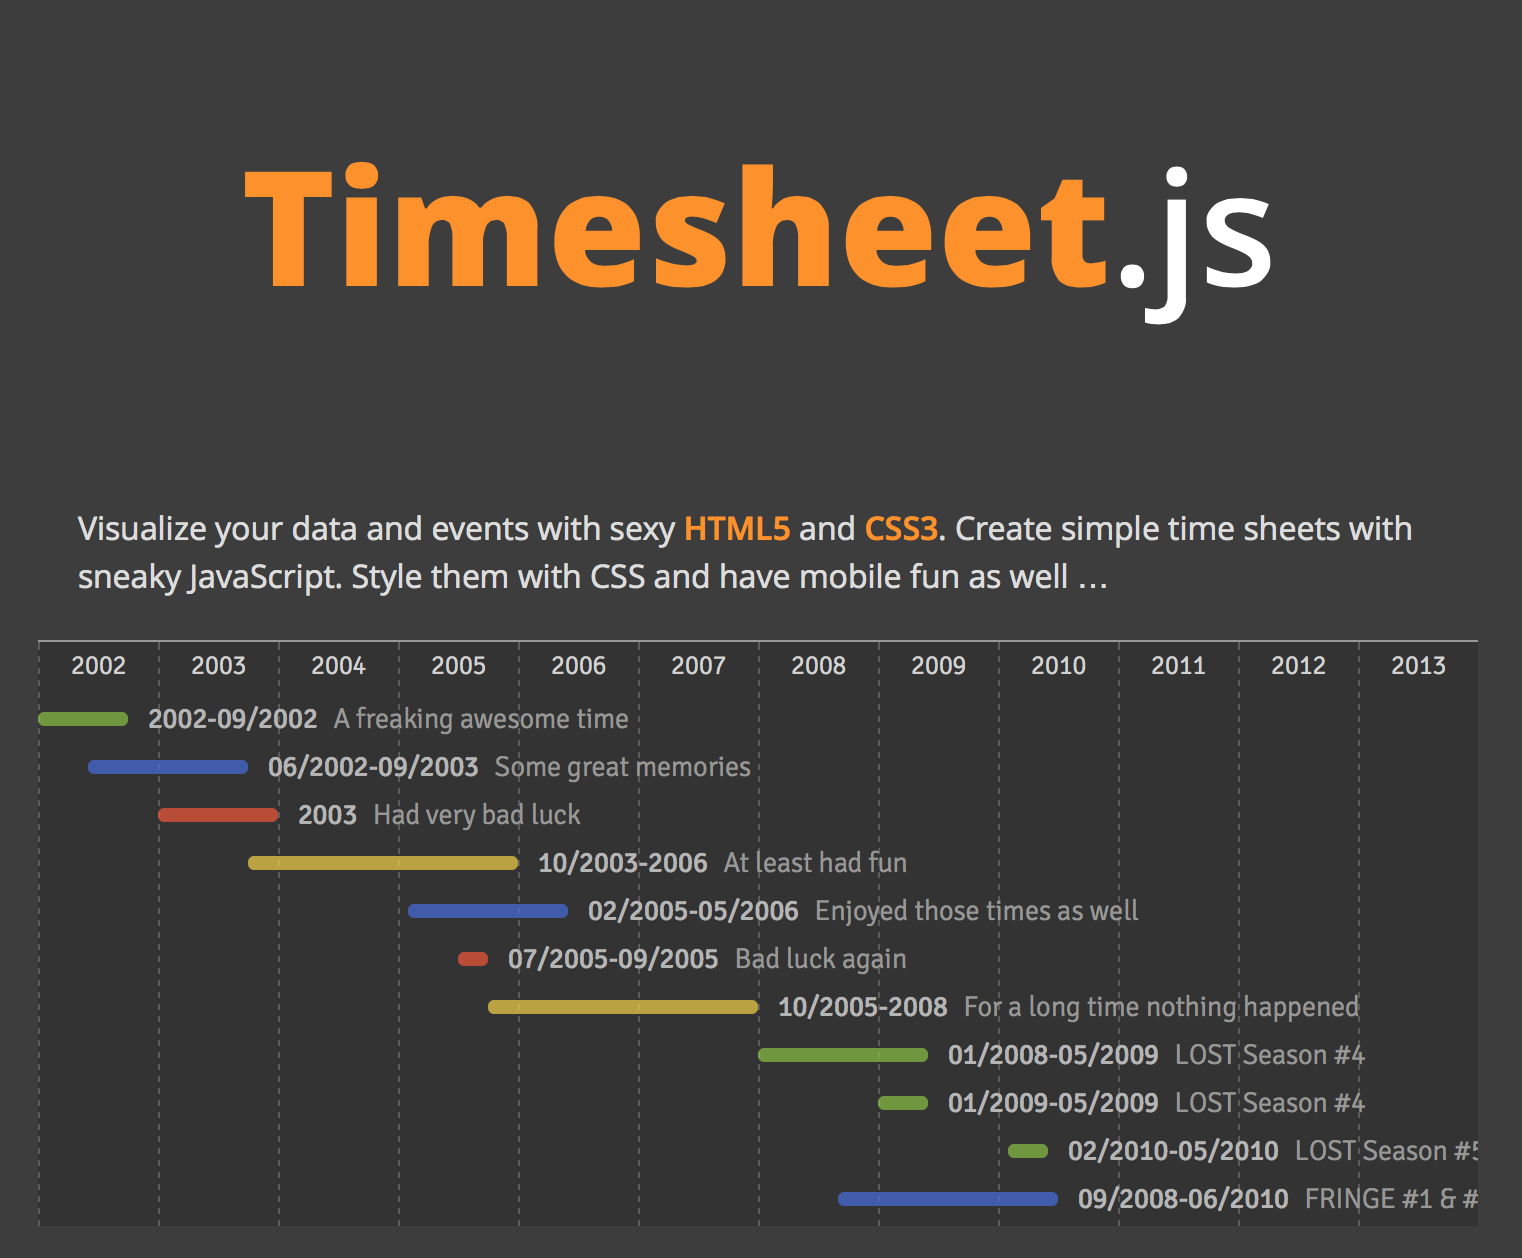
Timesheet.js Simple JavaScript library to create HTML time sheets. Wrapped in an example project using Middleman … You only have to include dist/times
Luckysheet is an online spreadsheet like excel that is powerful, simple to configure, and completely open source.
English| 简体中文 Introduction 🚀 Luckysheet is an online spreadsheet like excel that is powerful, simple to configure, and completely open source. Links
DOMPurify - a DOM-only, super-fast, uber-tolerant XSS sanitizer for HTML, MathML and SVG. DOMPurify works with a secure default, but offers a lot of configurability and hooks. Demo:
DOMPurify DOMPurify is a DOM-only, super-fast, uber-tolerant XSS sanitizer for HTML, MathML and SVG. It's also very simple to use and get started with
Modern ways of revealing new content using SVG animations.
Page Loading Effects Modern ways of revealing new content using SVG animations. Article on Codrops Demo Integrate or build upon it for free in your pe
UNMAINTAINED Open source JavaScript renderer for Kartograph SVG maps
This project is not maintained anymore. Here are a few reasons why I stopped working on kartograph.js: there's no need to support non-SVG browsers any
Lightweight, simple to use jQuery plugin to animate SVG paths
jQuery DrawSVG This plugin uses the jQuery built-in animation engine to transition the stroke on every path inside the selected svg element, using
A library for visualization and creative-coding

Pts Pts is a typescript/javascript library for visualization and creative-coding. Get started at ptsjs.org. Please give it a try, file issues, and sen
Flat, round, designer-friendly pseudo-3D engine for canvas & SVG
Zdog Round, flat, designer-friendly pseudo-3D engine View complete documentation and live demos at zzz.dog. Install Download zdog.dist.min.js minified
Create graphics with a hand-drawn, sketchy, appearance
Rough.js Rough.js is a small (9 kB) graphics library that lets you draw in a sketchy, hand-drawn-like, style. The library defines primitives to draw
svg react icons of popular icon packs
React Icons Include popular icons in your React projects easily with react-icons, which utilizes ES6 imports that allows you to include only the icons
Transform SVGs into React components 🦁
Transform SVGs into React components 🦁 Try it out online! Watch the talk at React Europe SVGR transforms SVG into ready to use components. It is part
Data Visualization Components

react-vis | Demos | Docs A COMPOSABLE VISUALIZATION SYSTEM Overview A collection of react components to render common data visualization charts, such
nivo provides a rich set of dataviz components, built on top of the awesome d3 and Reactjs libraries

nivo provides supercharged React components to easily build dataviz apps, it's built on top of d3. Several libraries already exist for React d3 integr
⚪ SVG-Powered component to easily create skeleton loadings.

SVG-Powered component to easily create placeholder loadings (like Facebook's cards loading). Features ⚙️ Customizable: Feel free to change the colors,
🐯 visx | visualization components

visx visx is a collection of reusable low-level visualization components. visx combines the power of d3 to generate your visualization with the benefi
Redefined chart library built with React and D3
Recharts Introduction Recharts is a Redefined chart library built with React and D3. The main purpose of this library is to help you to write charts i
📊 Data visualization library for React based on D3
Data visualization library for React based on D3js REAVIZ is a modular chart component library that leverages React natively for rendering the compone
Composable data visualisation library for web with a data-first approach now powered by WebAssembly
What is Muze? Muze is a free data visualization library for creating exploratory data visualizations (like Tableau) in browser, using WebAssembly. It
:bar_chart: A library of modular chart components built on D3
Plottable Plottable is a library of chart components for creating flexible, custom charts for websites. It is built on top of D3.js and provides highe
:bar_chart: Declarative Charting Framework for Angular
ngx-charts Declarative Charting Framework for Angular! ngx-charts is unique because we don't merely wrap d3, nor any other chart engine for that matte
:bar_chart: Re-usable, easy interface JavaScript chart library based on D3.js
billboard.js is a re-usable, easy interface JavaScript chart library, based on D3 v4+. The name "billboard" comes from the famous billboard chart whic
🍞📊 Beautiful chart for data visualization.
🍞 📈 Spread your data on TOAST UI Chart. TOAST UI Chart is Beautiful Statistical Data Visualization library. 📦 Packages The functionality of TOAST U
Powerful data visualization library based on G2 and React.

BizCharts New charting and visualization library has been released: http://bizcharts.net/products/bizCharts. More details about BizCharts Features Rea
a super simple, no-nonsense diagramming library written in react that just works
Introduction DEMO: http://projectstorm.cloud/react-diagrams DOCS (wip) https://projectstorm.gitbook.io/react-diagrams Docs are currently being worked
Minimalistic, animated SVG gauge. Zero dependencies
SVG Gauge Minmalistic, configurable, animated SVG gauge. Zero dependencies Buy me a coffee ☕ If you like my work please consider making a small donati
A lightweight JavaScript graphics library with the intuitive API, based on SVG/VML technology.
GraphicsJS GraphicsJS is a lightweight JavaScript graphics library with the intuitive API, based on SVG/VML technology. Overview Quick Start Articles
GPL version of Javascript Gantt Chart
dhtmlxGantt Getting started | Features | Follow us | License | Useful links dhtmlxGantt is an open source JavaScript Gantt chart that helps you illust
Awesome charts for AngularJS.

n3-line-chart v2 n3-line-chart is an easy-to-use JavaScript library for creating beautiful charts in AngularJS applications and it is built on top of
Beautiful React SVG maps with d3-geo and topojson using a declarative api.
react-simple-maps Create beautiful SVG maps in react with d3-geo and topojson using a declarative api. Read the docs, or check out the examples. Why R
Open Source Javascript Gantt

Frappe Gantt A simple, interactive, modern gantt chart library for the web View the demo » Install npm install frappe-gantt Usage Include it in your
Progressive svg pie, donut, bar and line charts
Peity Peity (sounds like deity) is a jQuery plugin that converts an element's content into a mini svg pie, donut, line or bar chart. Basic Usage HTM
A renderer agnostic two-dimensional drawing api for the web.
Two.js A two-dimensional drawing api meant for modern browsers. It is renderer agnostic enabling the same api to render in multiple contexts: webgl, c
JavaScript toolkit for creating interactive real-time graphs
Rickshaw Rickshaw is a JavaScript toolkit for creating interactive time series graphs, developed at Shutterstock Table of Contents Getting Started Ins
JavaScript diagramming library for interactive flowcharts, org charts, design tools, planning tools, visual languages.
GoJS, a JavaScript Library for HTML Diagrams GoJS is a JavaScript and TypeScript library for creating and manipulating diagrams, charts, and graphs. S
The lightweight library for manipulating and animating SVG
SVG.js A lightweight library for manipulating and animating SVG, without any dependencies. SVG.js is licensed under the terms of the MIT License. Inst
A visualization grammar.
Vega: A Visualization Grammar Vega is a visualization grammar, a declarative format for creating, saving, and sharing interactive visualization design
:bar_chart: A D3-based reusable chart library
c3 c3 is a D3-based reusable chart library that enables deeper integration of charts into web applications. Follow the link for more information: http
📊 A highly interactive data-driven visualization grammar for statistical charts.

English | 简体中文 G2 A highly interactive data-driven visualization grammar for statistical charts. Website • Tutorial Docs • Blog • G2Plot G2 is a visua
Data Visualization Components
react-vis | Demos | Docs A COMPOSABLE VISUALIZATION SYSTEM Overview A collection of react components to render common data visualization charts, such
Simple, responsive, modern SVG Charts with zero dependencies

Frappe Charts GitHub-inspired modern, intuitive and responsive charts with zero dependencies Explore Demos » Edit at CodePen » Contents Installation U
The JavaScript library for modern SVG graphics.
Snap.svg · A JavaScript SVG library for the modern web. Learn more at snapsvg.io. Follow us on Twitter. Install Bower - bower install snap.svg npm - n
Redefined chart library built with React and D3
Recharts Introduction Recharts is a Redefined chart library built with React and D3. The main purpose of this library is to help you to write charts i
Simple responsive charts
Big welcome by the Chartist Guy Checkout the documentation site at http://gionkunz.github.io/chartist-js/ Checkout this lightning talk that gives you
Javascript Canvas Library, SVG-to-Canvas (& canvas-to-SVG) Parser
Fabric.js Fabric.js is a framework that makes it easy to work with HTML5 canvas element. It is an interactive object model on top of canvas element. I
Simple HTML5 Charts using the canvas tag
Simple yet flexible JavaScript charting for designers & developers Documentation Currently, there are two versions of the library (2.9.4 and 3.x.x). V
Apache ECharts is a powerful, interactive charting and data visualization library for browser
Apache ECharts Apache ECharts is a free, powerful charting and visualization library offering an easy way of adding intuitive, interactive, and highly
JavaScript 3D library.
three.js JavaScript 3D library The aim of the project is to create an easy to use, lightweight, cross-browser, general purpose 3D library. The current
Bring data to life with SVG, Canvas and HTML. :bar_chart::chart_with_upwards_trend::tada:
D3: Data-Driven Documents D3 (or D3.js) is a JavaScript library for visualizing data using web standards. D3 helps you bring data to life using SVG, C
Javascript and SVG odometer effect library with motion blur
SVG library for transitioning numbers with motion blur JavaScript odometer or slot machine effect library for smoothly transitioning numbers with moti
The motion graphics toolbelt for the web
mo · js – The motion graphics toolbelt for the web. Intro mo · js is a javascript motion graphics library that is a fast, retina ready, modular and op
JavaScript animation engine

anime.js JavaScript animation engine | animejs.com Anime.js (/ˈæn.ə.meɪ/) is a lightweight JavaScript animation library with a simple, yet powerful AP