194 Repositories
JavaScript svg-map Libraries
Mind elixir is a free open source mind map core.
Mind-elixir is a framework agnostic mind map core
This map is tracking the position of ISS(international space setallite) at every 1 second. I use Nasa's "where the iss" API and "Leaflet.js" for the map.
ISS-tracking-map About This map is tracking the position of ISS(international space setallite) at every 1 second. I use Nasa's "where the iss" API and
A simple little WordPress block that allows you add an SVG icon or graphic to your website.
A simple little WordPress block that allows you add an SVG icon or graphic to your website.
3D web map rendering engine written in TypeScript using three.js

3D web map rendering engine written in TypeScript using three.js
TryShape is an open-source platform to create shapes of your choice using a simple, easy-to-use interface. You can create banners, circles, polygonal shapes, export them as SVG, PNG, and even as CSS.

Create, Export, Share, and Use any Shapes of your choice. View Demo · Report Bug · Request Feature 👋 Introducing TryShape TryShape is an opensource p
A daily print-and-play roguelike adventure you can play offline.
Chronicles of Stampadia A print-and-play roguelike with a new adventure every day! Play today's adventure | Read the manual | Learn how to play | Disc
A map tool with real-time collaboration 🗺️
Mapus Maps with real-time collaboration 🗺️ Mapus is a tool to explore and annotate collaboratively on a map. You can draw, add markers, lines, areas,
Echarts画中国地图所使用的各省份地图数据。包含最新的行政规划。如,西藏那曲地区改为那曲市,山东济南合并莱芜。 后续会根据最新的区域行政规划,及时更新。
echarts-provinces-map 本项目是Echarts画中国地图所使用的各省份地图数据。包含最新的行政规划。如,西藏那曲地区改为那曲市,山东济南合并莱芜。 后续会根据最新的区域行政规划,及时更新。 因为Echarts5.0及以后的版本将不在维护省份地图数据,所以新的行政区域调整将不会在老
Reduce the size of SVGs

Oh My SVG Reduce the size of SVGs About Oh My SVG let you export unoptimized SVG files into smaller versions. Under the hood, it uses SVGO to remove o
Demo of the tutorial on how to craft a fullscreen SVG crosshair mouse cursor with a special distortion effect on hover.
Crosshair Mouse Cursor Distortion Demo of the tutorial on how to craft a fullscreen SVG crosshair mouse cursor with a special distortion effect on hov
aka Scaletor, take screenshots of a piece of a map and scale/compare with other parts of the map
scale-a-tron A quick-and-dirty map that lets you compare one area to another. Draw a shape around a region, zoom in to another place on the map, and c
Abstracts execution of tasks in parallel using Node.js cluster.
cluster-map Abstracts execution of tasks in parallel using Node.js cluster. It is a high level abstraction around a common pattern used to delegate a
Pipeable javascript. Quickly filter, map, and reduce from the terminal
Pipeable JavaScript - another utility like sed/awk/wc... but with JS! Quickly filter, map and reduce from the command line. Features a streaming API.
📊 Interactive JavaScript Charts built on SVG
A modern JavaScript charting library to build interactive charts and visualizations with simple API. Our Partner ApexCharts is now a partner of Fusion
Map over promises concurrently
p-map Map over promises concurrently Useful when you need to run promise-returning & async functions multiple times with different inputs concurrently
Apache ECharts is a powerful, interactive charting and data visualization library for browser
Apache ECharts Apache ECharts is a free, powerful charting and visualization library offering an easy way of adding intuitive, interactive, and highly
A lightweight 3D game engine for the web.

A lightweight 3D game engine for the web. Built with three.js and cannon-es.
700+ Pure CSS, SVG & Figma UI Icons Available in SVG Sprite, styled-components, NPM & API
700+ Pure CSS, SVG & Figma UI Icons Available in SVG Sprite, styled-components, NPM & API
Create cool animated SVG spinners, loaders and other looped animations in seconds
SVG Circus SVG Circus enables you to create cool animated SVG spinners, loaders and other looped animations in seconds. Developing To run a local SVG
Cool tips to design UI/UX on Leaflet maps.

Map Effects 100 Map Effects 100 has cool tips to design UI/UX on your Map. Map? Leaflet Quick Start git clone https://github.com/muxlab/map-effects-10
The Illusion of Life: An SVG Animation Case Study
svgAnimation.js is a Snap.svg plugin used to create complex animations from simple SVGs svgAnimation takes the complexity out of creating Snap.svg ani
Lightweight, simple to use jQuery plugin to animate SVG paths
jQuery DrawSVG This plugin uses the jQuery built-in animation engine to transition the stroke on every path inside the selected svg element, using
Lazy Line Painter - A Modern JS library for SVG path animation
Lazy Line Painter lazylinepainter.info A Modern JS library for SVG path animation Getting Started | Documentation | Examples | Lazy Line Composer Gett
An experimental SVG letter animation inspired by the Dribbble shot ["Shading Letters in Illustrator"](https://dribbble.com/shots/2943049-Shading-Letters-in-Illustrator) by Jake Bartlett's. Powered by Julian Garnier's [anime.js](http://anime-js.com/).
Fancy SVG Letter Animation An experimental SVG letter animation inspired by the Dribbble shot "Shading Letters in Illustrator" by Jake Bartlett's. Pow
Some shape morphing hover effects on images using SVG clipPath.
Organic Shape Animations with SVG clipPath Some shape morphing hover effects using SVG clipPath on an image. Article on Codrops Demo Credits Anime.js
circle-svg-animation
Circle SVG Animation Plug css, js and just add short code in your html. Change the custom attribute data-percent and data-time for setting your percen
Some ideas for decorative link distortion effects using SVG filters.
Distorted Link Effects A couple of ideas for decorative link distortion effects using SVG filters on lines, circles and squares. Article on Codrops De
Javascript and SVG odometer effect library with motion blur

SVG library for transitioning numbers with motion blur JavaScript odometer or slot machine effect library for smoothly transitioning numbers with moti
Modern ways of revealing new content using SVG animations.
Page Loading Effects Modern ways of revealing new content using SVG animations. Article on Codrops Demo Integrate or build upon it for free in your pe
The slides in this slideshow wobble as they move. The effect is based on Sergey Valiukh's Dribbble shot and was made using Snap.svg and morphing SVG paths.
Wobbly Slideshow Effect The slides in this slideshow wobble as they move. The effect is based on Sergey Valiukh's Dribbble shot and was made using Sna
A decorative website background effect where SVG shapes morph and transform on scroll.
Morphing Background Shapes A decorative website background effect where SVG shapes morph and transform on scroll. Article on Codrops Demo This demo is
Tools for editing Shapefile, GeoJSON, TopoJSON and CSV files
Mapshaper Introduction Mapshaper is software for editing Shapefile, GeoJSON, TopoJSON, CSV and several other data formats, written in JavaScript. Maps
地理坐标系转换工具
Gcoord gcoord(geographic coordinates)是一个处理地理坐标系的JS库,用来修正百度地图、高德地图及其它互联网地图坐标系不统一的问题。 支持转换坐标数组和GeoJSON数据,能在node环境以及所有现代浏览器(IE8+)中运行,gzip后仅3kb。 更多信息可以阅读地
A pluggable Node.js map tile server.
TileStrata TileStrata is a pluggable "slippy map" tile server that emphasizes code-as-configuration. The primary goal is painless extendability. It's
Lightweight Node.js isochrone map server
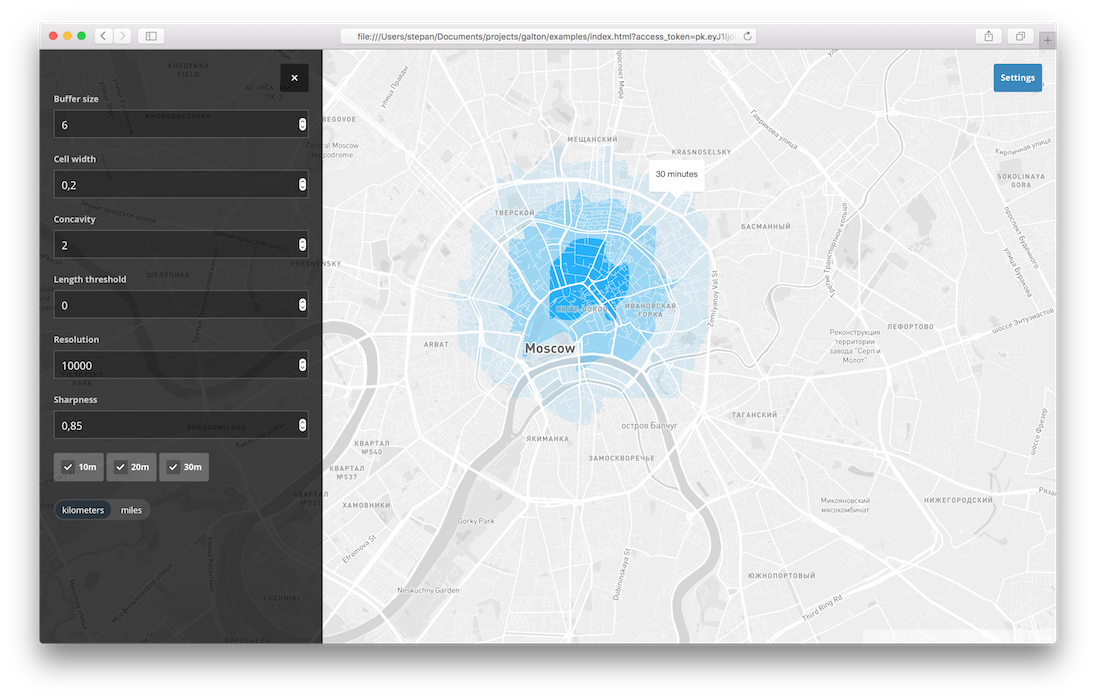
Galton Lightweight Node.js isochrone server. Build isochrones using OSRM, Turf and concaveman. Francis Galton is the author of the first known isochro
Serverless raster and vector map tile generation using Mapnik and AWS Lambda
tilegarden 🗺️ 🌻 Contents About Usage Deployment to AWS Additional Configuration Options Required AWS Permissions Features Configuration Selection an
AngularJS directive to embed an interact with maps managed by Leaflet library
Angular Leaflet Why the fork? While we are grateful for all the original work at tombatossals/angular-leaflet-directive. We need to be able to operate
Add time dimension capabilities on a Leaflet map.
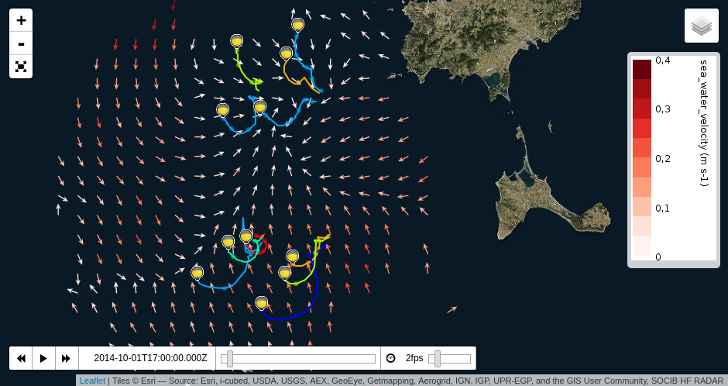
Leaflet TimeDimension Add time dimension capabilities on a Leaflet map. Examples and basic usage API L.Map L.TimeDimension L.TimeDimension.Layer L.Tim
A Node.js map tile library for PostGIS and torque.js, with CartoCSS styling

Windshaft A Node.js map tile library for PostGIS and torque.js, with CartoCSS styling. Can render arbitrary SQL queries Generates image and UTFGrid in
Converts geojson to svg string given svg viewport size and maps extent.
geojson2svg Converts geojson to svg string given svg viewport size and maps extent. Check world map, SVG scaled map and color coded map examples to de
Mapbox Visual for Power BI - High performance, custom map visuals for Power BI dashboards
Mapbox Visual for Microsoft Power BI Make sense of your big & dynamic location data with the Mapbox Visual for Power BI. Quickly design high-performan
Vue 2 components for Leaflet maps

Vue2Leaflet Vue2Leaflet is a JavaScript library for the Vue framework that wraps Leaflet making it easy to create reactive maps. How to install npm in
React components for Leaflet maps
React Leaflet React components for Leaflet maps. Documentation Getting started API reference Changes See the CHANGELOG file. Contributing See the CONT
React friendly API wrapper around MapboxGL JS
react-map-gl | Docs react-map-gl is a suite of React components designed to provide a React API for Mapbox GL JS-compatible libraries. More informatio
Progressive svg pie, donut, bar and line charts
Peity Peity (sounds like deity) is a jQuery plugin that converts an element's content into a mini svg pie, donut, line or bar chart. Basic Usage HTM
jQuery plugin based on raphael.js that allows you to display dynamic vector maps
jQuery Mapael - Dynamic vector maps The complete documentation is available on Mapael website (repository: 'neveldo/mapael-documentation'). Additional
JavaScript WebGL 3D map rendering engine

VTS Browser JS is a powerful JavaScript 3D map rendering engine with a very small footprint (about 163 kB of gziped JS code). It provides almost all f
jQuery Vector Map Library
This project is a heavily modified version of jVectorMap as it was in April of 2012. I chose to start fresh rather than fork their project as my inten
A lightweight JavaScript graphics library with the intuitive API, based on SVG/VML technology.
GraphicsJS GraphicsJS is a lightweight JavaScript graphics library with the intuitive API, based on SVG/VML technology. Overview Quick Start Articles
The lightweight library for manipulating and animating SVG
SVG.js A lightweight library for manipulating and animating SVG, without any dependencies. SVG.js is licensed under the terms of the MIT License. Inst
Javascript Canvas Library, SVG-to-Canvas (& canvas-to-SVG) Parser

Fabric.js Fabric.js is a framework that makes it easy to work with HTML5 canvas element. It is an interactive object model on top of canvas element. I
HashMap JavaScript class for Node.js and the browser. The keys can be anything and won't be stringified
HashMap Class for JavaScript Installation Using npm: $ npm install hashmap Using bower: $ bower install hashmap You can download the last stable ver
A complete, fully tested and documented data structure library written in pure JavaScript.
Buckets A JavaScript Data Structure Library Buckets is a complete, fully tested and documented data structure library written in pure JavaScript. Incl
DOMPurify - a DOM-only, super-fast, uber-tolerant XSS sanitizer for HTML, MathML and SVG. DOMPurify works with a secure default, but offers a lot of configurability and hooks. Demo:
DOMPurify DOMPurify is a DOM-only, super-fast, uber-tolerant XSS sanitizer for HTML, MathML and SVG. It's also very simple to use and get started with
Modern ways of revealing new content using SVG animations.
Page Loading Effects Modern ways of revealing new content using SVG animations. Article on Codrops Demo Integrate or build upon it for free in your pe
jQuery Vector Map Library
This project is a heavily modified version of jVectorMap as it was in April of 2012. I chose to start fresh rather than fork their project as my inten
Mapbox JavaScript API, a Leaflet Plugin
mapbox.js A Mapbox plugin for Leaflet, a lightweight JavaScript library for traditional raster maps. For the state-of-the-art Mapbox vector maps libra
UNMAINTAINED Open source JavaScript renderer for Kartograph SVG maps
This project is not maintained anymore. Here are a few reasons why I stopped working on kartograph.js: there's no need to support non-SVG browsers any
Lightweight, simple to use jQuery plugin to animate SVG paths
jQuery DrawSVG This plugin uses the jQuery built-in animation engine to transition the stroke on every path inside the selected svg element, using
TypeScript ORM for Node.js based on Data Mapper, Unit of Work and Identity Map patterns. Supports MongoDB, MySQL, MariaDB, PostgreSQL and SQLite databases.
TypeScript ORM for Node.js based on Data Mapper, Unit of Work and Identity Map patterns. Supports MongoDB, MySQL, MariaDB, PostgreSQL and SQLite datab
Mini map for web pages.
pagemap Mini map for web pages. Example usage add a canvas tag to your HTML page: canvas id='map'/canvas fix it's position on the screen: #map {
A library for visualization and creative-coding

Pts Pts is a typescript/javascript library for visualization and creative-coding. Get started at ptsjs.org. Please give it a try, file issues, and sen
Flat, round, designer-friendly pseudo-3D engine for canvas & SVG
Zdog Round, flat, designer-friendly pseudo-3D engine View complete documentation and live demos at zzz.dog. Install Download zdog.dist.min.js minified
Create graphics with a hand-drawn, sketchy, appearance
Rough.js Rough.js is a small (9 kB) graphics library that lets you draw in a sketchy, hand-drawn-like, style. The library defines primitives to draw
React friendly API wrapper around MapboxGL JS
react-map-gl | Docs react-map-gl is a suite of React components designed to provide a React API for Mapbox GL JS-compatible libraries. More informatio
svg react icons of popular icon packs
React Icons Include popular icons in your React projects easily with react-icons, which utilizes ES6 imports that allows you to include only the icons
Transform SVGs into React components 🦁
Transform SVGs into React components 🦁 Try it out online! Watch the talk at React Europe SVGR transforms SVG into ready to use components. It is part
nivo provides a rich set of dataviz components, built on top of the awesome d3 and Reactjs libraries

nivo provides supercharged React components to easily build dataviz apps, it's built on top of d3. Several libraries already exist for React d3 integr
⚪ SVG-Powered component to easily create skeleton loadings.

SVG-Powered component to easily create placeholder loadings (like Facebook's cards loading). Features ⚙️ Customizable: Feel free to change the colors,
🐯 visx | visualization components

visx visx is a collection of reusable low-level visualization components. visx combines the power of d3 to generate your visualization with the benefi
Composable data visualisation library for web with a data-first approach now powered by WebAssembly
What is Muze? Muze is a free data visualization library for creating exploratory data visualizations (like Tableau) in browser, using WebAssembly. It
:bar_chart: Declarative Charting Framework for Angular
ngx-charts Declarative Charting Framework for Angular! ngx-charts is unique because we don't merely wrap d3, nor any other chart engine for that matte
:bar_chart: Re-usable, easy interface JavaScript chart library based on D3.js
billboard.js is a re-usable, easy interface JavaScript chart library, based on D3 v4+. The name "billboard" comes from the famous billboard chart whic
a super simple, no-nonsense diagramming library written in react that just works
Introduction DEMO: http://projectstorm.cloud/react-diagrams DOCS (wip) https://projectstorm.gitbook.io/react-diagrams Docs are currently being worked
Minimalistic, animated SVG gauge. Zero dependencies
SVG Gauge Minmalistic, configurable, animated SVG gauge. Zero dependencies Buy me a coffee ☕ If you like my work please consider making a small donati
A lightweight JavaScript graphics library with the intuitive API, based on SVG/VML technology.
GraphicsJS GraphicsJS is a lightweight JavaScript graphics library with the intuitive API, based on SVG/VML technology. Overview Quick Start Articles
Beautiful React SVG maps with d3-geo and topojson using a declarative api.
react-simple-maps Create beautiful SVG maps in react with d3-geo and topojson using a declarative api. Read the docs, or check out the examples. Why R
Progressive svg pie, donut, bar and line charts
Peity Peity (sounds like deity) is a jQuery plugin that converts an element's content into a mini svg pie, donut, line or bar chart. Basic Usage HTM
A renderer agnostic two-dimensional drawing api for the web.
Two.js A two-dimensional drawing api meant for modern browsers. It is renderer agnostic enabling the same api to render in multiple contexts: webgl, c
JavaScript toolkit for creating interactive real-time graphs
Rickshaw Rickshaw is a JavaScript toolkit for creating interactive time series graphs, developed at Shutterstock Table of Contents Getting Started Ins
The lightweight library for manipulating and animating SVG
SVG.js A lightweight library for manipulating and animating SVG, without any dependencies. SVG.js is licensed under the terms of the MIT License. Inst
A visualization grammar.
Vega: A Visualization Grammar Vega is a visualization grammar, a declarative format for creating, saving, and sharing interactive visualization design
:bar_chart: A D3-based reusable chart library
c3 c3 is a D3-based reusable chart library that enables deeper integration of charts into web applications. Follow the link for more information: http
📊 A highly interactive data-driven visualization grammar for statistical charts.

English | 简体中文 G2 A highly interactive data-driven visualization grammar for statistical charts. Website • Tutorial Docs • Blog • G2Plot G2 is a visua
Simple, responsive, modern SVG Charts with zero dependencies

Frappe Charts GitHub-inspired modern, intuitive and responsive charts with zero dependencies Explore Demos » Edit at CodePen » Contents Installation U
The JavaScript library for modern SVG graphics.
Snap.svg · A JavaScript SVG library for the modern web. Learn more at snapsvg.io. Follow us on Twitter. Install Bower - bower install snap.svg npm - n
Simple responsive charts
Big welcome by the Chartist Guy Checkout the documentation site at http://gionkunz.github.io/chartist-js/ Checkout this lightning talk that gives you
Javascript Canvas Library, SVG-to-Canvas (& canvas-to-SVG) Parser
Fabric.js Fabric.js is a framework that makes it easy to work with HTML5 canvas element. It is an interactive object model on top of canvas element. I
Apache ECharts is a powerful, interactive charting and data visualization library for browser
Apache ECharts Apache ECharts is a free, powerful charting and visualization library offering an easy way of adding intuitive, interactive, and highly
JavaScript 3D library.
three.js JavaScript 3D library The aim of the project is to create an easy to use, lightweight, cross-browser, general purpose 3D library. The current
Bring data to life with SVG, Canvas and HTML. :bar_chart::chart_with_upwards_trend::tada:
D3: Data-Driven Documents D3 (or D3.js) is a JavaScript library for visualizing data using web standards. D3 helps you bring data to life using SVG, C
Javascript and SVG odometer effect library with motion blur
SVG library for transitioning numbers with motion blur JavaScript odometer or slot machine effect library for smoothly transitioning numbers with moti
The motion graphics toolbelt for the web
mo · js – The motion graphics toolbelt for the web. Intro mo · js is a javascript motion graphics library that is a fast, retina ready, modular and op
JavaScript animation engine

anime.js JavaScript animation engine | animejs.com Anime.js (/ˈæn.ə.meɪ/) is a lightweight JavaScript animation library with a simple, yet powerful AP