103 Repositories
JavaScript COVID-19-Graph Libraries
Beautiful Visualizations For Your App's Dependencies 🧭
Beautiful Visualizations For Your App's Dependencies 🪱 Outputs SVGs Powered by D3 Overlays security vulnerabilities Works with npm & yarn Made by the
Minimize the amount of walls necessary by graph theory!

minCutWall Minimize the amount of walls necessary by graph theory! I've tried my best to make the code as easy as possible to understand. Feel free to
A web app built with Covid-19-API that displays Covid 19 cases, deaths and recovery per country in the entire World

Covid19 Tracker A web app built with Covid-19-API that displays Covid 19 cases, deaths and recovery per country in the entire World Built With HTML, C
Easy-to-use js library for building graphs using svg.
LineChart Easy-to-use js library for building graphs using svg. Examples How to use Just add linechart.js from 'src' directory to your project. And ad
👓 A 3D graph for Obsidian!
Obsidian 3D Graph A 3D Graph for Obsidian! Showcase: 3d-graph-full.mp4 ⬇️ Installation This plugin is not in the official community plugin list yet, s
COVID-19 Graph
COVID-19 Tracker Live Site Stay up to date with new projects New major projects coming soon, subscribe to the mailing list to stay up to date https://
GPU supercharged attraction-graph visualizations built on top of Three.js
Force Directed Graph GPU supercharged attraction-graph visualizations for the web built on top of Three.js. Importable as an ES6 module. Simulation co
Open, extensible, small and simple behaviour-graph execution engine
Behave-Graph Behave-Graph is a standalone library that implements the concept of "behavior graphs" as a portable TypeScript library with no external r
Full stack app to journal and keep track of your overall mood each day of the year, inspired by GitHub's contribution graph.
Mood Tracker Mood tracker to journal and keep track of your overall mood each day of the year. How It's Made: Tech used: EJS, CSS, JavaScript, Node.js
Automatically construct, traverse and visualize graphs generated from your Node.js project

skott is a minimalist developer tool that can be used to efficiently generate directed graphs from your JavaScript/Node.js project. It can automatical
A GitHub action to generate a stackaid.json file based on your repository's dependency graph
generate-stackaid-json A GitHub action to generate a stackaid.json file based on your repository's dependency graph This action is primarily intended
CancerDB: A public domain knowledge graph about cancer treatments that compiles to a CSV file.
CancerDB: A public domain csv file to help build the next great cure CancerDB is a public domain database and website containing facts about all types
An open-source knowledge management app.

Cuby Text What Cuby Text is: An experimental knowledge management app An app focused on writing An open source app A personal project Cuby Text is NOT
Successor of the flowchart-fun syntax. Store tabular data and graph information in the same document.
graph-selector-syntax A syntax for storing graphs and tabular data in plain text View Examples Installation npm install graph-selector Usage import {
The self-building, hot-reloading subgraph. The quickest way to start indexing your shit.
npx autographed The self-building, hot-reloading subgraph. The quickest way to start indexing your shit. 🚀 getting started Okay, so there's a lot tha
A robust, minimal-server-interaction API for peer routing in the browser

Robust, minimal-server-interaction peer routing in the browser What is this? Membrane takes signalling to the browser, creating living peer networks.
Build Schema.org graphs for JavaScript Runtimes (Browser, Node, etc). Improve your sites SEO with quick and easy Rich Results.
schema-org-graph-js The quickest and easiest way to build Schema.org graphs for JavaScript Runtimes (Browser, Node, etc). Status: 🔨 In Development Pl
A JavaScript library for visualizing Sankey diagrams.
SanKEY.js v1.0.0 last updated: 20.07.2022 Getting started SanKEY.js is a JavaScript data visualization library that provides a simple object-oriented
A GitHub action to submit your dependency graph from your Mill build to GitHub.
Mill Dependency Submission A GitHub action to submit your dependency graph from your Mill build to GitHub via their Dependency Submission API. The mai
A lightweight SolidJS component for building interactive node-based diagrams and graphs.
Convert Your Ideas To Graphs With Solid Graph! Solid Graph A lightweight and minimal Solid component for building interactive graphs and node-based ed
The friendly way to accept tips in ETH.
💸 cryptip.me The friendly way to accept tips in ETH. It's free, and no setup required. cryptip.me/your-ens-or-wallet-address Getting Started Project
Covid-19 Tracker is a mobile web application showcasing the covid-19 statistics in Africa.

Covid-19 Tracker is a mobile web application showcasing the covid-19 statistics in Africa. when the user clicks on the countries' cards, they will be rendered to the details page that contains more information about the covid-19 in the selected country. Also, the user can search for a specific country using the search bar.
Simple yet flexible JavaScript charting for designers & developers
Simple yet flexible JavaScript charting for designers & developers Documentation All the links point to the new version 3 of the lib. Introduction Get
Write something on your contribution graph!
GitWrite Write something on your contribution graph! What is GitWrite? GitWrite is a little tool I developed that lets you add a short message to a ye
ClickCat is a firendly user interface that lets you search,explore and visualize your ClickHouse Data.

ClickCat is a firendly user interface that lets you search,explore and visualize your ClickHouse Data. We provides the following features,you can acce
Perform queries on the current graph and batch process on the results.

logseq-plugin-batch-op 对当前库进行查询并对查询结果进行批量操作。 Perform queries on the current graph and batch process on the results. 使用展示 (Usage) 批量删除 (Batch Delete) 批
API dot Open Sauced is NestJS and SupaBase powered OAS3 backend designed to remove client complexity and provide a structured graph of all @open-sauced integrations
🍕 Open Sauced Nest Supabase API 🍕 The path to your next Open Source contribution 📖 Prerequisites In order to run the project we need the following
Drag-and-drop editor for Docassemble interviews

GraphDoc Introduction GraphDoc is a web-application that has been developed on behalf of the Maastricht Law & Tech Lab, which is part of Maastricht Un
A personal school project to model the behaviour of the human immune system as a network graph with interactive visualisation.

An educational tool designed to help users understand the immune system. Made using Processing 5 for Java Script
Generate static open graph images for Next.js at build time
next-static-og-images Generate static Open Graph images for Next.js at build time Getting started Installation npm i -D next-static-og-images or yarn
The Covid-19 data-app collects information from API and present data for the novel coronavirus.
COVID-19-data-app This project was bootstrapped with Create React App. The Covid-19 data-app collects information from API and present data for the no
This is a Covid Cases Tracker Web app , with Malawi cases as priority .......coontact stevenkamwaza@gmail.. for more info
Getting Started with Create React App This project was bootstrapped with Create React App. for demo visit https://mwcovid-tracker.vercel.app/ Availabl
Toolkit for building scalable web applications with TypeScript, React, Redux and Apollo-Client
TsToolbox Toolkit for building scalable web applications with TypeScript, React, Redux and Apollo-Client (inspired by ReKit) ⚠ ⚠ ⚠ Work in Progress ⚠
A obsidian.md plugin for rendering maths graphs.

obsidian-functionplot A plugin for displaying mathematical graphs in obsidian.md. Remember to star this plugin on Github if you like it. How to use Ty
Statistiche pre-calcolate e riusabili sui dati della campagna vaccinale anti Covid in Italia.
ita-vax-analytics Statistiche pre-calcolate e riusabili sui dati della campagna vaccinale anti Covid in Italia. Per cosa può essere utile questo repos
neo4j graph visualization using d3.js

neo4jd3.js 基于d3.js的封装的图数据库的可视化界面,不依赖任何外部框架如: vue, react等;内部实现了节点的展示 Code structure ├── core # core 核心功能 │ └── neo4jToolsIcon
Lenster is a decentralized, and permissionless social media app built with Lens Protocol 🌿
Lenster Decentralized, and permissionless social media app 🌿 lenster.xyz » Discord • Issues 🌿 About Lenster Lenster is a decentralized, and permissi
Visualize COVID-19 risky addresses in Shanghai.
Visualize COVID-19 risky addresses in Shanghai.
JSON Visio is data visualization tool for your json data which seamlessly illustrates your data on graphs without having to restructure anything, paste directly or import file.
JSON Visio is data visualization tool for your json data which seamlessly illustrates your data on graphs without having to restructure anything, paste directly or import file.
Desktop App for mdSilo: Tiny Knowledge silo on your desktop.
mdSilo A mind silo for storing ideas, thought, knowledge with a powerful writing tool. built with React and Tauri. Demo Discord This is desktop app, a
An implementation of Interaction Nets in JavaScript.
Interaction Nets An implementation of Interaction Nets in JavaScript. Use S-expression as overall syntax. Use Forth-like postfix stack-based syntax to
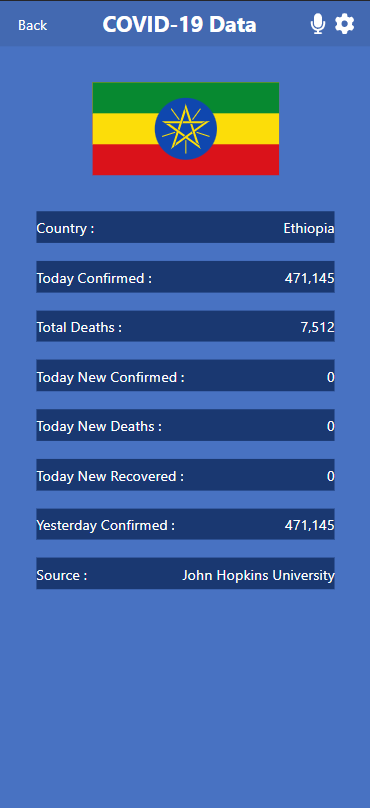
This is Covid-19 data that shows for each country.You can search your country and know its statistics .
COVID-19 Data TRACKER This is Covid-19 data that shows for each country.You can search your country and know its statistics . Built With HTML, CSS, SC
Subgraph to query Doodles NFT tokens along with the traits and owners.
Doodles Subgraph API Subgraph to query Doodles NFT tokens along with the traits and owners. How to use the API Try it out here Example query: { toke
CyberGraph is a 3D-graph based, user based social connection explorer

CyberGraph is a 3D-graph based, user based social connection explorer. It has some cool features like 3d node graph, dynamic loading bar, immersive user experience, cyber mode(10-hops friendship network display) and focus mode(aggregated connection display).
Web application that tracks the covid-19 statistics in Chile and its regions.

Covid 19 Monitor Web page that shows the covid statistics of the country of Chile, all the confirmed cases, the deaths and also the daily statistics.
Highly customizable, animated, responsive, and dependency-free Evolution Graph implementation
Highly customizable, animated, responsive, and dependency-free Evolution Graph implementation. The package is built with Vanilla JavaScript and is used to create flexible data visualizations and present evolution relationships between entities.
Build a blog site using Nextjs, Tailwind css, GraphQL, Graph CMS

NextJs-GraphQL-blog-site 1. Key Features 2. Technologies I've used Key Features: 🟢 In Graph-CMS side we can create post, categories, check the commen
Covidapp - Stop COVID-19 Hrvatska

Stop COVID-19 Hrvatska Description Kako bi usporili širenje bolesti COVID-19 međ
World Covid Tracker With Javascript

World Covid Tracker Track the covid stats in every continent and each of their respective countries. Built with : React Redux-toolkit Tailwind Jest Gi
Visualize the Directed Acyclic Graph that Git creates to connect Commit, Tree and Blob objects internally.

Git Graph Visualize the Directed Acyclic Graph that Git creates to connect Commit, Tree and Blob objects. Hosted at HarshKapadia2.github.io/git-graph.
Check EU Digitial Covid Certificates with ease and validate them against country and local rules.

Check EU Digitial Covid Certificates with ease and validate them against local or country rules. What is the purpose of CovidValidator? CovidValidator
Real-time covid data in Brazil states.

Brazil Covid Data Brazil Covid Data is a web application that allows you to see information about the pandemics on your state just by hovering it on t
This is a TypeScript/JavaScript library which verifies the QR codes of certificates issued by the South African COVID-19 Vaccine Certificate System.
This is a TypeScript/JavaScript library which verifies the QR codes of certificates issued by the South African COVID-19 Vaccine Certificate System.
USA Covid-19 Tracker is a mobile-first application built with React and Redux to give precise information about the virus behavior in the United States. Great transitions and user feedback made with plain CSS.

React.js USA Covid-19 Tracker This application allows the public to keep track of the stadistics of the Covid-19 Pandemic in the United Stated. You wi
Typescript based monte-carlo acyclic graph search algorithm for multiplayer games
Typescript based monte-carlo acyclic graph search algorithm for multiplayer games. It can be used in any turn-based strategic multiplayer games.
Tushar Nankani's blog - Undirected Graph

The overload of ideas has pushed me to connect the dots, analogous to my directionless, although somehow connected thoughts forming a data structure.
Chart.js Graph-like Charts (tree, force directed)

Chart.js Graphs Chart.js module for charting graphs. Adding new chart types: graph, forceDirectedGraph, dendogram, and tree. Works great with https://
Chart.js plugin for Prometheus data loading

Welcome to chartjs-plugin-datasource-prometheus 👋 A Prometheus datasource for ChartJS. Dependencies: requires chart.js 2.7 or later. requires moment.
This app helps you keep track of your expenses in months and years. Also, it shows a graph representing those expenses.
Expenses Tracker This app helps you keep track of your expenses in months and years. Also, it shows a graph representing those expenses. Built With Ma
Using Ethereum Smart Contracts to verify any user's vaccination via Identification Number or QR Code.
Covid-Vaccine-Verification-Blockchain Using Ethereum Smart Contracts to verify any user's vaccination via Identification Number or QR Code. Requiremen
Diagram-maker - A library to display an interactive editor for any graph-like data.

Diagram Maker Diagram Maker is a library to display an interactive editor for any graph-like data. Following is a screenshot from one of the consumers
Drawflow - Simple flow library 🖥️🖱️

Drawflow Simple flow library. Drawflow allows you to create data flows easily and quickly. Installing only a javascript library and with four lines of
Worldwide-covid-statistics - covid-19 tracker developed using Reactjs, Axios , chartjs, material icons
Getting Started with Create React App This project was bootstrapped with Create React App. Available Scripts In the project directory, you can run: np
Built a covid-19 trcaker app using React.js implementing hooks and materail UI
Getting Started with Create React App This project was bootstrapped with Create React App. Available Scripts In the project directory, you can run: np
don't use ml if graph is there
This is a Next.js project bootstrapped with create-next-app. Getting Started First, run the development server: npm run dev # or yarn dev Open http://
Web app for adding EU Digital COVID Certificates to your wallet apps
Web app for adding EU Digital COVID Certificates to your wallet apps
Free Bootstrap 5 Admin and Dashboard Template that comes with all essential dashboard components, elements, charts, graph and application pages. Download now for free and use with personal or commercial projects.
PlainAdmin - Free Bootstrap 5 Dashboard Template PlainAdmin is a free and open-source Bootstrap 5 admin and dashboard template that comes with - all e
An application to help in the automatic booking of COVID vaccination slots in India whenever they become available.

Co-WIN automated slot booking Automatically book vaccine slots as and when they become available This application aims to automatically book vaccine s
Extract the JSON payload from SHC QR codes (i.e Québec Covid Vaccination QR Codes)

shc-extractor Extract the JSON payload from SHC QR Codes (i.e Québec COVID Vaccination QR Codes) Introduction Dans les prochains jours/semaines, les q
Website yang memberikan informasi terkait ketersediaan rumah sakit dan tempat tidur rumah sakit untuk pasien covid-19 ataupun non-covid di Indonesia.

Bed Covid RS Indonesia Website yang memberikan informasi terkait ketersediaan rumah sakit dan tempat tidur rumah sakit untuk pasien covid-19 ataupun n
A simple PWA to scan your EU digital COVID Certificate and generate a passbook from it
COVID-19 passbook Generator The aim of this project is to let a user scan a EU Digital COVID Certificate with their smartphone, and generate a passboo
A complete COVID-19 tracker cum dashboard website made by me.
Covidview A detailed dashboard of live COVID-19 cases. Techs Used: React JS React Hooks and DOM Firebase WHO disease API Demo Video : covid.mp4 Workin
A web app that shows visualizations of the most used graphs algorithms such as BFS, DFS, Dijsktra, Minimum spanning tree, etc. It allows you to draw your own graph.
Graph Visualizer Draw your own graphs and visualize the most common graph algorithms This web application allows you to draw a graph from zero, with p
An example repository on how to start building graph applications on streaming data. Just clone and start building 💻 💪
Example Streaming App 🚀 🚀 This repository serves as a point of reference when developing a streaming application with Memgraph and a message broker
Fill the boring catsalud covid vaccine form with a console command
vacunacovid-catsalud-autofullfill form Fill the boring catsalud covid vaccine form with a console command Manual use, pasting in the script in the con
An attempt to decode the Digital Covid Certificate (signed by the french app TousAntiCovid) - For Educational Purposes Only
Digital Covid Certificate Decoder An attempt to decode the Digital Covid Certificate (signed by the french app TousAntiCovid) How to use If you want t
Presentation and materials for The Graph developers taking their first space-walk 🧑🚀
Welcome to thegraph-hacker-kit 👋 Presentation and materials for The Graph developers taking their first space-walk 🧑🚀 Are you ready to learn how t
Get updates in Telegram when a vaccination center available in your pin code. We can win Covid 🤝
Cowin Bot Get updates in Telegram when an vaccination center available in your pin code. We can win Covid 🤝 Commands: /start - Start the Bot /help -
A knowledge management garden for https://obsidian.md, in which to grow your ideas

🪨 🌱 The Obsidian Garden Welcome to your Knowledge Garden The Obsidian Garden is both guide in helping you create your own knowledge system, and a kn
GitHub action to get notification whenever vaccine slot is availble in cowin portal :tada:

Covid Vaccine availability notifier Setup Fork this repo Update the config at src/config.js Delete the db file src/db.json module.exports = { // opt
An iOS widget that displays the COVID-19 vaccination progress in Germany

Impfdashboard Widget This repo gets the current data of COVID-19 vaccinations in Germany from impfdashboard.de and allows you to display it as an iOS
Simple tiny dependency graph engine, MobX inspired
🜉 Quarx Simple tiny dependency graph engine, MobX inspired Introduction In less than 200 lines of code and zero dependencies Quarx supports most of M
A Twitter bot that automatically replies to tweets requesting COVID related resources with links containing information about the availability.
COVID-19 Bot A Twitter bot that automatically replies to tweets requesting COVID related resources with links containing information about the availab
⚡️ Look for Covid-19 Resources, Get Vaccine Availability Notification, Complete source code for covidrescue.co.in website.
covidrescue.co.in ⚡️ Get real-time, verified leads on Oxygen, Remdesivir, ICU, Beds, Food and more based on your location. Get notifications on Vaccin
A volunteer-driven effort to track COVID Hospital Beds availability in India.
COVIDBedsIndia A volunteer-driven effort to track COVID hospital beds availability in India. 🔗 https://covidbedsindia.in Aggregated data is available
Get api covid-19 Việt Nam ncov.moh.gov.vn
ApiCovidVietNam Test : click here Tính Năng Get api covid-19 Việt Nam ncov.moh.gov.vn Hướng dẫn cài đặt ApiCovidVietNam yêu cầu Node.js v14+ để chạy.
Graph theory (network) library for visualisation and analysis
Cytoscape.js Graph theory (network) library for visualisation and analysis : https://js.cytoscape.org Description Cytoscape.js is a fully featured gra
A Tracker to Check the availability of vaccine through pincode and buzzer in case of availability
Welcome to covid-vaccine-tracker 👋 A Tracker to Check the availability of vaccine through pincode and buzzer in case of availability 🏠 Homepage Prer
📈 A small, fast chart for time series, lines, areas, ohlc & bars

📈 μPlot A small (~35 KB min), fast chart for time series, lines, areas, ohlc & bars (MIT Licensed) Introduction μPlot is a fast, memory-efficient Can
3D graph viewer powered by WebGL (three.js)
Graphosaurus A three-dimensional static graph viewer. (click the image to try it out) Demos EVE Online map Add nodes incrementally Documentation JSDoc
Gephi - The Open Graph Viz Platform
Gephi - The Open Graph Viz Platform Gephi is an award-winning open-source platform for visualizing and manipulating large graphs. It runs on Windows,
An open source cybersecurity protocol for syncing decentralized graph data.
GUN is an ecosystem of tools that let you build community run and encrypted applications. Currently, Internet Archive and HackerNoon run GUN in produc
🥞Data Structures and Algorithms explained and implemented in JavaScript + eBook

Data Structures and Algorithms in JavaScript This is the coding implementations of the DSA.js book and the repo for the NPM package. In this repositor
A React toolkit for graph visualization based on G6
Graphin A React toolkit for graph analysis based on G6 English | 简体中文 ✨ Features 🎨 Good-looking elements, standardized style configuration Graphin st
:bar_chart: Re-usable, easy interface JavaScript chart library based on D3.js
billboard.js is a re-usable, easy interface JavaScript chart library, based on D3 v4+. The name "billboard" comes from the famous billboard chart whic
a graph visualization library using web workers and jQuery
arbor.js -------- Arbor is a graph visualization library built with web workers and jQuery. Rather than trying to be an all-encompassing framework, a
JavaScript toolkit for creating interactive real-time graphs
Rickshaw Rickshaw is a JavaScript toolkit for creating interactive time series graphs, developed at Shutterstock Table of Contents Getting Started Ins
JavaScript diagramming library for interactive flowcharts, org charts, design tools, planning tools, visual languages.
GoJS, a JavaScript Library for HTML Diagrams GoJS is a JavaScript and TypeScript library for creating and manipulating diagrams, charts, and graphs. S
:bar_chart: A D3-based reusable chart library
c3 c3 is a D3-based reusable chart library that enables deeper integration of charts into web applications. Follow the link for more information: http
A JavaScript library dedicated to graph drawing
sigma.js - v1.2.1 Sigma is a JavaScript library dedicated to graph drawing, mainly developed by @jacomyal and @Yomguithereal. Resources The website pr