163 Repositories
JavaScript graph-visualization Libraries
SandDance - Visually explore, understand, and present your data.
Visually explore, understand, and present your data.
📈 A small, fast chart for time series, lines, areas, ohlc & bars

📈 μPlot A small (~35 KB min), fast chart for time series, lines, areas, ohlc & bars (MIT Licensed) Introduction μPlot is a fast, memory-efficient Can
3D graph viewer powered by WebGL (three.js)
Graphosaurus A three-dimensional static graph viewer. (click the image to try it out) Demos EVE Online map Add nodes incrementally Documentation JSDoc
Create beautiful JavaScript charts with one line of Ruby
Chartkick Create beautiful JavaScript charts with one line of Ruby. No more fighting with charting libraries! See it in action Chartkick 4.0 was recen
📊 Interactive JavaScript Charts built on SVG
A modern JavaScript charting library to build interactive charts and visualizations with simple API. Our Partner ApexCharts is now a partner of Fusion
DataSphereStudio is a one stop data application development& management portal, covering scenarios including data exchange, desensitization/cleansing, analysis/mining, quality measurement, visualization, and task scheduling.
English | 中文 Introduction DataSphere Studio (DSS for short) is WeDataSphere, a big data platform of WeBank, a self-developed one-stop data application
Apache Superset is a Data Visualization and Data Exploration Platform
Superset A modern, enterprise-ready business intelligence web application. Why Superset? | Supported Databases | Installation and Configuration | Rele
Make Your Company Data Driven. Connect to any data source, easily visualize, dashboard and share your data.
Redash is designed to enable anyone, regardless of the level of technical sophistication, to harness the power of data big and small. SQL users levera
Open-source JavaScript charting library behind Plotly and Dash
Plotly.js is a standalone Javascript data visualization library, and it also powers the Python and R modules named plotly in those respective ecosyste
Gephi - The Open Graph Viz Platform
Gephi - The Open Graph Viz Platform Gephi is an award-winning open-source platform for visualizing and manipulating large graphs. It runs on Windows,
Apache ECharts is a powerful, interactive charting and data visualization library for browser
Apache ECharts Apache ECharts is a free, powerful charting and visualization library offering an easy way of adding intuitive, interactive, and highly
Analytical Web Apps for Python, R, Julia, and Jupyter. No JavaScript Required.

Dash Dash is the most downloaded, trusted Python framework for building ML & data science web apps. Built on top of Plotly.js, React and Flask, Dash t
Location Intelligence & Data Visualization tool
What is CARTO? CARTO is an open, powerful, and intuitive platform for discovering and predicting the key insights underlying the location data in our
Visualization of all roads within any city
city-roads Render every single road in any city at once: https://anvaka.github.io/city-roads/ How it is made? The data is fetched from OpenStreetMap u
geotiff.js is a small library to parse TIFF files for visualization or analysis. It is written in pure JavaScript, and is usable in both the browser and node.js applications.
geotiff.js Read (geospatial) metadata and raw array data from a wide variety of different (Geo)TIFF files types. Features Currently available function
React friendly API wrapper around MapboxGL JS
react-map-gl | Docs react-map-gl is a suite of React components designed to provide a React API for Mapbox GL JS-compatible libraries. More informatio
WebGL2 powered geospatial visualization layers
deck.gl | Website WebGL2-powered, highly performant large-scale data visualization deck.gl is designed to simplify high-performance, WebGL-based visua
A visualization grammar. Moved to: https://github.com/vega/vega
Vega: A Visualization Grammar Vega is a visualization grammar, a declarative format for creating and saving interactive visualization designs. With Ve
JavaScript library for HTML5 & CSS3 time sheets
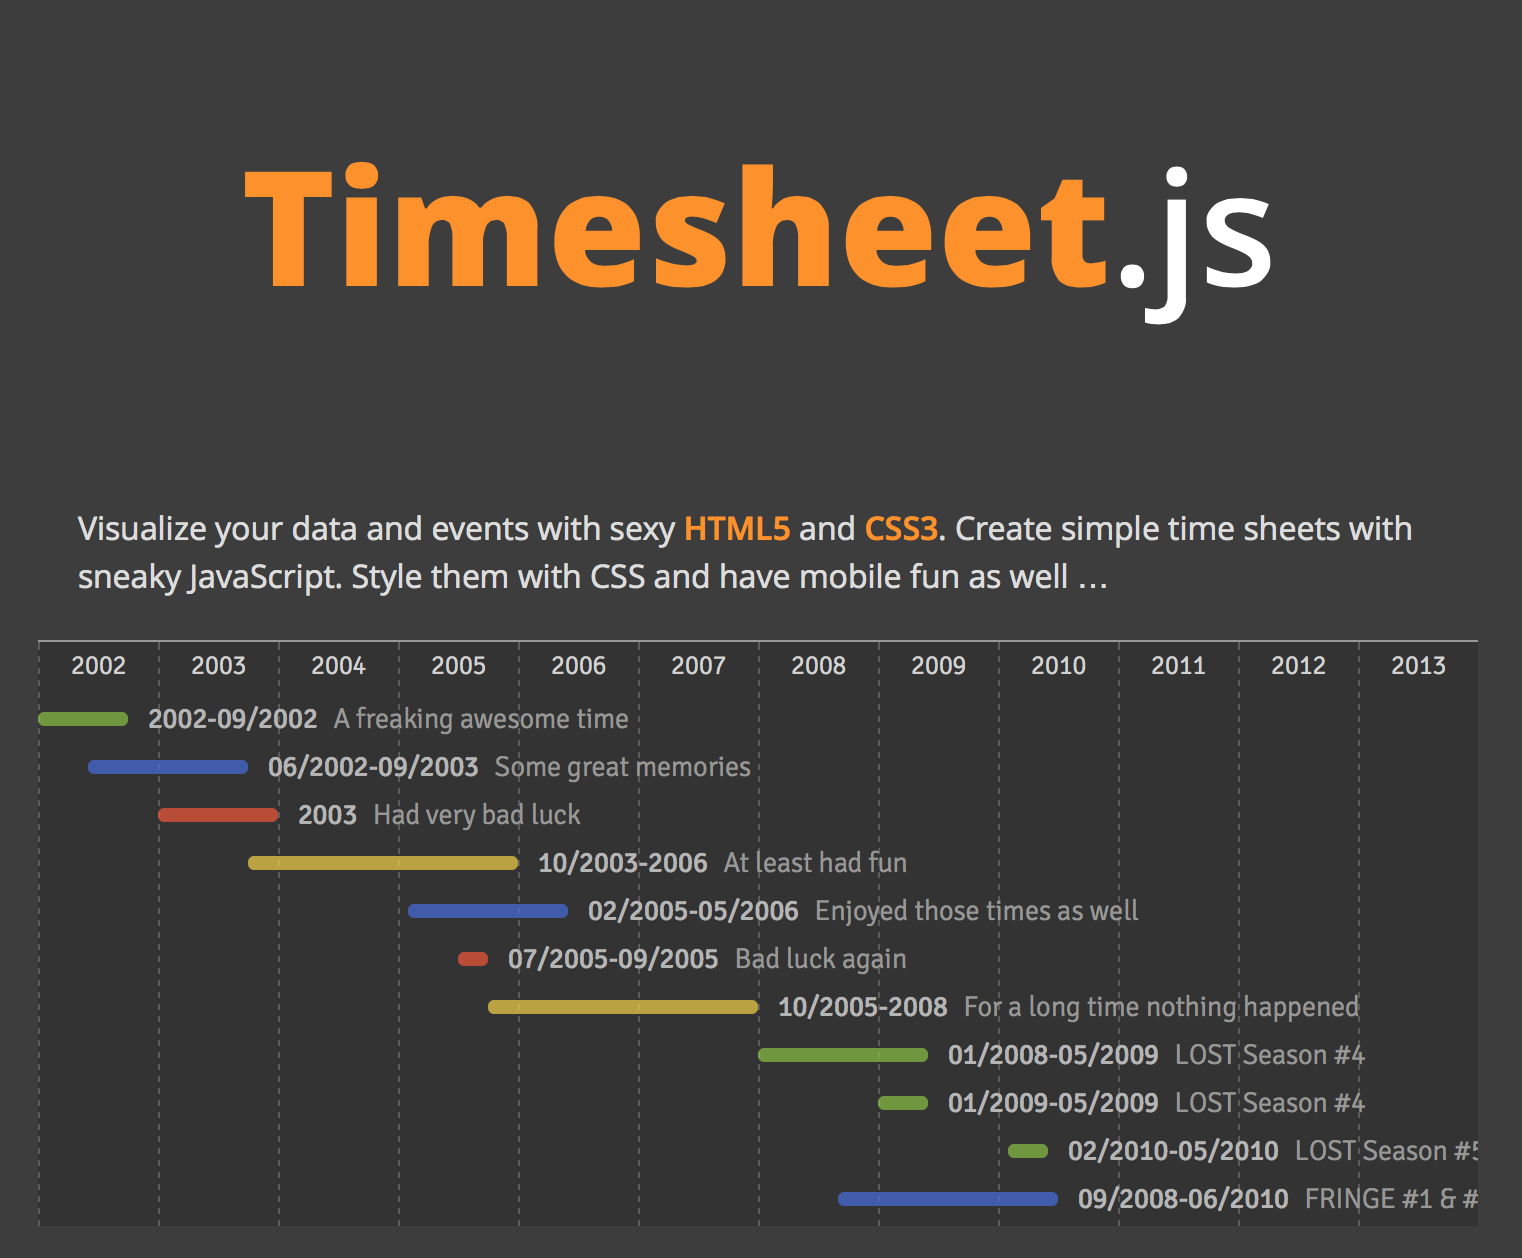
Timesheet.js Simple JavaScript library to create HTML time sheets. Wrapped in an example project using Middleman … You only have to include dist/times
An open source cybersecurity protocol for syncing decentralized graph data.
GUN is an ecosystem of tools that let you build community run and encrypted applications. Currently, Internet Archive and HackerNoon run GUN in produc
React + Canvas = Love. JavaScript library for drawing complex canvas graphics using React.
React Konva React Konva is a JavaScript library for drawing complex canvas graphics using React. It provides declarative and reactive bindings to the
A library for visualization and creative-coding

Pts Pts is a typescript/javascript library for visualization and creative-coding. Get started at ptsjs.org. Please give it a try, file issues, and sen
📱📈An elegant, interactive and flexible charting library for mobile.

中文 README F2 is born for mobile, developed for developers as well as designers. It is Html5 Canvas-based, and is also compatible with Node.js, Weex an
React friendly API wrapper around MapboxGL JS
react-map-gl | Docs react-map-gl is a suite of React components designed to provide a React API for Mapbox GL JS-compatible libraries. More informatio
Data Visualization Components

react-vis | Demos | Docs A COMPOSABLE VISUALIZATION SYSTEM Overview A collection of react components to render common data visualization charts, such
A collection of composable React components for building interactive data visualizations

an ecosystem of composable React components for building interactive data visualizations. Victory Contents Getting Started Victory Native API Document
🐯 visx | visualization components

visx visx is a collection of reusable low-level visualization components. visx combines the power of d3 to generate your visualization with the benefi
🥞Data Structures and Algorithms explained and implemented in JavaScript + eBook

Data Structures and Algorithms in JavaScript This is the coding implementations of the DSA.js book and the repo for the NPM package. In this repositor
An interactive git visualization and tutorial. Aspiring students of git can use this app to educate and challenge themselves towards mastery of git!

LearnGitBranching LearnGitBranching is a git repository visualizer, sandbox, and a series of educational tutorials and challenges. Its primary purpose
:fireworks:Interactive Online Platform that Visualizes Algorithms from Code
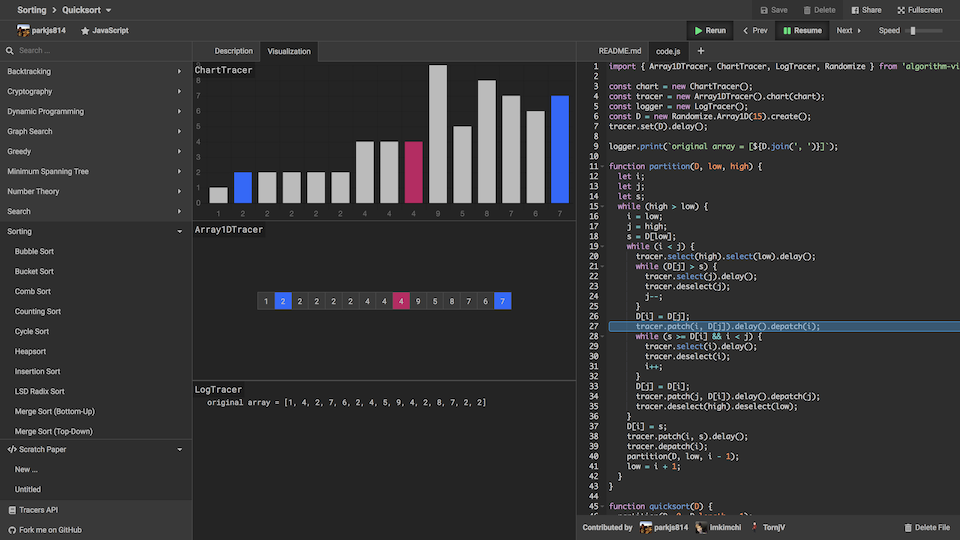
Algorithm Visualizer Algorithm Visualizer is an interactive online platform that visualizes algorithms from code. Learning an algorithm gets much easi
📊 Data visualization library for React based on D3
Data visualization library for React based on D3js REAVIZ is a modular chart component library that leverages React natively for rendering the compone
A React toolkit for graph visualization based on G6
Graphin A React toolkit for graph analysis based on G6 English | 简体中文 ✨ Features 🎨 Good-looking elements, standardized style configuration Graphin st
Composable data visualisation library for web with a data-first approach now powered by WebAssembly
What is Muze? Muze is a free data visualization library for creating exploratory data visualizations (like Tableau) in browser, using WebAssembly. It
🌏 A Declarative 3D Globe Data Visualization Library built with Three.js
Gio.js English | 中文 React Version: react-giojs Wechat minigame: wechat usage Gio.js is an open source library for web 3D globe data visualization buil
A data visualization framework combining React & D3
Semiotic is a data visualization framework combining React & D3 Interactive Documentation API Docs on the wiki Examples Installation npm i semiotic E
Interactive visualizations of time series using JavaScript and the HTML canvas tag

dygraphs JavaScript charting library The dygraphs JavaScript library produces interactive, zoomable charts of time series: Learn more about it at dygr
:bar_chart: Re-usable, easy interface JavaScript chart library based on D3.js
billboard.js is a re-usable, easy interface JavaScript chart library, based on D3 v4+. The name "billboard" comes from the famous billboard chart whic
🍞📊 Beautiful chart for data visualization.

🍞 📈 Spread your data on TOAST UI Chart. TOAST UI Chart is Beautiful Statistical Data Visualization library. 📦 Packages The functionality of TOAST U
Powerful data visualization library based on G2 and React.

BizCharts New charting and visualization library has been released: http://bizcharts.net/products/bizCharts. More details about BizCharts Features Rea
Reusable JavaScript library for creating sketchy/hand-drawn styled charts in the browser.

roughViz.js is a reusable JavaScript library for creating sketchy/hand-drawn styled charts in the browser, based on D3v5, roughjs, and handy. Why? Use
a super simple, no-nonsense diagramming library written in react that just works
Introduction DEMO: http://projectstorm.cloud/react-diagrams DOCS (wip) https://projectstorm.gitbook.io/react-diagrams Docs are currently being worked
Data visualization library for depicting quantities as animated liquid blobs
liquidity.js A data visualization library for depicting quantities as animated liquid blobs. For a demonstration of what the final product can look li
vizflow is an ES6 interactive visualization engine

Vizflow vizflow.js - a render-loop library written using EcmaScript.6 (ES6) with no other external dependencies. Vizflow is a relatively small library
Dynamic HTML5 visualization
Envision.js Fast interactive HTML5 charts. http://groups.google.com/group/envisionjs/ Features Modern Browsers, IE 6+ Mobile / Touch Support Pre-built
:dango: An interactive and responsive charting library
English | 简体中文 G2Plot A charting library based on the Grammar of Graphics. G2Plot is an interactive and responsive charting library. Based on the gram
Beautiful React SVG maps with d3-geo and topojson using a declarative api.
react-simple-maps Create beautiful SVG maps in react with d3-geo and topojson using a declarative api. Read the docs, or check out the examples. Why R
a graph visualization library using web workers and jQuery
arbor.js -------- Arbor is a graph visualization library built with web workers and jQuery. Rather than trying to be an all-encompassing framework, a
A port of the Processing visualization language to JavaScript.
⚠️ This project has been archived ⚠️ With the development of p5js and the API advances in Processing itself, as well as Processing.js itself having be
A general purpose, real-time visualization library.
Epoch By Ryan Sandor Richards Epoch is a general purpose charting library for application developers and visualization designers. It focuses on two di
Cubism.js: A JavaScript library for time series visualization.
Cubism.js Cubism.js is a D3 plugin for visualizing time series. Use Cubism to construct better realtime dashboards, pulling data from Graphite, Cube a
🔥 JavaScript Library for HTML5 canvas based heatmaps
heatmap.js Dynamic Heatmaps for the Web. How to get started The fastest way to get started is to install heatmap.js with bower. Just run the following
JavaScript toolkit for creating interactive real-time graphs
Rickshaw Rickshaw is a JavaScript toolkit for creating interactive time series graphs, developed at Shutterstock Table of Contents Getting Started Ins
JavaScript diagramming library for interactive flowcharts, org charts, design tools, planning tools, visual languages.
GoJS, a JavaScript Library for HTML Diagrams GoJS is a JavaScript and TypeScript library for creating and manipulating diagrams, charts, and graphs. S
Multi-Dimensional charting built to work natively with crossfilter rendered with d3.js
dc.js Dimensional charting built to work natively with crossfilter rendered using d3.js. In dc.js, each chart displays an aggregation of some attribut
A visualization grammar.
Vega: A Visualization Grammar Vega is a visualization grammar, a declarative format for creating, saving, and sharing interactive visualization design
:bar_chart: A D3-based reusable chart library
c3 c3 is a D3-based reusable chart library that enables deeper integration of charts into web applications. Follow the link for more information: http
A JavaScript library dedicated to graph drawing
sigma.js - v1.2.1 Sigma is a JavaScript library dedicated to graph drawing, mainly developed by @jacomyal and @Yomguithereal. Resources The website pr
📊 A highly interactive data-driven visualization grammar for statistical charts.

English | 简体中文 G2 A highly interactive data-driven visualization grammar for statistical charts. Website • Tutorial Docs • Blog • G2Plot G2 is a visua
Data Visualization Components
react-vis | Demos | Docs A COMPOSABLE VISUALIZATION SYSTEM Overview A collection of react components to render common data visualization charts, such
Simple, responsive, modern SVG Charts with zero dependencies

Frappe Charts GitHub-inspired modern, intuitive and responsive charts with zero dependencies Explore Demos » Edit at CodePen » Contents Installation U
Simple HTML5 Charts using the canvas tag
Simple yet flexible JavaScript charting for designers & developers Documentation Currently, there are two versions of the library (2.9.4 and 3.x.x). V
Apache ECharts is a powerful, interactive charting and data visualization library for browser
Apache ECharts Apache ECharts is a free, powerful charting and visualization library offering an easy way of adding intuitive, interactive, and highly
Bring data to life with SVG, Canvas and HTML. :bar_chart::chart_with_upwards_trend::tada:
D3: Data-Driven Documents D3 (or D3.js) is a JavaScript library for visualizing data using web standards. D3 helps you bring data to life using SVG, C