97 Repositories
JavaScript ember-charts Libraries
Ember.js addon allowing you to easily implement non-CRUD actions for your Ember Data models
@mainmatter/ember-api-actions This is an Ember.js addon allowing you to easily implement non-CRUD actions for your Ember Data models. Compatibility Em
A server-side-rendered charting library for Fresh
fresh_charts A server side rendered charting library for Fresh based on Chart.js. Usage There are two main ways to render a chart. There is the JSX/TS
🟢 Music player app with a modern homepage, fully-fledged music player, search, lyrics, song exploration features, search, popular music around you, worldwide top charts, and much more.
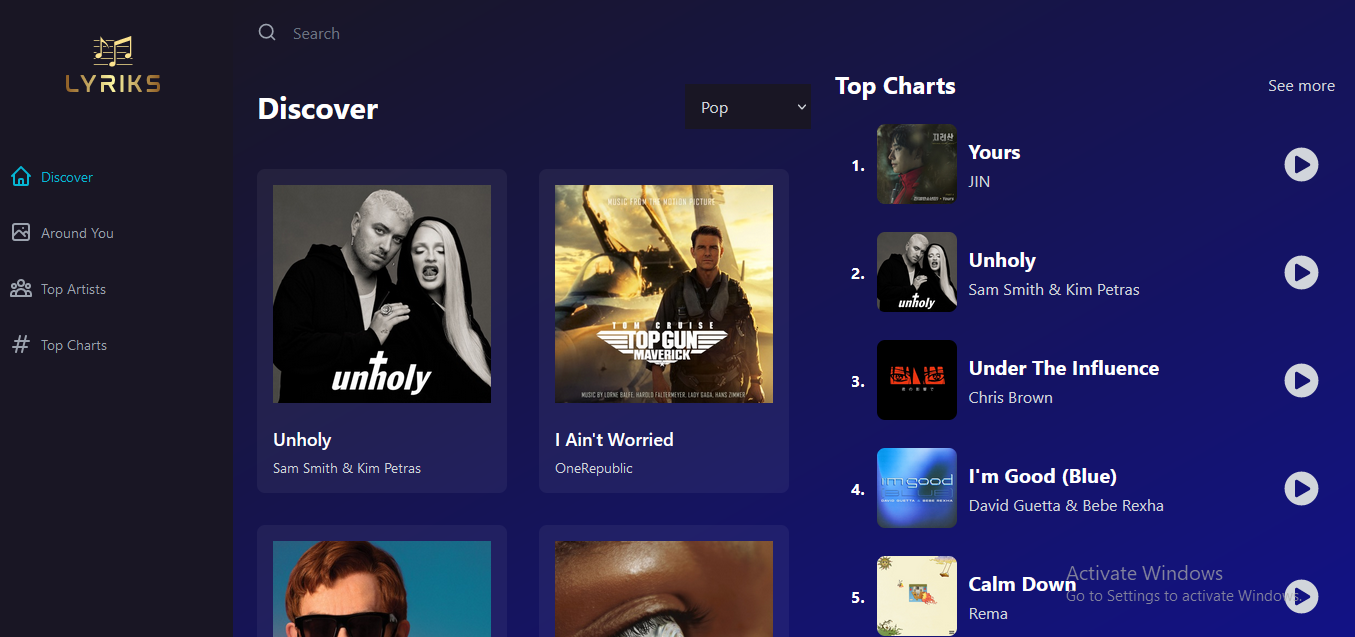
Music-player-app see the project here. 1. Key Features 2. Technologies I've used Key Features: 🟢 Fully responsive clean UI. 🟢 Entirely mobile respo
Statistics plugin for RemNote that will give you some helpful numbers, charts and heatmap for your knowledge base.
RemNote statistics plugin Features This plugin will give you the following statistics: Retention rate Number of cards due in future Type of buttons yo
Using ASP.NET Core, SignalR, and ChartJs to create real-time updating charts

Real-time Charts with ASP.NET Core, SignalR, and Chart.js This project shows how to update a real-time chart in your web browser using technologies li
Open source CSS framework for data visualization.
Charts.css Charts.css is an open source CSS framework for data visualization. Visualization help end-users understand data. Charts.css help frontend d
A Javascript library to export svg charts from the DOM and download them as an SVG file, PDF, or raster image (JPEG, PNG) format. Can be done all in client-side.
svg-exportJS An easy-to-use client-side Javascript library to export SVG graphics from web pages and download them as an SVG file, PDF, or raster imag
A simple script for pure javascript charts.
MK Charts A simple pure Javascript for displaying circle charts. Demo: https://mkirschen.de/mk-scripts/mk-charts/ Circle charts To insert a chart all
Codemod to un-pod Ember apps, addons, and engines
ember-codemod-pod-to-octane Codemod to un-pod Ember apps, addons, and engines Usage Step 1. Quickly return to default Octane. cd your/project/path n
Demo of settingup tailwind 3 (cli) with emberjs
tailwind-setup-demo This README outlines the details of collaborating on this Ember application. A short introduction of this app could easily go here
ln-charts parses the output of bos accounting commands into various charts for your Lightning Node.

ln-charts ln-charts parses the output of bos accounting commands into various charts for your Lightning Node. It runs on Angular, JS, HTML, CSS, ngx-c
📱📈An elegant, interactive and flexible charting library for mobile.

F2,一个专注于移动,开箱即用的可视化解决方案,完美支持 H5 环境同时兼容多种环境(node, 小程序,weex)。完备的图形语法理论,满足你的各种可视化需求。专业的移动设计指引为你带来最佳的移动端图表体验。英文 README 在此衷心感谢《The Grammar of Graphics》的作者
Simple yet flexible JavaScript charting for designers & developers
Simple yet flexible JavaScript charting for designers & developers Documentation All the links point to the new version 3 of the lib. Introduction Get
D3 (or D3.js) is a JavaScript library for visualizing data using web standards
D3 (or D3.js) is a JavaScript library for visualizing data using web standards. D3 helps you bring data to life using SVG, Canvas and HTML. D3 combines powerful visualization and interaction techniques with a data-driven approach to DOM manipulation, giving you the full capabilities of modern browsers and the freedom to design the right visual interface for your data.
An open-source visualization library specialized for authoring charts that facilitate data storytelling with a high-level action-driven grammar.

Narrative Chart Introduction Narrative Chart is an open-source visualization library specialized for authoring charts that facilitate data storytellin
A demo app to illustrate core and latest concepts in Ember.js
ember-workshop A demo app to illustrate core and latest concepts in Ember.js Setup Installation Clone this repo. git clone [email protected]:ijlee2/ember
A WCAG-conformant (2.1 AA) Ember starter app.
accessibility-base Some small changes to make to your new Ember app to make it WCAG conformant: adds lang attribute in app/index.html (you can also do
Vanila JS Sparklines library inspired by peity.js

Peity Vanilla JS Converts an element's content into a svg mini pie donut line or bar chart and is compatible with any browser that supports svg: C
Elections in Russia, Saint Petersburg, 2021: results, turnout, and commission data. With image charts and brief introduction to election fraud methods used.

2021 Elections in Saint Petersburg, Russia 🇷🇺 Переключиться на русский 📈 Jump to charts 🤖 Telegram bot In Russia, Saint Petersburg from 17th to 19
🎧 Get json type billboard hot 100 chart
Billboard json Get json type billboard hot 100 chart, Data update every day !! Url Hot 100 : https://raw.githubusercontent.com/KoreanThinker/billboard
A web application to 🔍inspect your GitHub Profile Stats📊 in a lucid way. Visualization made easy with Charts💡🚀

know-your-gitstats A web application to 🔍 inspect your GitHub Profile Stats 📊 in a lucid way. Visualization made easy with Charts 💡 🚀 . ✅ Features
testing out ember + netlify's forms

survey-netlify I'm trying Ember + Netlify Forms. Will it work? Let's find out. Steps so far added prember and ember-cli-fastboot used the version of f
Bugsnag integration for Ember applications.
Ember Bugsnag Bugsnag integration for Ember applications.
Ember-cli addon for using Bootstrap as native Ember components.
ember-bootstrap An ember-cli addon for using Bootstrap 4 und 5 in Ember applications. The addon includes the Bootstrap CSS (or Sass, Less) in your pro
Rich components for Ember.js framework.
Ember Components Ember Components is a comprehensive set of rich web components written purely in Ember.js that let you create an astonishing UI for a
Bootstrap for Ember.js
Please use our CLI-ADDONS instead We rewrote almost all components from scratch and packed them as Ember-Addons, Please avoid using this project and u
Ember implementation of Google's Material Design
No longer maintained This project is no longer maintained. For an up-to-date material design project, please use Ember Paper. Ember-material-design Th
Material Design Lite for Ember.js Apps
ember-material-lite Google's Material Design Lite for Ember.js apps This addon requires ember = 1.11.0 Installation # ember-cli 0.2.3 ember install
The ember implementation of UIkit
ember-uikit This addon is a wrapper for the CSS library UIkit which exposes certain components to give users an easy way for using UIkit in ember apps
Official Semantic UI Integration for Ember
Semantic-UI-Ember This is the official Ember library for the Semantic-UI modules. Support The NodeJS and EmberJS versions respective tags are tested o
An Ember CLI Addon that provides a variety of UI components.

We use https://waffle.io/softlayer/sl-ember-components to work our issues. What sl-ember-components is An Ember CLI Addon that provides UI components
An Ember-flavoured Bootstrap 4.x eco-system
ui-bootstrap Adds a complete Ember Bootstrap 4.x eco-system THIS IS CURRENTLY A WORK IN PROGRESS ... it works but it will be "ready" pretty soon Insta
Use plain functions as modifiers. Polyfill for RFC: 757 | Default Modifier Manager
Use plain functions as modifiers. Polyfill for RFC: 757 | Default Modifier Manager
📓 The UI component explorer. Develop, document, & test React, Vue, Angular, Web Components, Ember, Svelte & more!

Build bulletproof UI components faster Storybook is a development environment for UI components. It allows you to browse a component library, view the
Synchro Charts is a front-end component library that provides a collection of components to visualize time-series data.
Synchro Charts Synchro Charts is a front-end component library that provides a collection of components to visualize time-series data. You can learn m
Chart.js Box Plots and Violin Plot Charts

Chart.js Box and Violin Plot Chart.js module for charting box and violin plots. This is a maintained fork of @datavisyn/chartjs-chart-box-and-violin-p
Chart.js Graph-like Charts (tree, force directed)

Chart.js Graphs Chart.js module for charting graphs. Adding new chart types: graph, forceDirectedGraph, dendogram, and tree. Works great with https://
Chart.js module for creating matrix charts

chartjs-chart-matrix Chart.js v3.0.0 module for creating matrix charts Example Documentation You can find documentation for chartjs-chart-treemap at h
Chart.js module for creating treemap charts

chartjs-chart-treemap Chart.js v3.6.0 module for creating treemap charts. Implementation for Chart.js v2 is in 2.x branch Documentation You can find d
Chart.js plugin to create charts with a hand-drawn, sketchy, appearance
chartjs-plugin-rough Chart.js plugin to create charts with a hand-drawn, sketchy, appearance Version 0.2 requires Chart.js 2.7.0 or later, and Rough.j
Makes waterfall charts easy with chartjs-2
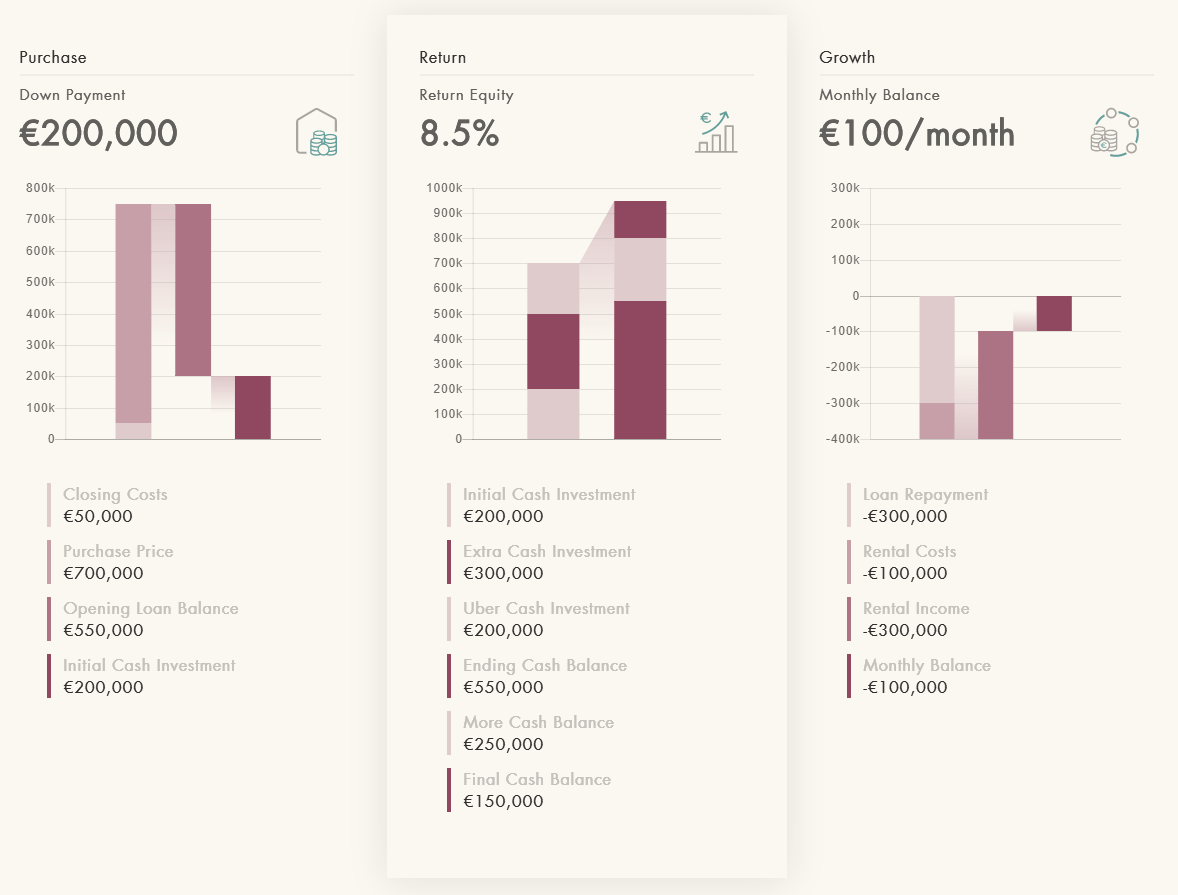
Installation npm install --save chartjs-plugin-waterfall Here's what it looks like: Usage Just import the plugin and add it to any chart that you want
A simple ember component for adding Charts
Ember Chart This Ember CLI addon is a simple wrapper for ChartJS (v2.9). Compatibility Ember.js v3.12 or above Ember CLI v2.13 or above Node.js v10 or
Beautiful charts for Angular based on Chart.js
ng2-charts slack Beautiful charts for Angular based on Chart.js Usage & Demo Samples using ng2-charts https://valor-software.com/ng2-charts/ Installat
React components for Chart.js, the most popular charting library
react-chartjs-2 React components for Chart.js, the most popular charting library. Supports Chart.js v3 and v2. Quickstart • Docs • Slack • Stack Overf
J2CL and GWT Charts library based on CHART.JS

Charba - J2CL and GWT Charts library based on CHART.JS What's Charba GWT Web toolkit doesn't have charting library available out of the box. There are
Django Class Based Views to generate Ajax charts js parameters.
Django Chartjs Django Chartjs lets you manage charts in your Django application. This is compatible with Chart.js and Highcharts JS libraries. Using a
Simple package to facilitate and automate the use of charts in Laravel 5.x using Chartjs v2 library
laravel-chartjs - Chart.js v2 wrapper for Laravel 5.x Simple package to facilitate and automate the use of charts in Laravel 5.x using the Chart.js v2
Beautiful and interactive javascript charts for Java-based web applications.
Wicked Charts Beautiful and interactive JavaScript charts for Java-based web applications. Check out the Changelog Check out the Feature Overview with
Demonstration of how to use statecharts as and with actors in Ember.js
statechart-actors This app demonstrate how we can use ember-statecharts and XState's actor feature together. The demo-use case: Show a blog posts over
Vue-crypto-dashboard - Cryptocurrency Dashboard made with Vue

Vue Crypto Dashboard A Cryptocurrency Dashboard build with Vue JS, PWA enabled, Binance Websocket API for realtime price, amChart for displaying histo
RocketTrades - Discord Stocks and Charts bot. Written for the RocketTrades Discord bot.
Rocket Trades RocketTrades, Discord Charts and Stocks bot. MORE DETAILS AND UPDATES TO COME SOON Getting started • Installation • Configuration • Inte
An accessible dropdown component for use in Ember apps.
ember-a11y-dropdown This is an accessible dropdown that you can use in your Ember app for a menu dropdown. I'm making it so people can stop using the
Free Bootstrap 5 Admin and Dashboard Template that comes with all essential dashboard components, elements, charts, graph and application pages. Download now for free and use with personal or commercial projects.
PlainAdmin - Free Bootstrap 5 Dashboard Template PlainAdmin is a free and open-source Bootstrap 5 admin and dashboard template that comes with - all e
Create PowerPoint presentations with a powerful, concise JavaScript API.
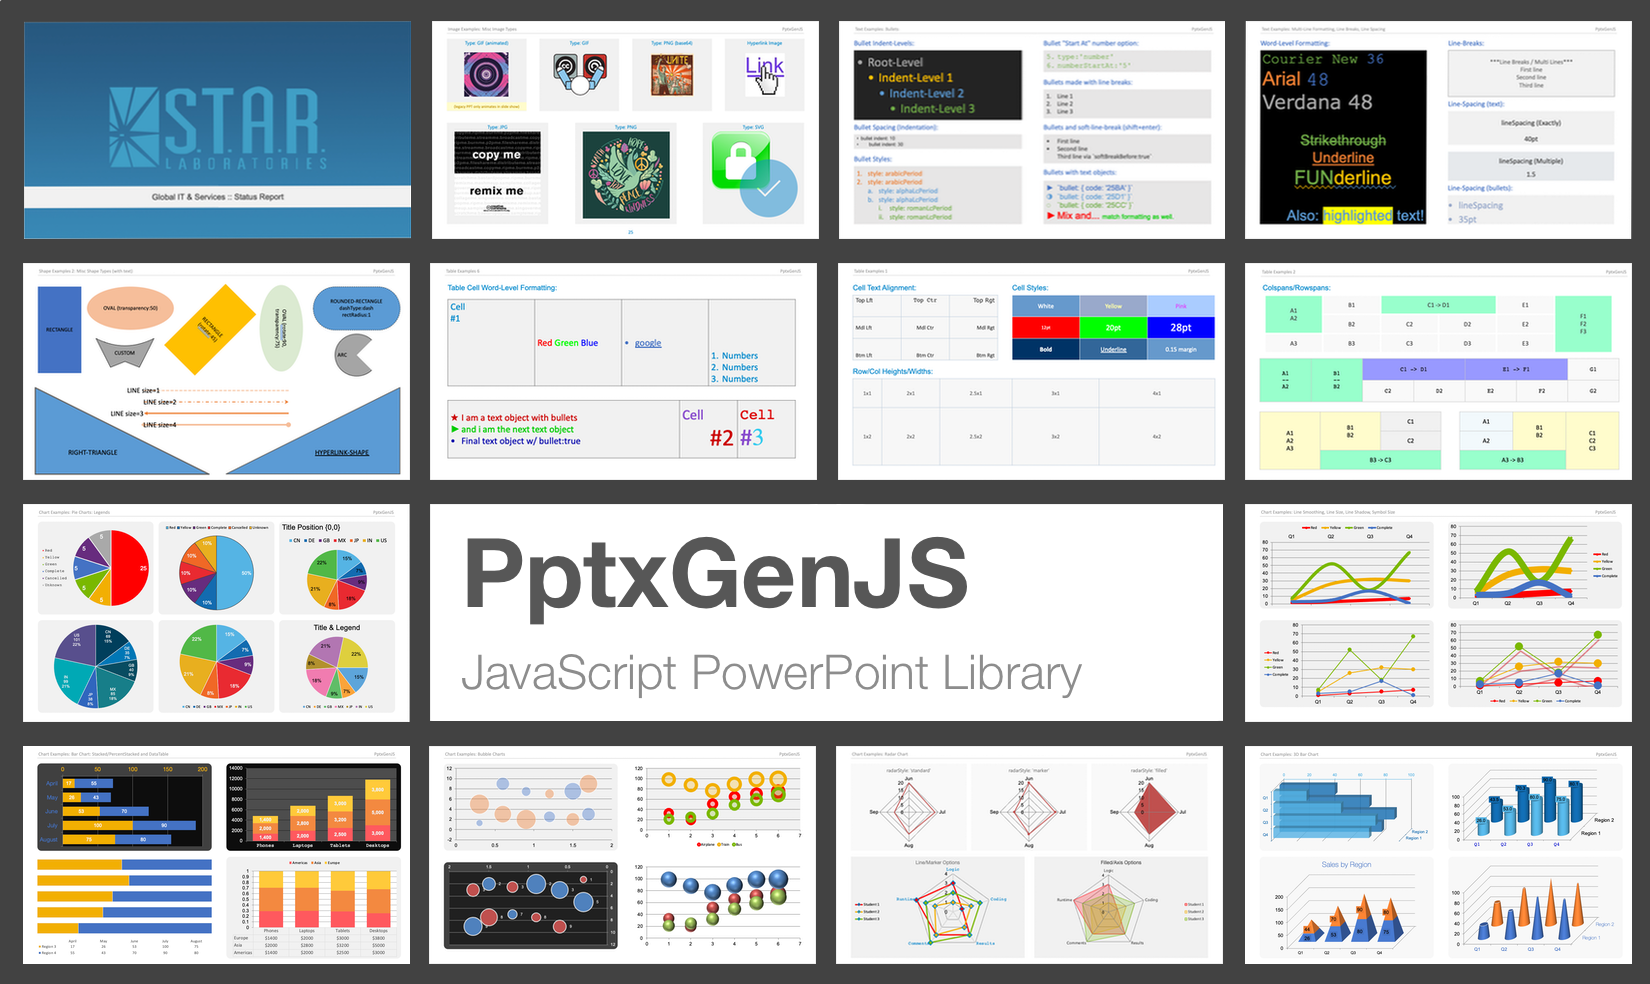
This library creates Open Office XML (OOXML) Presentations which are compatible with Microsoft PowerPoint, Apple Keynote, and other applications.
JQuery plugin for creating charts

JQuery Linechart JQuery plugin for building a linechart. Chart ruler completely on HTML/CSS/JS. Bar chart, calendar view visualisation. Diagram, graph
📈 A small, fast chart for time series, lines, areas, ohlc & bars

📈 μPlot A small (~35 KB min), fast chart for time series, lines, areas, ohlc & bars (MIT Licensed) Introduction μPlot is a fast, memory-efficient Can
Smoothie Charts: smooooooth JavaScript charts for realtime streaming data
Smoothie Charts is a really small charting library designed for live streaming data. I built it to reduce the headaches I was getting from watching ch
Chart image and QR code web API
QuickChart QuickChart is a service that generates images of charts from a URL. Because these charts are simple images, they are very easy to embed in
Emprise Javascript Charts
EJSChart 100% Powerful, Clean & Functional Javascript Charts Whether at home, a medium sized or enterprise venture, EJSCharts will seamlessly help you
Create beautiful JavaScript charts with one line of Ruby
Chartkick Create beautiful JavaScript charts with one line of Ruby. No more fighting with charting libraries! See it in action Chartkick 4.0 was recen
📊 Interactive JavaScript Charts built on SVG
A modern JavaScript charting library to build interactive charts and visualizations with simple API. Our Partner ApexCharts is now a partner of Fusion
Open-source JavaScript charting library behind Plotly and Dash
Plotly.js is a standalone Javascript data visualization library, and it also powers the Python and R modules named plotly in those respective ecosyste
Apache ECharts is a powerful, interactive charting and data visualization library for browser
Apache ECharts Apache ECharts is a free, powerful charting and visualization library offering an easy way of adding intuitive, interactive, and highly
Compose complex, data-driven visualizations from reusable charts and components with d3
d3.compose Compose rich, data-bound charts from charts (like Lines and Bars) and components (like Axis, Title, and Legend) with d3 and d3.chart. Advan
JQuery plugin for creating charts
JQuery Linechart JQuery plugin for building a linechart. Chart ruler completely on HTML/CSS/JS. Bar chart, calendar view visualisation. Diagram, graph
Progressive svg pie, donut, bar and line charts
Peity Peity (sounds like deity) is a jQuery plugin that converts an element's content into a mini svg pie, donut, line or bar chart. Basic Usage HTM
👻 The #1 headless Node.js CMS for professional publishing

Ghost.org | Features | Showcase | Forum | Docs | Contributing | Twitter Love open source? We're hiring Node.js Engineers to work on Ghost full-time Th
Ember.js - A JavaScript framework for creating ambitious web applications

Ember.js is a JavaScript framework that greatly reduces the time, effort and resources needed to build any web application. It is focused on making yo
👻 The #1 headless Node.js CMS for professional publishing
Ghost.org | Features | Showcase | Forum | Docs | Contributing | Twitter Love open source? We're hiring Node.js Engineers to work on Ghost full-time Th
📓 The UI component explorer. Develop, document, & test React, Vue, Angular, Web Components, Ember, Svelte & more!
Build bulletproof UI components faster Storybook is a development environment for UI components. It allows you to browse a component library, view the
📱📈An elegant, interactive and flexible charting library for mobile.

中文 README F2 is born for mobile, developed for developers as well as designers. It is Html5 Canvas-based, and is also compatible with Node.js, Weex an
nivo provides a rich set of dataviz components, built on top of the awesome d3 and Reactjs libraries

nivo provides supercharged React components to easily build dataviz apps, it's built on top of d3. Several libraries already exist for React d3 integr
A collection of composable React components for building interactive data visualizations

an ecosystem of composable React components for building interactive data visualizations. Victory Contents Getting Started Victory Native API Document
📓 The UI component explorer. Develop, document, & test React, Vue, Angular, Web Components, Ember, Svelte & more!
Build bulletproof UI components faster Storybook is a development environment for UI components. It allows you to browse a component library, view the
Ember.js - A JavaScript framework for creating ambitious web applications
Ember.js is a JavaScript framework that greatly reduces the time, effort and resources needed to build any web application. It is focused on making yo
📊 Data visualization library for React based on D3
Data visualization library for React based on D3js REAVIZ is a modular chart component library that leverages React natively for rendering the compone
Composable data visualisation library for web with a data-first approach now powered by WebAssembly
What is Muze? Muze is a free data visualization library for creating exploratory data visualizations (like Tableau) in browser, using WebAssembly. It
Create beautiful JavaScript charts with one line of React
React Chartkick Create beautiful JavaScript charts with one line of React See it in action Supports Chart.js, Google Charts, and Highcharts Quick Star
Financial lightweight charts built with HTML5 canvas
Lightweight Charts Demos | Documentation | Discord community TradingView Lightweight Charts are one of the smallest and fastest financial HTML5 charts
Reusable JavaScript library for creating sketchy/hand-drawn styled charts in the browser.

roughViz.js is a reusable JavaScript library for creating sketchy/hand-drawn styled charts in the browser, based on D3v5, roughjs, and handy. Why? Use
A friendly reusable charts DSL for D3
D4 D4 is a friendly charting DSL for D3. The goal of D4 is to allow developers to quickly build data-driven charts with little knowledge of the intern
Ember Charts 3.5 2.3 L2 JavaScript A powerful and easy to use charting library for Ember.js
Ember Charts A charting library built with the Ember.js and d3.js frameworks. It includes time series, bar, pie, and scatter charts which are easy to
Create beautiful charts with one line of JavaScript
Chartkick.js Create beautiful charts with one line of JavaScript See it in action Supports Chart.js, Google Charts, and Highcharts Also available for
Awesome charts for AngularJS.

n3-line-chart v2 n3-line-chart is an easy-to-use JavaScript library for creating beautiful charts in AngularJS applications and it is built on top of
A plugin for the jQuery javascript library to generate small sparkline charts directly in the browser
jQuery Sparklines This jQuery plugin makes it easy to generate a number of different types of sparklines directly in the browser, using online a line
:dango: An interactive and responsive charting library
English | 简体中文 G2Plot A charting library based on the Grammar of Graphics. G2Plot is an interactive and responsive charting library. Based on the gram
Charts for Raphaël
g.Raphaël - Official charting plugin for Raphaël For more information, see: http://g.raphaeljs.com/ Changelog v0.51 Fixed issues with piechart related
Progressive svg pie, donut, bar and line charts
Peity Peity (sounds like deity) is a jQuery plugin that converts an element's content into a mini svg pie, donut, line or bar chart. Basic Usage HTM
JavaScript toolkit for creating interactive real-time graphs
Rickshaw Rickshaw is a JavaScript toolkit for creating interactive time series graphs, developed at Shutterstock Table of Contents Getting Started Ins
Attractive JavaScript charts for jQuery
flot About flot is a JavaScript plotting library for engineering and scientific applications derived from Flot: http://www.flotcharts.org/ Take a look
JavaScript diagramming library for interactive flowcharts, org charts, design tools, planning tools, visual languages.
GoJS, a JavaScript Library for HTML Diagrams GoJS is a JavaScript and TypeScript library for creating and manipulating diagrams, charts, and graphs. S
📊 A highly interactive data-driven visualization grammar for statistical charts.

English | 简体中文 G2 A highly interactive data-driven visualization grammar for statistical charts. Website • Tutorial Docs • Blog • G2Plot G2 is a visua
Simple, responsive, modern SVG Charts with zero dependencies

Frappe Charts GitHub-inspired modern, intuitive and responsive charts with zero dependencies Explore Demos » Edit at CodePen » Contents Installation U
Simple responsive charts
Big welcome by the Chartist Guy Checkout the documentation site at http://gionkunz.github.io/chartist-js/ Checkout this lightning talk that gives you
Simple HTML5 Charts using the canvas tag
Simple yet flexible JavaScript charting for designers & developers Documentation Currently, there are two versions of the library (2.9.4 and 3.x.x). V
Apache ECharts is a powerful, interactive charting and data visualization library for browser
Apache ECharts Apache ECharts is a free, powerful charting and visualization library offering an easy way of adding intuitive, interactive, and highly